-
-
Load Balance Control-Plane Traffic that is based on Diameter, SIP, and SMPP Protocols
-
Provide Subscriber Load Distribution Using GSLB Across Core-Networks of a Telecom Service Provider
This content has been machine translated dynamically.
Dieser Inhalt ist eine maschinelle Übersetzung, die dynamisch erstellt wurde. (Haftungsausschluss)
Cet article a été traduit automatiquement de manière dynamique. (Clause de non responsabilité)
Este artículo lo ha traducido una máquina de forma dinámica. (Aviso legal)
此内容已经过机器动态翻译。 放弃
このコンテンツは動的に機械翻訳されています。免責事項
이 콘텐츠는 동적으로 기계 번역되었습니다. 책임 부인
Este texto foi traduzido automaticamente. (Aviso legal)
Questo contenuto è stato tradotto dinamicamente con traduzione automatica.(Esclusione di responsabilità))
This article has been machine translated.
Dieser Artikel wurde maschinell übersetzt. (Haftungsausschluss)
Ce article a été traduit automatiquement. (Clause de non responsabilité)
Este artículo ha sido traducido automáticamente. (Aviso legal)
この記事は機械翻訳されています.免責事項
이 기사는 기계 번역되었습니다.책임 부인
Este artigo foi traduzido automaticamente.(Aviso legal)
这篇文章已经过机器翻译.放弃
Questo articolo è stato tradotto automaticamente.(Esclusione di responsabilità))
Translation failed!
Troubleshooting Guidelines
Technical Support
All troubleshooting and escalation queries require a recent Citrix® ADC techsupport bundle, which captures current configuration, firmware version installed, log files, outstanding cores, and others.
Example:
show techsupport

showtechsupport data collector tool - $Revision: #5 $!
...
All the data will be collected under
        /var/tmp/support/collector_P_192.168.121.117_18Jun2015_09_53
...
Archiving all the data into "/var/tmp/support/collector_P_192.168.121.117_18Jun2015_09_53.tar.gz" ....
Created a symbolic link for the archive with /var/tmp/support/support.tgz
/var/tmp/support/support.tgz  ---- points to ---> /var/tmp/support/collector_P_192.168.121.117_18Jun2015_09_53.tar.gz

After a techsupport bundle has been generated, it might be copied using SCP.
<!--NeedCopy-->
Traces
Citrix ADC TCP optimization issues normally require Citrix ADC traces to troubleshoot properly. Note that one should try to capture traces under similar conditions, i.e. on the same cell, during the same time of day, using the same user equipment and application, and others.
The start nstrace and stop nstrace commands might be used to capture traces:
- It’s strongly recommended that the appropriate filter is used to avoid capturing extraneous, unnecessary packets on the trace. For instance use start nstrace -filter ‘IP == 10.20.30.40’ to only capture packets being sent to or received from IP address 10.20.30.40, which is the user equipment IP address.
- Do not use the -tcpdump option, since it strips the nstrace headers which are required for debugging.
Trace Analysis
After a Citrix ADC trace has been captured, it might be viewed with Wireshark 1.12 or later. Verify that the captured traces include the appropriate Citrix ADC Packet Trace headers, as shown in the screen capture below:
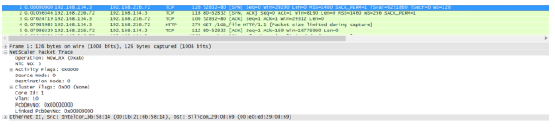
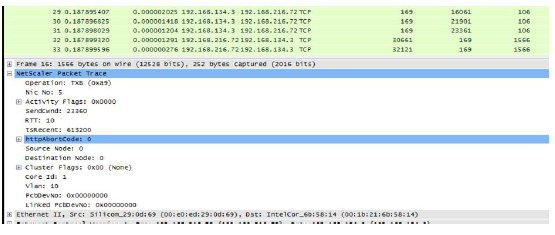
The additional debug headers are also visible per the illustration below:
Connection Table
When the issue is related to TCP optimization and it can be reproduced or it’s on-going, it is best to get also the connection table when the issue occurs from the primary T1 node.
To get the table you shall need to switch to the BSD shell and run the following command:
shell
...

nscli -U 127.0.0.1:nsroot:nsroot show connectiontable -detail full link > /var/tmp/contable.log
<!--NeedCopy-->
Note
The command might be executed for a longer time and management CPU might be stressed at that time (depends on the number of connection table entries), but it’s not service affecting.
Share
Share
This Preview product documentation is Cloud Software Group Confidential.
You agree to hold this documentation confidential pursuant to the terms of your Cloud Software Group Beta/Tech Preview Agreement.
The development, release and timing of any features or functionality described in the Preview documentation remains at our sole discretion and are subject to change without notice or consultation.
The documentation is for informational purposes only and is not a commitment, promise or legal obligation to deliver any material, code or functionality and should not be relied upon in making Cloud Software Group product purchase decisions.
If you do not agree, select I DO NOT AGREE to exit.