Configure thresholds in service graph
As an administrator, you can configure thresholds for Kubernetes services. NetScaler Console displays the service status (Critical, Review, and Good) based on the service response time and error count. By default, you can view the Default Threshold (service response time = 200 ms and error count = 0) applied to all services.
Note
You cannot delete the Default Threshold.
To configure a new threshold:
-
In Applications > Service Graph, click the Microservices tab:
-
Click the settings icon and select the Thresholds tab.
-
Click New Threshold to configure a new threshold.
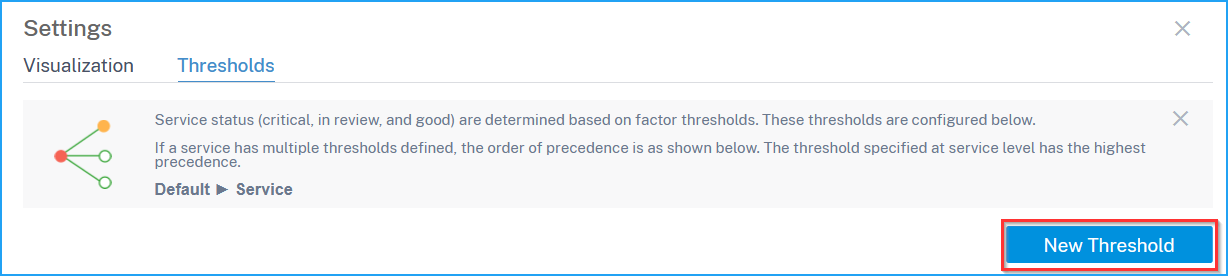
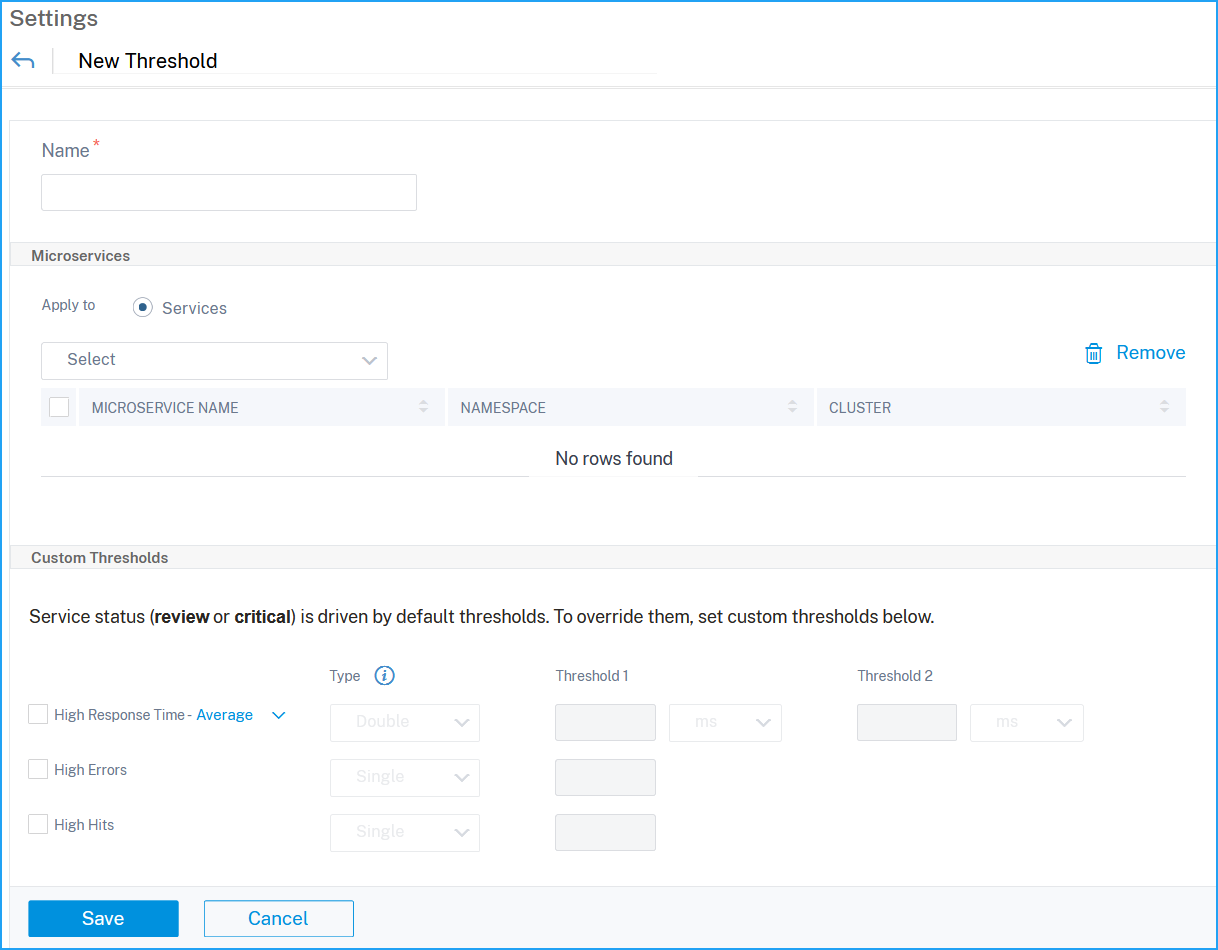
The New Threshold page is displayed.
-
Configure the following parameters:
-
Name – Specify a name for the threshold.
-
Under Microservices, select the services that you want to apply the threshold.
-
Under Thresholds, select Single or Double for:
-
High Response Time (Average, P99, P99.9)
-
High Errors
-
High Hits
-
-
Specify the threshold values.
Note
If you select double threshold, ensure:
-
Threshold 1 value is lesser than Threshold 2 value. For example, if you configure Threshold 1 as 250 ms, Threshold 2 must be 251 ms or higher.
-
Threshold 1 value must not be same as Threshold 2 value.
-
-
-
Click Save.
The threshold is successfully created. You can view the threshold details in the Thresholds page.
Note
NetScaler Console calculates the service final score and status based on the selected metrics. For example, if you select only High Hits for the threshold configuration, NetScaler Console uses the default threshold (response time = 200 ms and error count = 0) and high hits to calculate the service score and status.
Single threshold
When you configure single threshold for all metrics or selected metrics, NetScaler Console:
-
Compares the current values in each metric with the configured threshold values in each metric
-
Calculates the total penalty based on the exceeded thresholds in each metric
Note
If any metric has not breached the threshold value, the penalty is calculated accordingly
-
Displays the service score and service status based on the penalty calculation
Double threshold
When you configure double threshold for all metrics or selected metrics, NetScaler Console:
-
Compares the current values in each metric with the configured threshold values in each metric
-
Checks if the current values are:
-
Lesser than threshold 1
-
Between threshold 1 and threshold 2
-
Greater than threshold 2
-
-
Calculates the total penalty based on the exceeded thresholds in each metric
Note
If any metric has not breached the threshold value, the penalty is calculated accordingly
-
Displays the service score and service status based on the penalty calculation