-
-
-
View network efficiency
-
Compare the data volume used by optimized and unoptimized ABR videos
-
View the type of videos streamed and data volume consumed from your network
-
Compare bandwidth consumption of optimized and unoptimized ABR videos
-
Compare optimized and unoptimized number of plays of ABR videos
-
-
-
Citrix ADC automation using Citrix ADM in Cisco ACI hybrid mode
-
Citrix ADC device package in Cisco ACI's cloud orchestrator mode
-
This content has been machine translated dynamically.
Dieser Inhalt ist eine maschinelle Übersetzung, die dynamisch erstellt wurde. (Haftungsausschluss)
Cet article a été traduit automatiquement de manière dynamique. (Clause de non responsabilité)
Este artículo lo ha traducido una máquina de forma dinámica. (Aviso legal)
此内容已经过机器动态翻译。 放弃
このコンテンツは動的に機械翻訳されています。免責事項
이 콘텐츠는 동적으로 기계 번역되었습니다. 책임 부인
Este texto foi traduzido automaticamente. (Aviso legal)
Questo contenuto è stato tradotto dinamicamente con traduzione automatica.(Esclusione di responsabilità))
This article has been machine translated.
Dieser Artikel wurde maschinell übersetzt. (Haftungsausschluss)
Ce article a été traduit automatiquement. (Clause de non responsabilité)
Este artículo ha sido traducido automáticamente. (Aviso legal)
この記事は機械翻訳されています.免責事項
이 기사는 기계 번역되었습니다.책임 부인
Este artigo foi traduzido automaticamente.(Aviso legal)
这篇文章已经过机器翻译.放弃
Questo articolo è stato tradotto automaticamente.(Esclusione di responsabilità))
Translation failed!
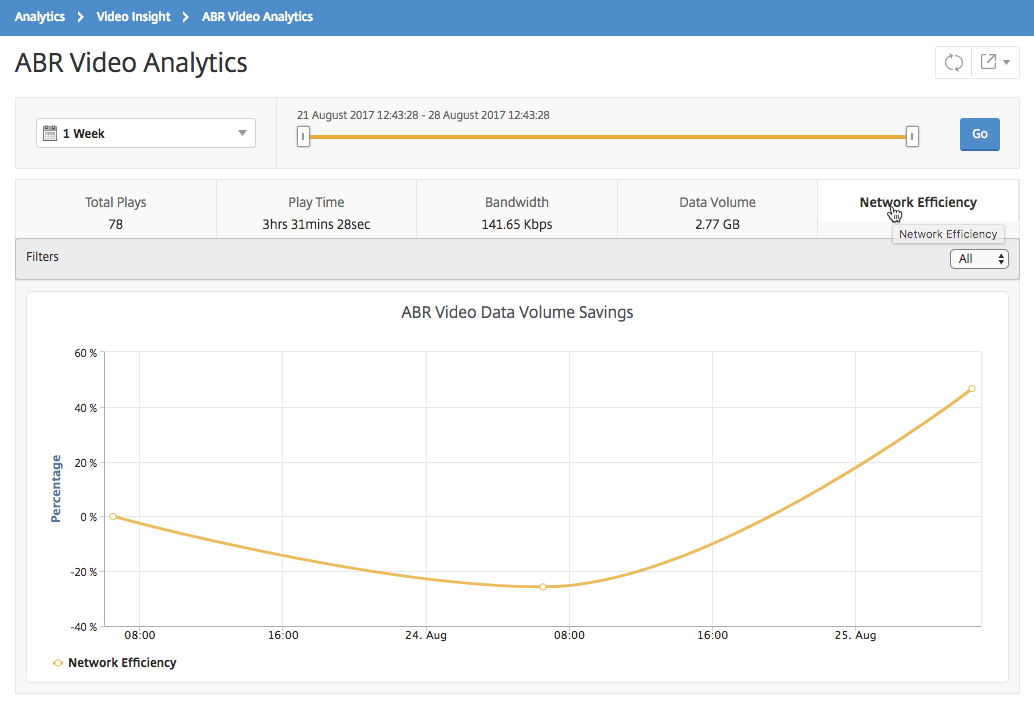
View network efficiency
For a given time frame, Citrix Application Delivery Management (ADM) provides a graph that shows the ratio of optimized to unoptimized video sessions in the time frame. It also displays the percentage of bandwidth saved by optimization. The percentage of bandwidth saved is calculated with the following formula:
Percentage of bandwidth saved = Average optimized ABR video Data Volume / Average of unoptimized ABR Video Data Volume.
To see the percentage of bandwidth saved by optimization, log on to Citrix ADM, navigate to Analytics > Video Insight, and click ABR Video. Then, in the right pane, select a time frame from the drop-down list. You can further customize the time frame by using the time-frame slider. Click Go and select the Network Efficiency tab.
Share
Share
In this article
This Preview product documentation is Cloud Software Group Confidential.
You agree to hold this documentation confidential pursuant to the terms of your Cloud Software Group Beta/Tech Preview Agreement.
The development, release and timing of any features or functionality described in the Preview documentation remains at our sole discretion and are subject to change without notice or consultation.
The documentation is for informational purposes only and is not a commitment, promise or legal obligation to deliver any material, code or functionality and should not be relied upon in making Cloud Software Group product purchase decisions.
If you do not agree, select I DO NOT AGREE to exit.