Internet Protocol version 6 (IPv6) acceleration
When you connect to the Internet through a device, the device is assigned an IP address. The IP address identifies the appliance and indicates its location. The number of devices connecting to the Internet is rapidly increasing. As a result, it is difficult to manage the request for the IP addresses with the existing version of Internet Protocol (IP), IPv4, which uses 32-bit addresses. By using IPv4, approximately 4.3 billion addresses can be assigned to the devices connecting to the Internet.
IPv6 addresses this issue by using 128-bit addresses and a hexadecimal label to identify the network interfaces of devices on an IPv6 network. Because IPv6 supports far more IP addresses than does IPv4, organizations and applications are gradually introducing support for the IPv6 protocol.
The IPv4 and IPv6 protocols are not interoperable, which makes the transition difficult. To accelerate the increasing IPv6 traffic from various applications supported on the Citrix SD-WAN WANOP appliance, you can enable the IPv6 Acceleration feature.
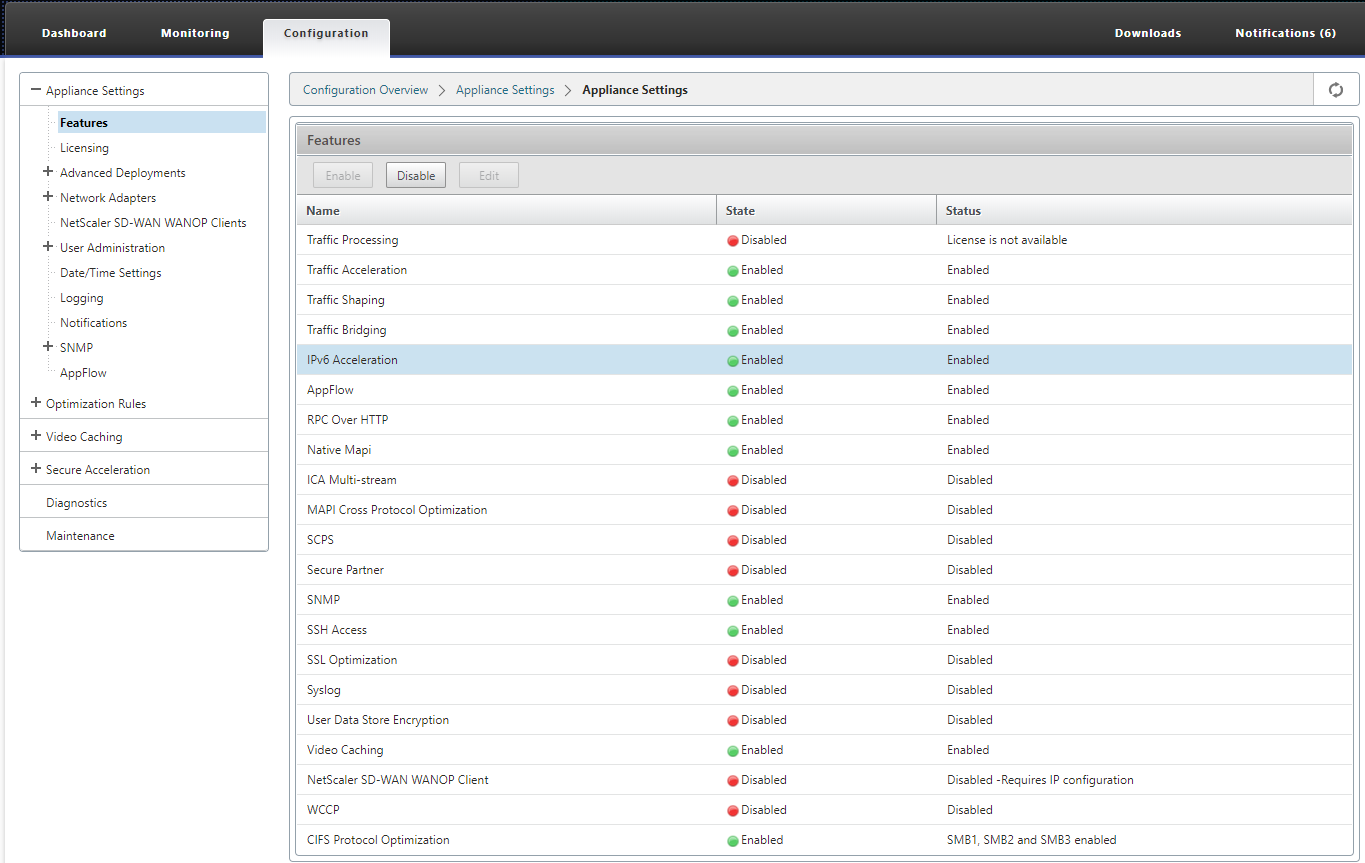
By default, IPv6 is disabled on the appliance. To enable IPv6 acceleration on a Citrix SD-WAN WANOP appliance, navigate to Configuration > Appliance Settings > Feature page and enable the IPv6 Acceleration feature.
Verify IPv6 connections
After enabling IPv6 acceleration on the appliance, the appliance starts accelerating traffic for the applications using IPv6 protocol. To make sure that the appliance is accelerating the IPv6 traffic, you can monitor such connections on the appliance.
To monitor the IPv6 connections, navigate to the Monitoring tab. The Connections page of the Monitoring tab display IPv6 protocols traffic related statistics:
Connections: The Connections page lists details of all the connections established with the appliance. This page consists of two tabs, Accelerated Connections and Unaccelerated Connections. The Accelerated Connections tab lists all connections that the appliance is accelerating. You can identify IPv6 traffic in this tab by referring to the Initiator and Responder column of each entry. If these columns contain hexadecimal IP address values, the entry represents an IPv6 connection, as shown in the following screen shot.
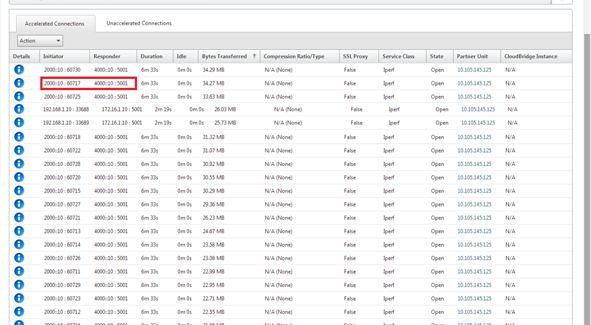
IPv6 connections that are not accelerated, are listed on the Unaccelerated Connections tab. If you want to accelerate these connections, you might need to troubleshoot and fine tune the application parameters on the appliance. As on the Accelerated Connections tab, you can identify the IPv6 connections on this tab by referring to the Initiator and Responder columns of each entry.
Top Applications: The Top Applications page provides granularity in the time frame that you can use to graphically represent the traffic throughput of various applications served by the Citrix SD-WAN appliance. By default, traffic throughput is displayed by the last minute. However, you can change the time frame by selecting Last Minute, Last Hour, Last Day, Last Week, or Last Month from the list available on the Title bar of the page. This page has three tabs, Top Applications Graphs, Since Last Restart, and Active Applications (Since Last Restart). The Top Applications Graphs tab contains the following statistics:
-
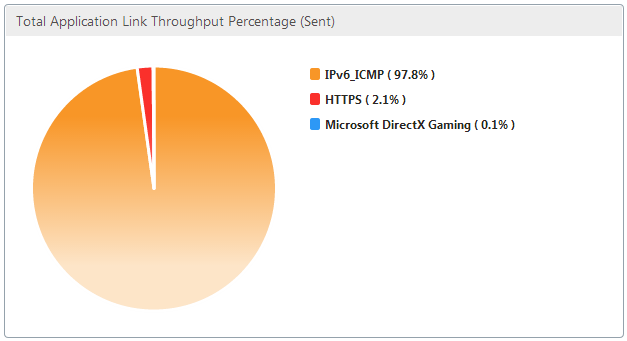
Total Application Link Throughput Percentage (Sent): This is a pie chart depicting the percentage of traffic that the appliance has sent to each application. If the appliance has sent a significant percentage of traffic for an application using IPv6 protocol, the application has its percentage of traffic depicted in this graph.
-
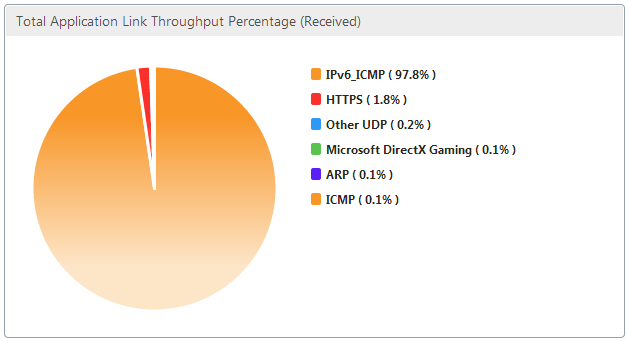
Total Application Link Throughput Percentage (Received): This is a pie chart depicting the percentage of traffic that the appliance has received from each application. If the appliance has received a significant percentage of traffic from an application using IPv6 protocol, the graph displays the percentage of traffic generated by the application.
-
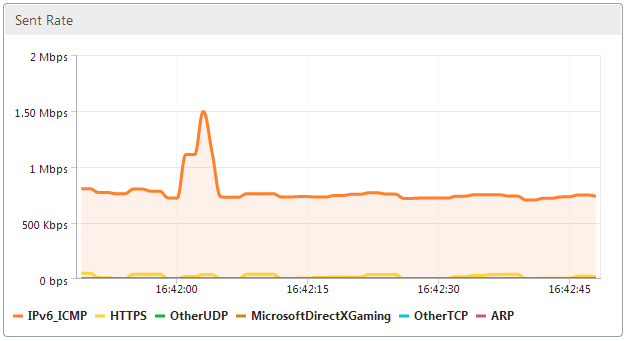
Sent Rate: This is a stacked graph of series of data depicting the rate, in bits per second, at which the appliance has sent traffic to each application. If the appliance has sent data to an application using IPv6 protocol, a series depicting each application using IPv6 protocol is also plotted on this graph.
-
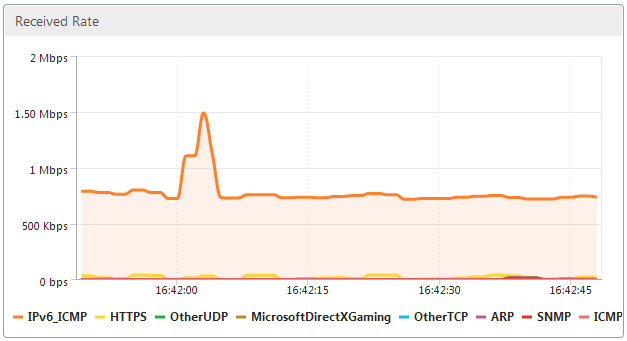
Received Rate: This is a stacked graph of series of data depicting the rate, in bits per second, at which the appliance has received traffic from each application. If the appliance has received data from an application using IPv6 protocol, a series depicting each application using IPv6 protocol is also plotted on this graph.
-
Top Applications table: This is a table of statistics for each application. The table lists all applications for which the appliance has served traffic, along with sent and received rates in bits per second, total bytes sent and received, percentage of the traffic for the application, and the rate at which the appliance has served traffic for the application. If the appliance has served traffic for an application using IPv6 protocol, the application is listed in this table, along with its statistics.

-
Application Groups: This is a table of statistics for each application, along with its application group and parent application, if any. The table lists bytes sent and received for the application. Each application, and its application group and parent application are displayed as hyperlinks. If you click the hyperlink, granular details of the statistics are displayed for the link you have clicked. If the appliance has served traffic for an application using IPv6 protocol, the application is listed in this table, along with its statistics.

The Since Last Restart tab contains statistics on the application traffic since the time you restarted the appliance. The tab contains the Total Application Link Throughput Percentage (Sent) and Total Application Link Throughput Percentage (Received) graphs, and Top Applications and Application Groups tables, depicting statistics similar to the Top Applications Graphs tab but with data since the appliance was restarted. The Active Applications (Since Last Restart) tab contains a table listing all active applications since the appliance was restarted. This table contains details about sent and receive rate, total bytes sent and received, and total packets sent and received for the applications.