-
-
-
Trace HTML Requests with Security Logs
-
This content has been machine translated dynamically.
Dieser Inhalt ist eine maschinelle Übersetzung, die dynamisch erstellt wurde. (Haftungsausschluss)
Cet article a été traduit automatiquement de manière dynamique. (Clause de non responsabilité)
Este artículo lo ha traducido una máquina de forma dinámica. (Aviso legal)
此内容已经过机器动态翻译。 放弃
このコンテンツは動的に機械翻訳されています。免責事項
이 콘텐츠는 동적으로 기계 번역되었습니다. 책임 부인
Este texto foi traduzido automaticamente. (Aviso legal)
Questo contenuto è stato tradotto dinamicamente con traduzione automatica.(Esclusione di responsabilità))
This article has been machine translated.
Dieser Artikel wurde maschinell übersetzt. (Haftungsausschluss)
Ce article a été traduit automatiquement. (Clause de non responsabilité)
Este artículo ha sido traducido automáticamente. (Aviso legal)
この記事は機械翻訳されています.免責事項
이 기사는 기계 번역되었습니다.책임 부인
Este artigo foi traduzido automaticamente.(Aviso legal)
这篇文章已经过机器翻译.放弃
Questo articolo è stato tradotto automaticamente.(Esclusione di responsabilità))
Translation failed!
Trace HTML requests with security logs
Note:
This feature is available in Citrix ADC release 10.5.e.
Troubleshooting a problem, which requires analysis of data received in the client request can be quite challenging specially when there is heavy traffic flowing through the box. Diagnosing issues which may affect the functionality or security of the application require a quick response.
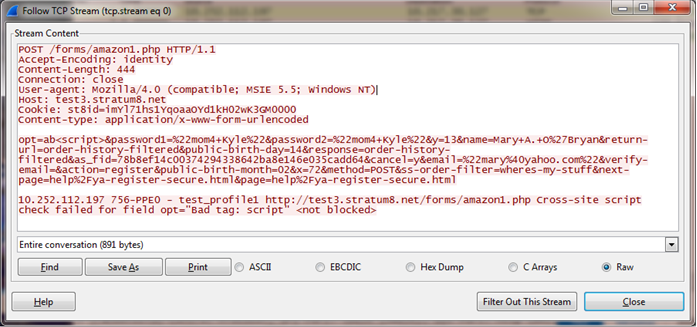
The Citrix® ADC now offers the option to isolate traffic for a specific Web App Firewall profile and collect nstrace for the HTML requests that trigger a log or block action or malformed requests that might be causing reset or aborts. The nstrace collected in –appfw mode will include details of the entire request including the Web App Firewall generated log messages. You can use “Follow TCP stream” in the trace to view the details of the individual transaction including headers, payload, as well as the corresponding log message, together in the same screen.
This gives you a comprehensive overview regarding your traffic. Having a detailed view of the request, payload, and associated log records can be very useful to analyze security check violation. You can easily identify the pattern that is triggering the violation. If the pattern should be allowed, you can take a decision to modify the configuration and/or add a relaxation rule.
This enhancement helps in troubleshooting the Citrix ADC and offers the following benefits:
- Isolate traffic for specific profile: This enhancement can be quite useful when you need to isolate traffic for only one profile or specific transactions of a profile for troubleshooting. You no longer have to skim through the entire data collected in the trace or need special filters to isolate requests that are of interest to you which can be tedious especially with heavy traffic. You now have the option to view only the data that you are interested in.
- Collect data for specific requests: The trace can be collected for a specified duration. You can collect trace for only a couple of requests to isolate, analyze, and debug specific transactions if needed.
- Identify resets or aborts: Unexpected closing of connections are not easily visible. The trace collected in –appfw mode captures a reset or an abort, triggered by the Web App Firewall. This allows a quicker isolation of issue when you do not see a security check violation message. Malformed requests or other non-RFC compliant requests terminated by Web App Firewall will now be easier to identify.
- View decrypted SSL traffic: HTTPS traffic is captured in plain text to allow for easier troubleshooting.
- Provides comprehensive view: Allows you to look at the entire request at the packet level, check the payload, look at the logs to check what security check violation is being triggered and identify the match pattern in the payload. If the payload consists of any unexpected data, junk strings, or non-printable characters (null character, \r or \n etc), they are easy to discover in the trace.
- Modify configuration: The debugging can provide useful information to decide if the observed behavior is the correct behavior or the configuration should be modified.
- Expedite response time: Faster debugging on target traffic can improve the response time to provide explanations and/or root cause analysis by Citrix engineering and support team.
Please see any task topic in eDocs for documenting tasks. Manual Configuration by using the command line interface
To configure debug tracing for a profile by using the command line interface
Step 1. Enable tracing for the profile. You can use the show command to verify the configured setting.
set appfw profile <profile> -trace ON
Step 2. Start collecting trace. You can continue to use all the options which are applicable for the nstrace command.
start nstrace -mode APPFW
Stop collecting the trace
stop nstrace
Location of the trace: The nstrace is stored in a time-stamped folder which is created in the /var/nstrace directory and can be viewed using wireshark. You can tail the /var/log/ns.log to see the log messages providing details regarding the location of the new trace.
Tips:
-
When –appfw mode option is used, the nstrace will only collect the data for the profile(s) for which “trace” was enabled.
- Enabling trace on the profile will not automatically start collecting the traces till you explicitly execute the “start nstrace” command to collect the trace.
-
Although, enabling trace on a profile may not have any adverse effect on the performance of the Web App Firewall but you may want to enable this feature only for the duration for which you want to collect the data. It is recommended that you turn the –trace flag off after you have collected the trace. This will prevent the risk of inadvertently getting data from profiles for which you had enabled this flag in the past.
-
The Block or Log action must be enabled for the security check for the transaction record to be included in the nstrace.
-
Resets and aborts will be logged independently of security checks actions when trace is “On” for the profile(s).
-
This feature is only applicable for troubleshooting the requests received from the client. The traces in –appfw mode do not include the responses received from the server.
-
You can continue to use all the options which are applicable for the nstrace command. For example,
start nstrace -tcpdump enabled -size 0 -mode appFW -
If a request triggers multiple violations, the nstrace for that record will include all the corresponding log messages.
-
CEF log message format is supported for this functionality.
-
Signature violations triggering block and/or log action for request side checks will also be included in the trace.
- Only HTML (non-XML) requests are collected in the trace.
Example of a Log record in the trace:
Share
Share
In this article
This Preview product documentation is Cloud Software Group Confidential.
You agree to hold this documentation confidential pursuant to the terms of your Cloud Software Group Beta/Tech Preview Agreement.
The development, release and timing of any features or functionality described in the Preview documentation remains at our sole discretion and are subject to change without notice or consultation.
The documentation is for informational purposes only and is not a commitment, promise or legal obligation to deliver any material, code or functionality and should not be relied upon in making Cloud Software Group product purchase decisions.
If you do not agree, select I DO NOT AGREE to exit.