Dashboard
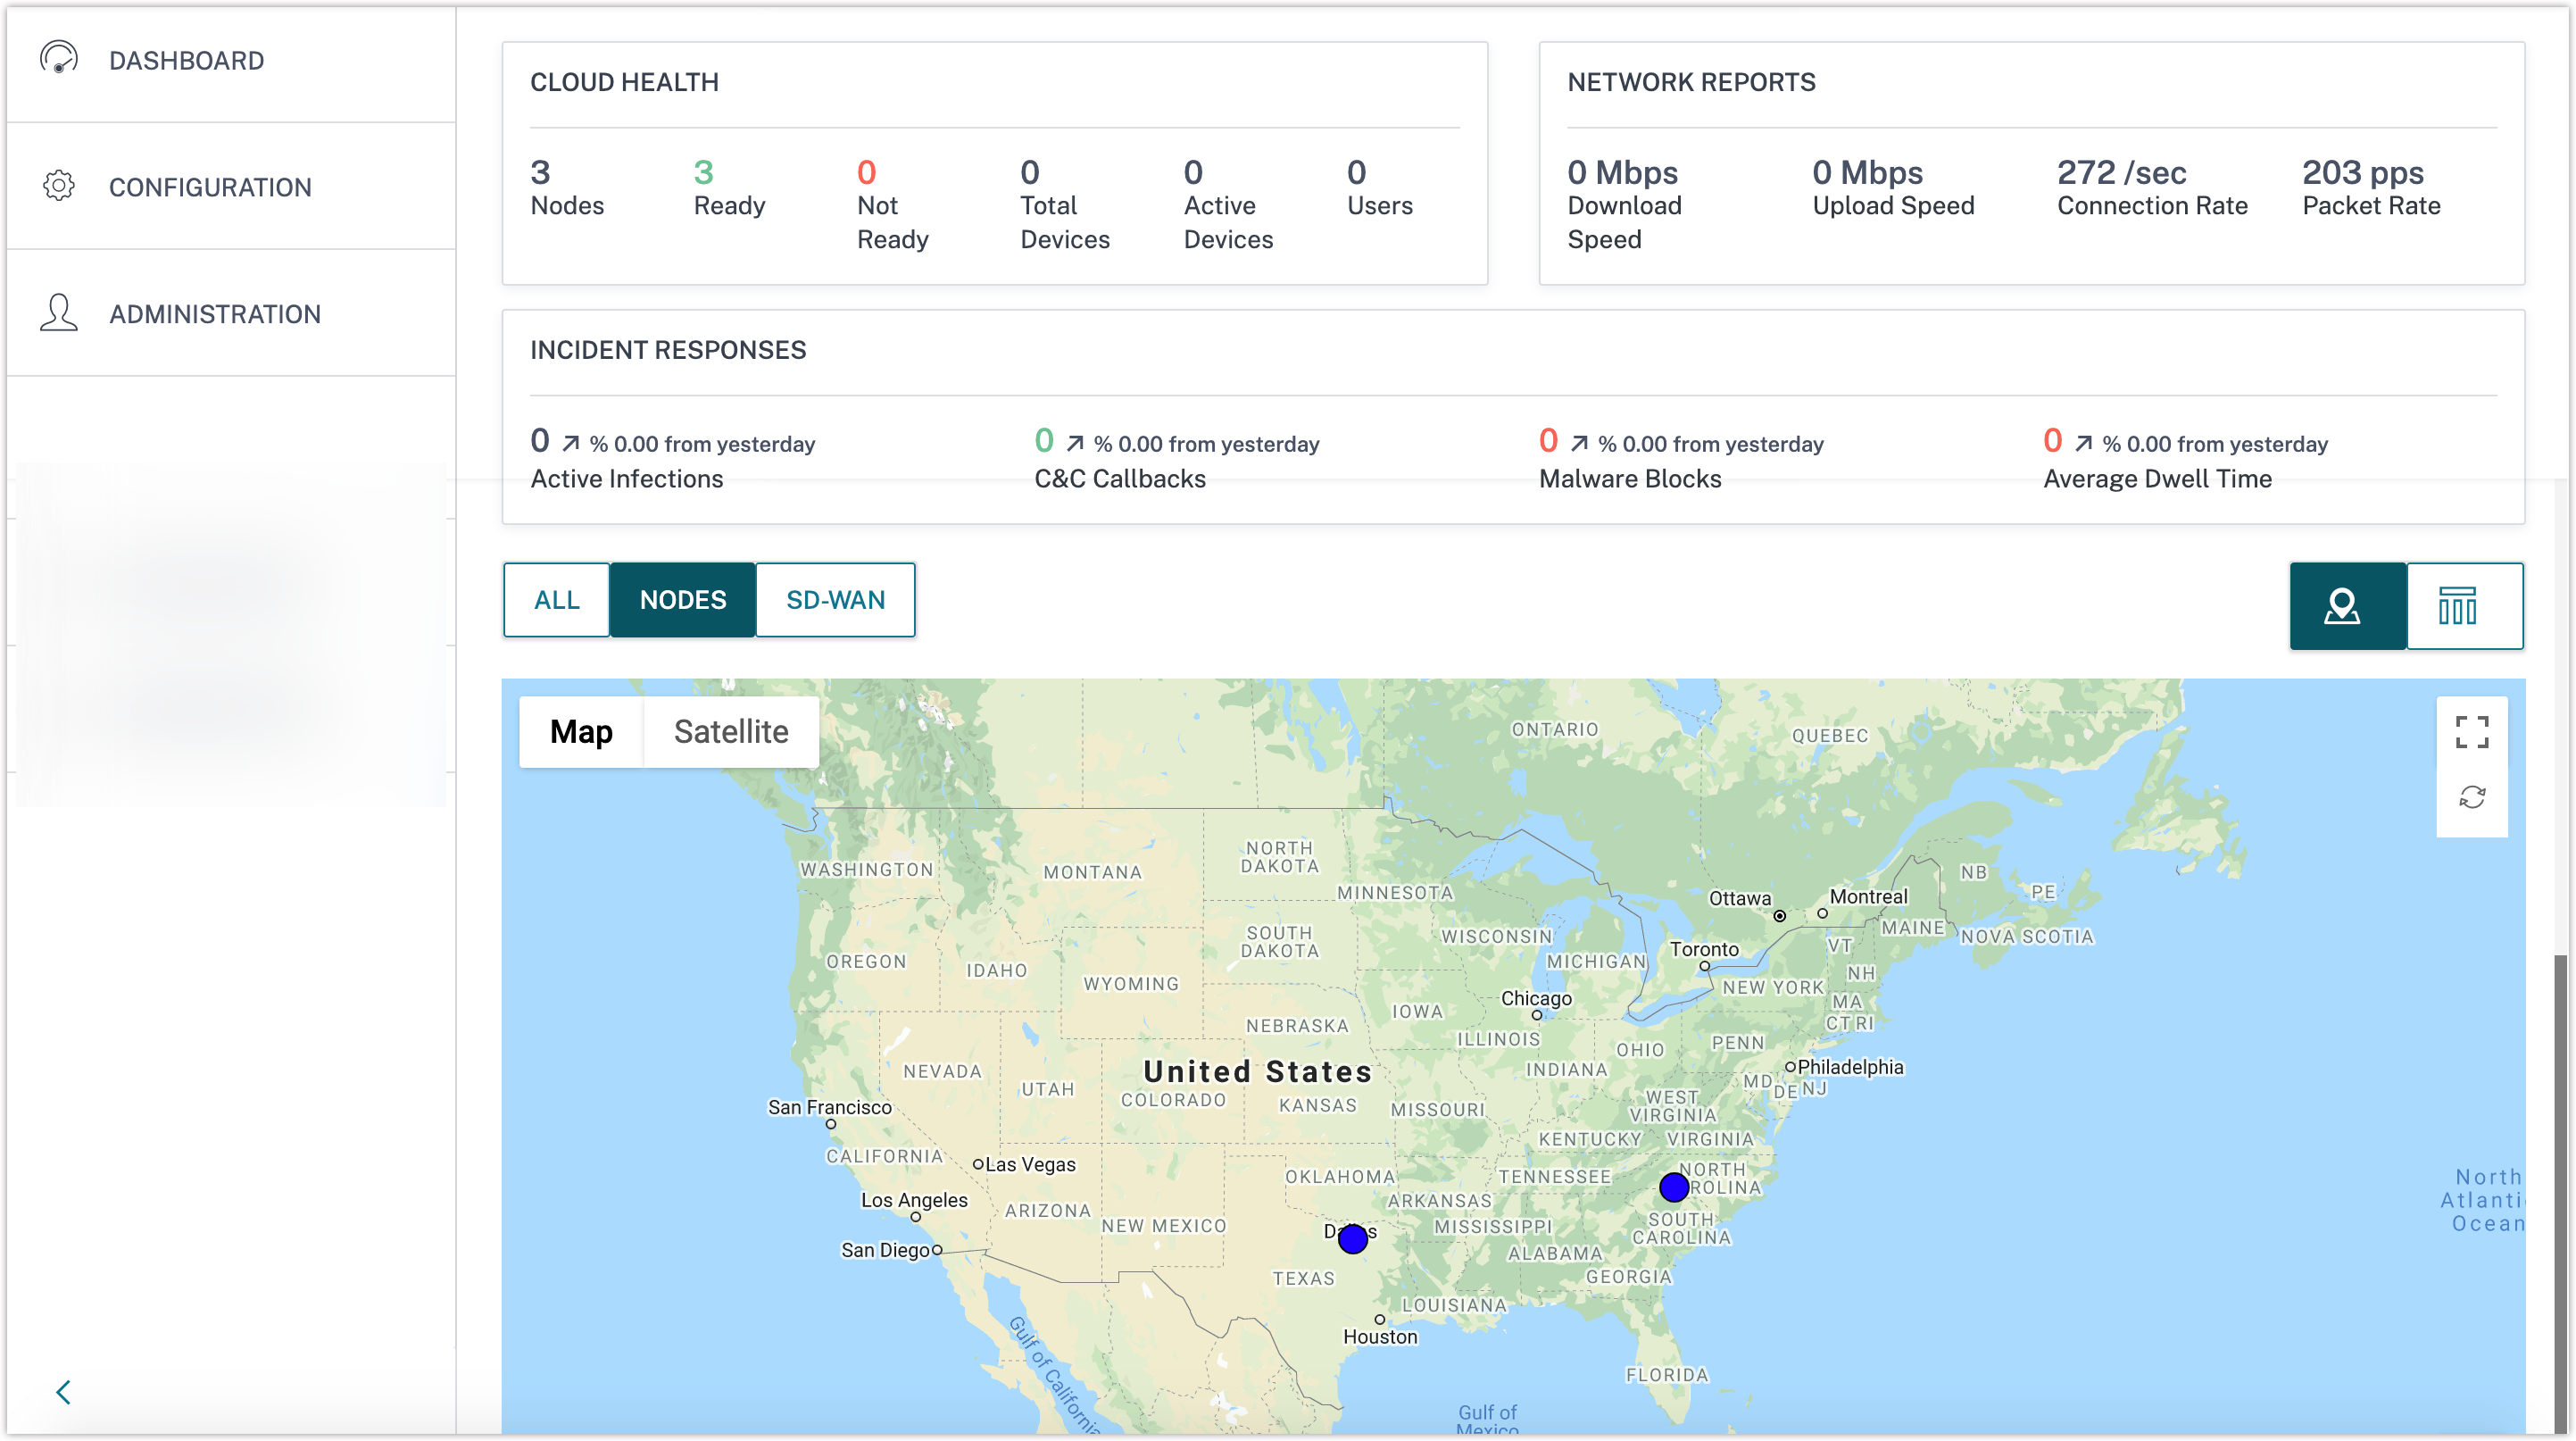
The Dashboard, as shown in the following image, provides a high-level view of the performance of your Citrix Secure Internet Access™ (CSIA) network.

The Dashboard includes four main sections: cloud health, network reports, incident responses, and a map view of the network.
You can access more detailed reports on the Reports & Analytics page. To do so, navigate to Configuration > Open Citrix® SIA Configuration.
Cloud health
This section gives you the status of the nodes in your network. View the total number of nodes that were configured for you. Also, view how many of those nodes are ready and how many are not ready.
A node that is Not Ready is not working or not provisioned, indicating a problem that you need to investigate or report so it can be fixed.
The cloud health section also provides insights into the total number of devices that are connected to the nodes and the number of active devices. It also allows you to track the number of users that are connected to the network.

Network reports
This section provides an overview of the real-time activity on your network. It lists the bandwidth usage such as download speed and upload speed for all connected devices. This section also provides insight into the rate of connections and packets used across the network.
Together, this information can tell you whether there might be a network issue that needs to be dealt with.

Incident responses
This section provides a high-level view of the infected devices in your network and that you need to investigate or report.
This section lists the following security data:
- the number of currently active infections in the network
- the number of Command and Control (C&C) callbacks
- the total number of malware that has been blocked from entering the network
- the average dwell-time of infections across the network.
This section also shows the percentage by which each of these incidents have increased since the previous day.

Notifications
Important updates relevant to your subscription to the Citrix Secure Internet Access service are sent to you as notifications in the Dashboard. Notifications include, but are not limited to:
- Information about license expiration
- Release notes of new builds
- URL review requests
- Alerts and advisories
Citrix informs you that you have notifications with a number on the bell icon. You can find the bell icon in the top right of the Dashboard. You can expand the notification view by selecting the bell icon. These notifications are displayed only in the bell icon and not sent by email.
Map view
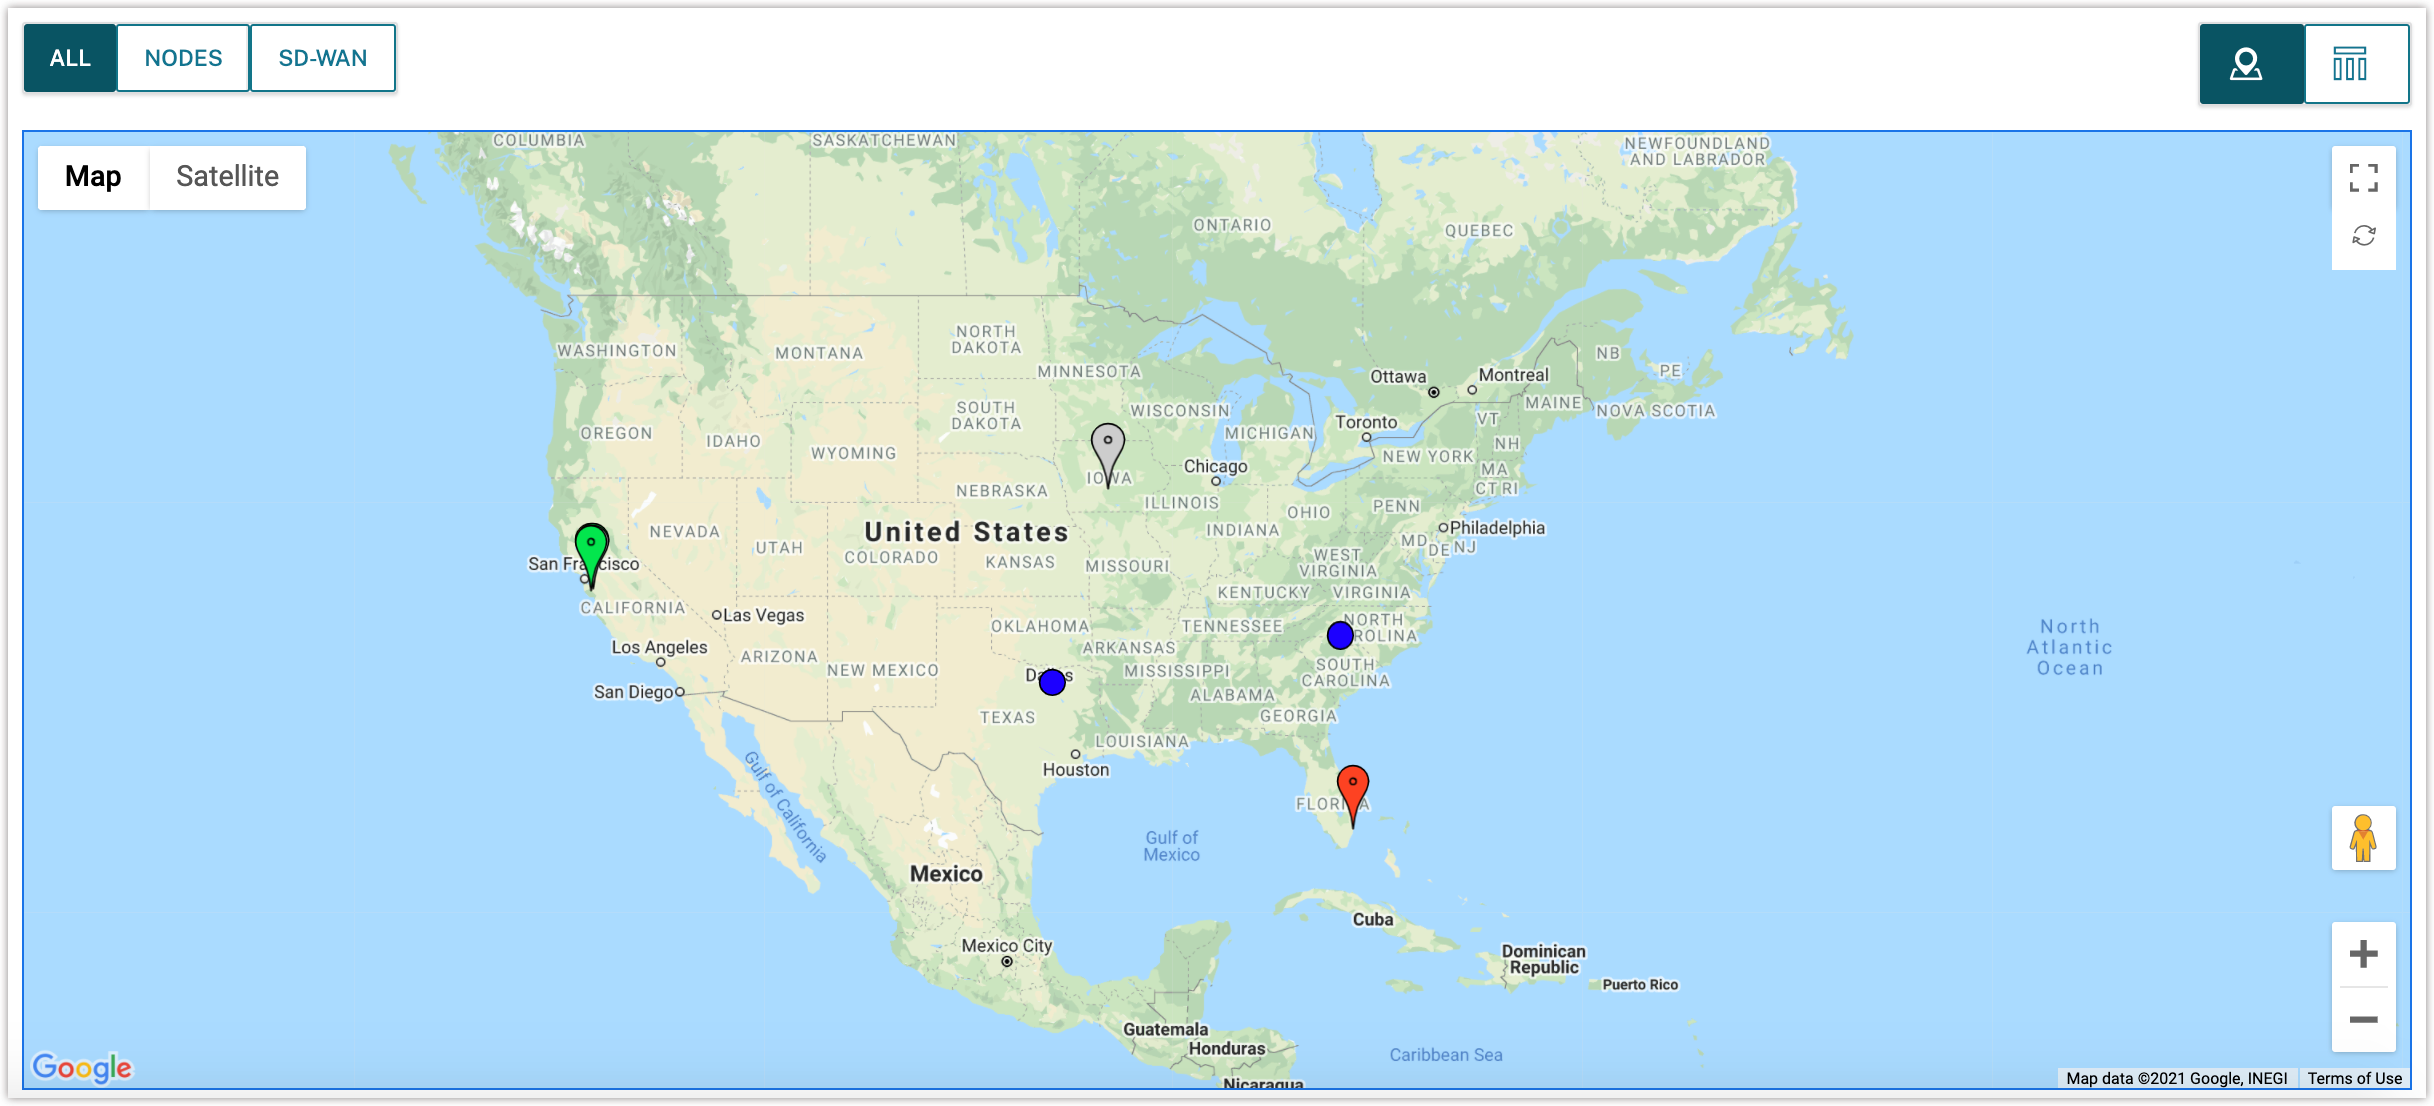
The map view shows the geographical locations of the cloud and gateway nodes of your Citrix Secure Internet Access deployment. The blue dots represent nodes on the map.
If you have an SD-WAN entitlement, you can see the geo locations of your SD-WAN sites. The sites are indicated in green, red, or gray on the map.
You can limit this view to Citrix Secure Internet Access nodes by selecting the Nodes tab or to SD-WAN sites by selecting the SD-WAN tab.

To view this information in a tabular format, select the table view icon to the far right, directly above the map. To switch back to the map view, select the map view icon located to the left of the table view icon.
