Application dashboard overview
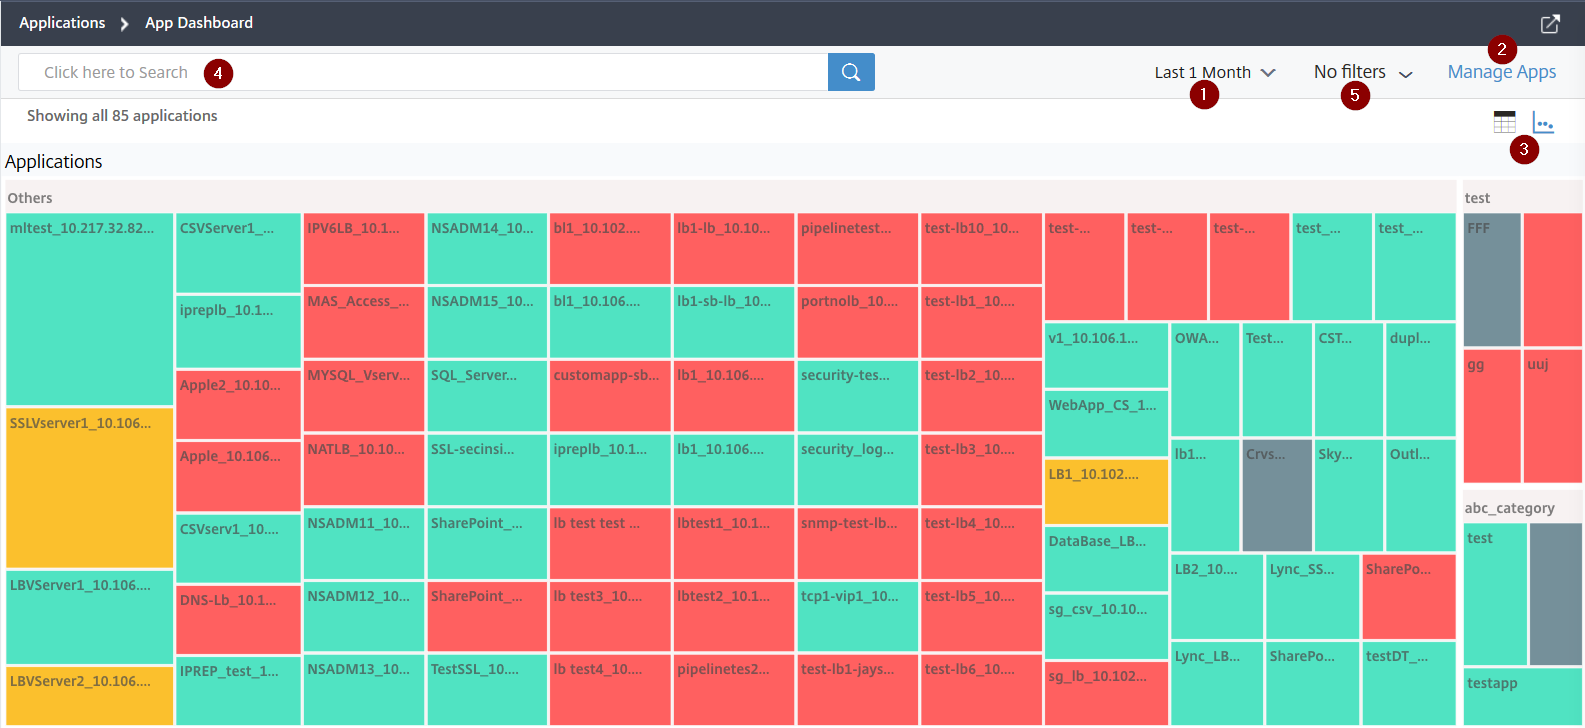
The application dashboard displays the discrete applications under Others and the custom applications that are grouped under their respective categories.
Navigate to Application > Dashboard to view the app dashboard.

1 – Displays the application details for the selected time duration such as 1 hour, 1 day, 1 week, and 1 month.
2 – Enables you to manage applications and add new applications
3 – Enables you to view applications either in table view or in graph view
4 – Enables you to search an application using the search bar
5 – Enables you to apply filters to view applications. Click to view for details.

You can select the carousel slider that enables you an ease of access to all options.
You can:
-
Select to view applications based on the scores.
-
Critical – Application score is between 0 and < 40
-
Fair – Application score is between 40 and < 75
-
Good – Application score is greater than 75
-
Not Applicable – No virtual servers are configured for the application
The following table describes the differences between the earlier app score and the present app score.
Application score (Critical, Review, Good, Not Applicable) App score (earlier view with color legends) Score is calculated as 100 minus penalty score of all application current issues Score is calculated as 100 – (App server resource + NetScaler system resource) Applications are displayed in colors such Red (critical), Orange (review), Green (good), and Gray (Not Applicable) Applications are displayed in color legends. 
-
-
Select to view applications based on the application status such as Up, Down, and Out of Service
-
Select to view applications based on the application type such as Discrete or Custom
-
Select to view applications based on the categories grouped underneath
-
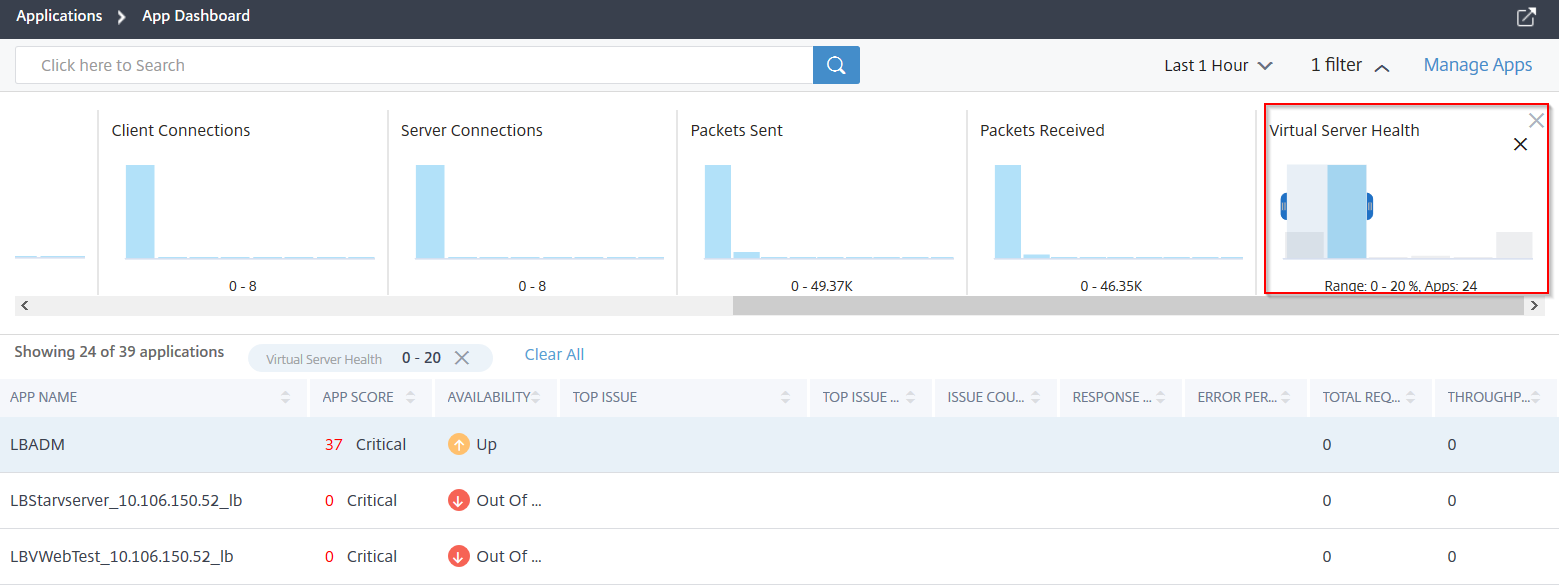
Drag the histogram to apply filters and view applications.
For example, if you want to view applications that have Virtual Server Health between 0 and 20, drag the Virtual Server Health histogram to filter the results.

Note
You can also click the histogram to get the relevant applications displayed.
Click Clear All to clear the applied filter.

The following are the application summary for which you can apply filters:
-
Response Time – A histogram that displays the average response time received by the applications
-
Error Rate – A histogram that displays the average error percentage of 5xx errors for the applications
-
Total Requests – A histogram that displays the total number of requests received by the applications
-
Throughput – A histogram that displays the total network throughput processed by the applications
-
Data Volume – A histogram that displays the total data processed by the applications. Data volume is calculated by the total request bytes and response bytes for the applications.
-
Client Connections – A histogram that displays the average client connections established by the applications
-
Server Connections – A histogram that displays the average server connections established by the applications
-
Packets Sent – A histogram that displays the total packets sent by the applications
-
Packets Received – A histogram that displays the total packets received by the applications
-
Virtual Server Health – A histogram that displays the total applications between the score range 0% to 100%. A virtual server health is (%) of active services associated with the application. For example, if a virtual server is configured with 2 services and if one of them is down, the score is 50%.
-
Search and filter results using the search bar
You can place the mouse pointer on the search bar and select the category to refine the search.