View service details
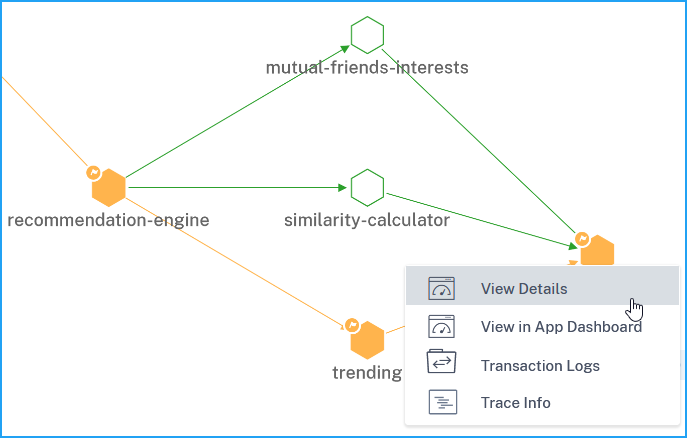
Click a service and select View Details.

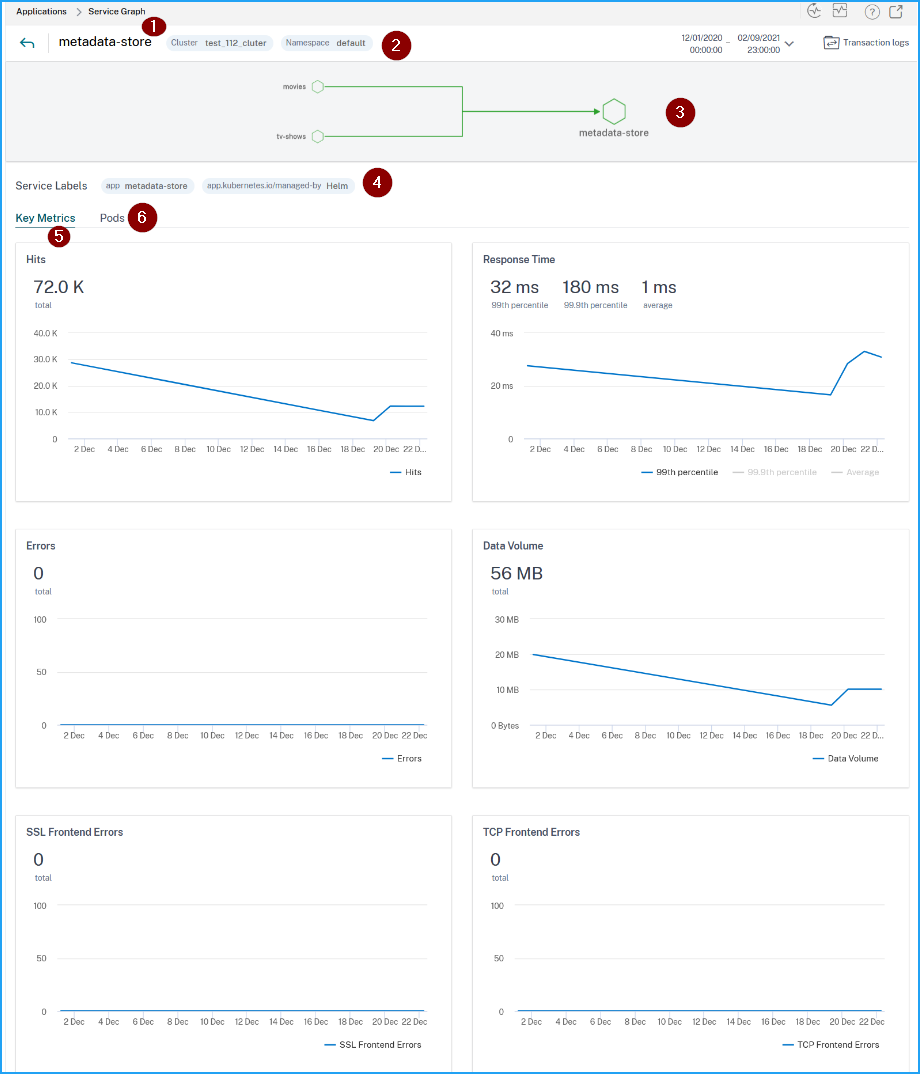
The service details page enables you to view:
-
The cluster name where the service is hosted (1)
-
The namespace and service labels of the service (2) (4)
-
All associated incoming and outgoing services connected with the selected service (3)
-
Service key metrics in a graph format such as Hits, Response time, Errors, Data volume, SSL frontend errors, and TCP frontend errors (5).
-
The backend pods associated with the service (6).

Using these key metrics trends, you can analyze how the service is performing for a specific time duration.
The Response Time metric enables you to view:
-
99th percentile – Indicates that the 99% of the requests for the selected duration is less than 32 ms (according to the example image).
-
Average – Indicates the average response time from the service
-
99.9th percentile – Indicates the highest response time from the service
Metrics details
| Metrics | Description |
|---|---|
| Hits | The total number of requests received by the service |
| Errors | The total HTTP errors from the service |
| Service Response Time | The average response time taken from the service to respond for Time To First Byte (TTFB). |
| Data Volume | The total data volume processed by the service |
| SSL front-end errors | The total SSL front-end errors from the service. For example: SSL CLIENTAUTH FAILURE |
| SSL back-end errors | The total SSL back-end errors from the service. For example: SSL Client Errors |
| TCP back-end errors | The total TCP back-end errors from the service. For example: TCP Server Reset |
| TCP front-end errors | The total TCP front-end errors from the service. For example: TCP Client Reset |
View backend pod details
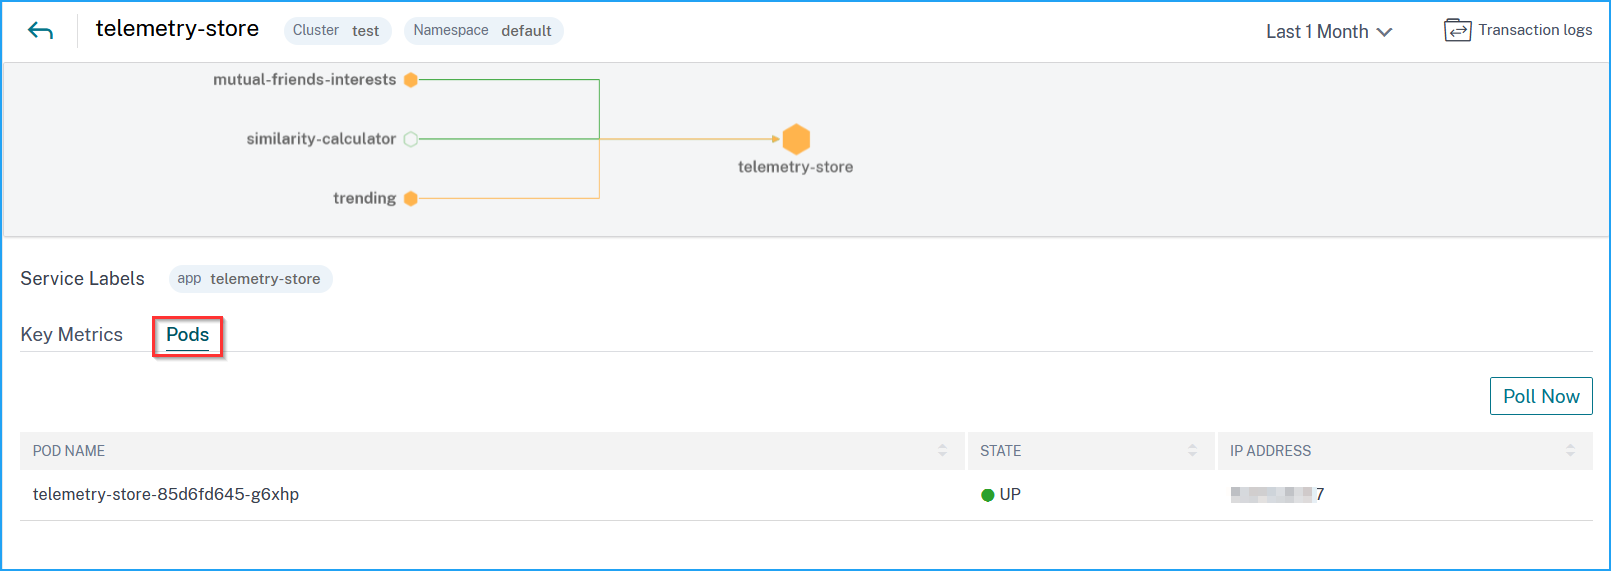
Click the Pods tab to view the backend pods associated with the service.

-
Pod name – Denotes the pod name
-
Status – Denotes if the pod is running (UP) or not (DOWN).
-
IP address – Denotes the pod IP address
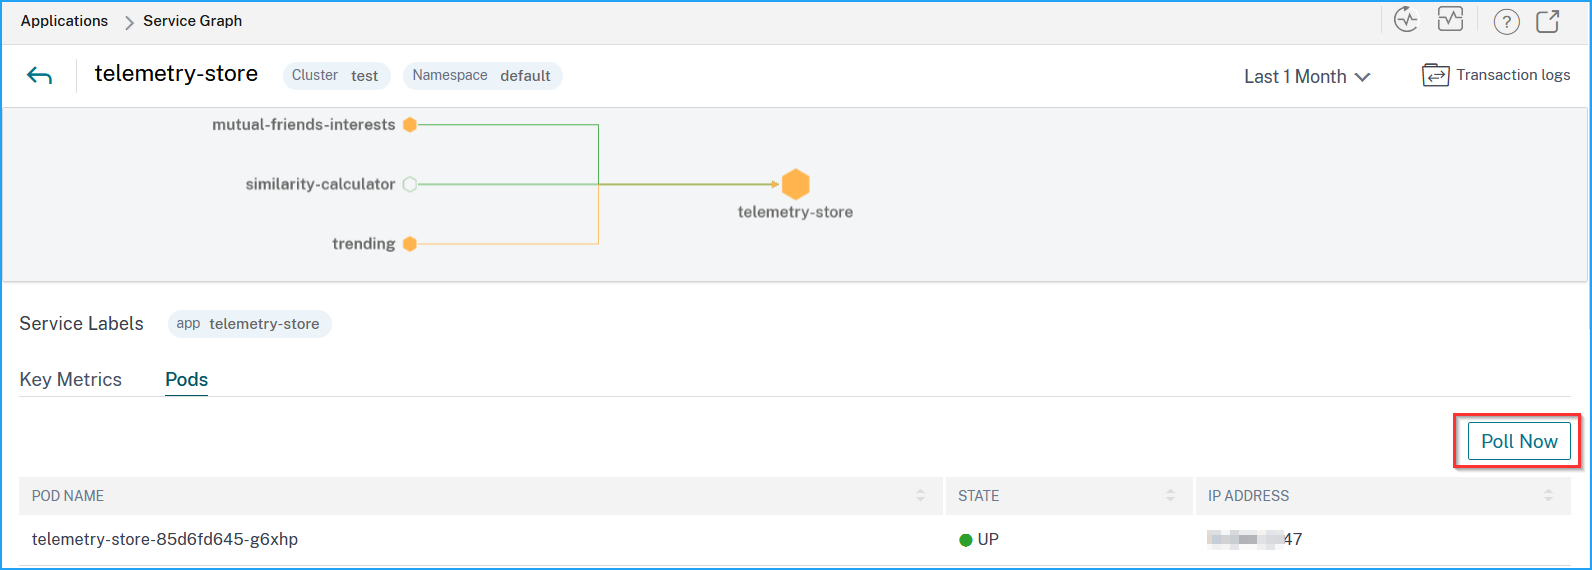
Use the Poll Now option to get the pod status
The Poll Now option fetches the latest pod status from the cluster.
