Distributed tracing
In service graph, you can use the distributed tracing view to:
-
Analyze the overall service performance.
-
Visualize the communication flow between the selected service and its inter-dependent services.
-
Identify which service indicates errors and troubleshoot the erroneous service
-
View transaction details between the selected service and its each inter-dependent service.
Prerequisites
To view the trace information for the service, you must:
-
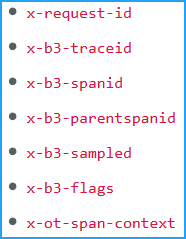
Ensure that an application maintains the following trace headers, while sending any east-west traffic:
-
For CIC builds earlier than 1.7.23, update the CPX YAML file with
NS_DISTRIBUTED_TRACINGand value asyes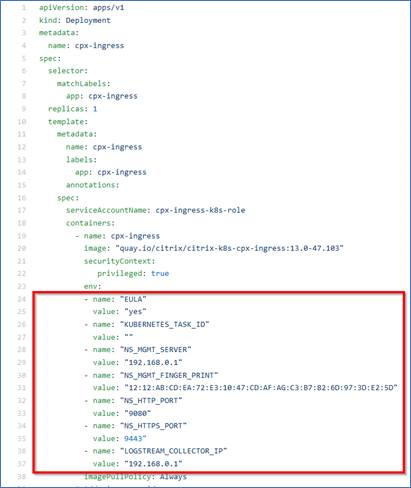
-
For CIC builds later than 1.7.23, you must use a ConfigMap.
ConfigMaps allow you to separate your configurations from your pods and make your workloads portable. Using ConfigMaps, you can easily change and manage your workload configurations and reduce the need to hardcode configuration data to pod specifications.
With ConfigMap support, you can update the configuration automatically while keeping the NetScaler Ingress Controller pod running. You do not need to restart the pod after the update. For more information, see ConfigMap support for the ingress controller.
Using the ConfigMap, you can enable or disable distributed tracing, events, audit logs, and so on. To use the ConfigMap:
-
Create a YAML file using the required parameters.
The following example YAML file has the distributed tracing enabled and other variables such as audit logs, events, and transactions disabled:
apiVersion: v1
kind: ConfigMap
metadata:
  name: cic-configmap
  namespace: default
data:
  LOGLEVEL: 'debug'
  NS_PROTOCOL: 'http'
  NS_PORT: '80'
  NS_HTTP2_SERVER_SIDE: 'ON'
  NS_ANALYTICS_CONFIG:
    distributed_tracing:
      enable: 'true'
      samplingrate: 100
    endpoint:
      server: <ADM-AgentIP> / <ADM-AppserverIP>
    timeseries:
      port: 5563
      metrics:
        enable: 'true'
        mode: 'avro'
      auditlogs:
        enable: 'false'
      events:
        enable: 'false'
    transactions:
      enable: 'false'
      port: 5557
<!--NeedCopy-->
Note
You can provide the values for
Samplingratebetween 0 and 100. NetScaler ADM displays the mentioned number of trace transactions. -
Deploy the ConfigMap by using:
kubectl create -f <configmap-yaml>.yaml -
Edit the CPX YAML file and use either
envFromorargsto specify the following arguments:envFrom: - configMapRef: name: cic-configmap <!--NeedCopy-->OR

-
If you want to change the value for any variable, edit the values in the ConfigMap. In this example, all other variables are changed from
falsetotrue.apiVersion: v1 kind: ConfigMap metadata: name: cic-configmap namespace: default data: LOGLEVEL: 'debug' NS_PROTOCOL: 'http' NS_PORT: '80' NS_HTTP2_SERVER_SIDE: 'ON' NS_ANALYTICS_CONFIG: distributed_tracing: enable: 'true' samplingrate: 100 endpoint: server: <ADM-AgentIP> / <ADM-AppserverIP> timeseries: port: 5563 metrics: enable: 'true' mode: 'avro' auditlogs: enable: 'true' events: enable: 'true' transactions: enable: 'true' port: 5557 <!--NeedCopy--> -
Reapply the ConfigMap using the following command:
kubectl apply -f <yaml-file>.yaml
-
View service trace details
In service graph, click a service, and select Trace Info.
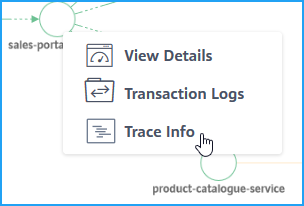
The Trace Summary page is displayed for the selected service.
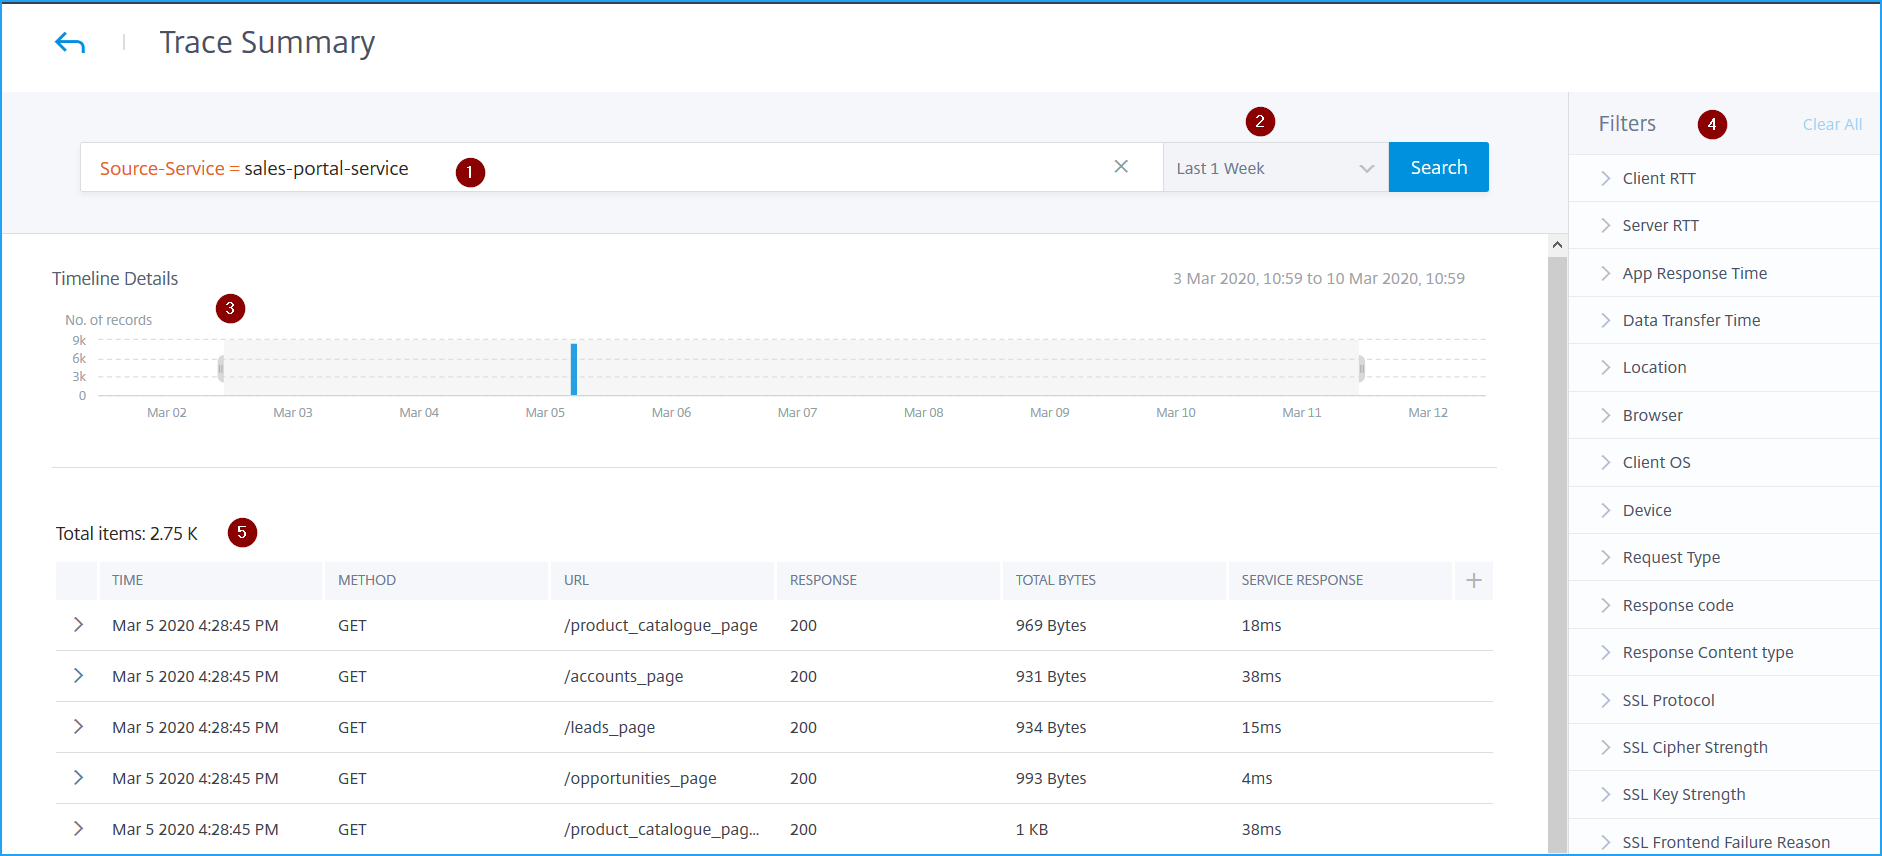
The Trace Summary displays:
-
An advanced search that enables you to search through for transactions with suggestions and operators (1). For more information, see Advanced Search.
-
The time duration list that enables you to select the time duration such as 1-hour, 12-hour, 1-day, 1-week, 1-month, and custom time (2).
-
The Timeline Details graph that enables you to drag and select to display results for a specific time duration (3).
-
The Filters panel that enables you to select options from each metric (4).
-
The transaction details for the selected service (5).
View the transaction details
Click a transaction to drill down for detailed information. You can view transaction details for the selected service such as:
-
Start time
-
End time
-
SSL metrics
-
Communication with inter-dependent services (along with errors and response time with each service).
The following example indicates an error from catalogue-store-service. Click See Trace Details for further details.

The Trace Details page is displayed.
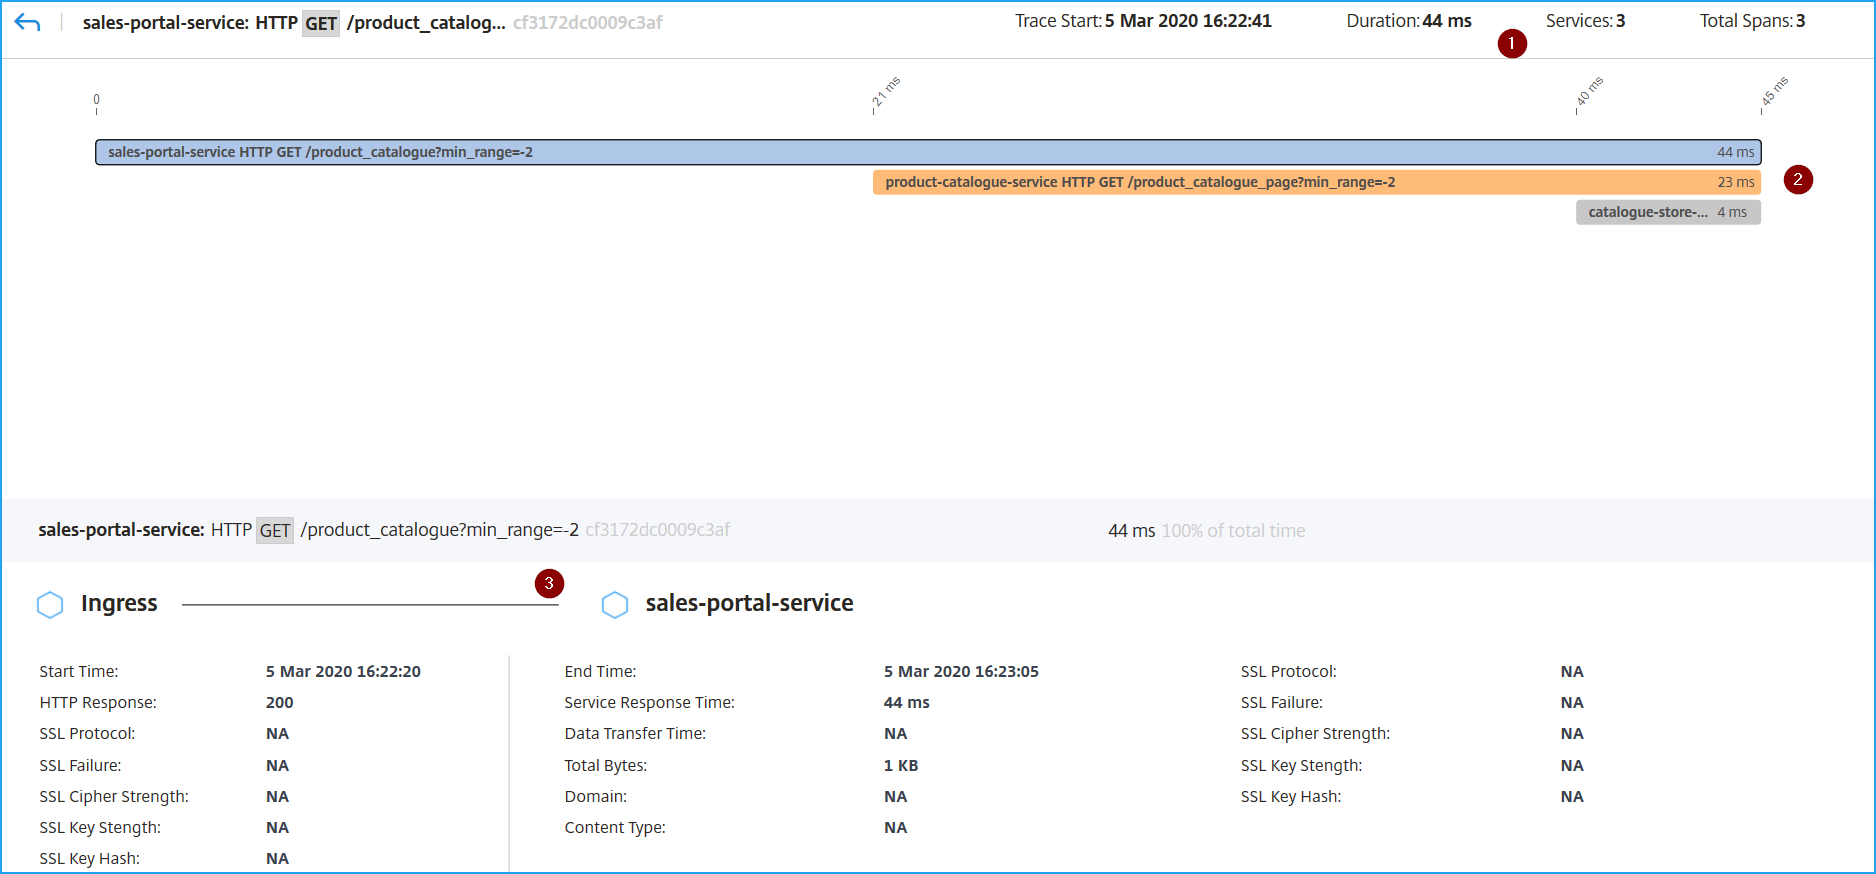
1 – Displays the start time, response time, total services, and total spans for the transaction.
2 – Displays the details for the selected service that has communicated with its inter-dependency services. You can click each transaction to view details.
3 – Displays the transaction details for each service.
According to the example image, catalogue-store-service indicated an error. Click the transaction available for catalogue-store-service.
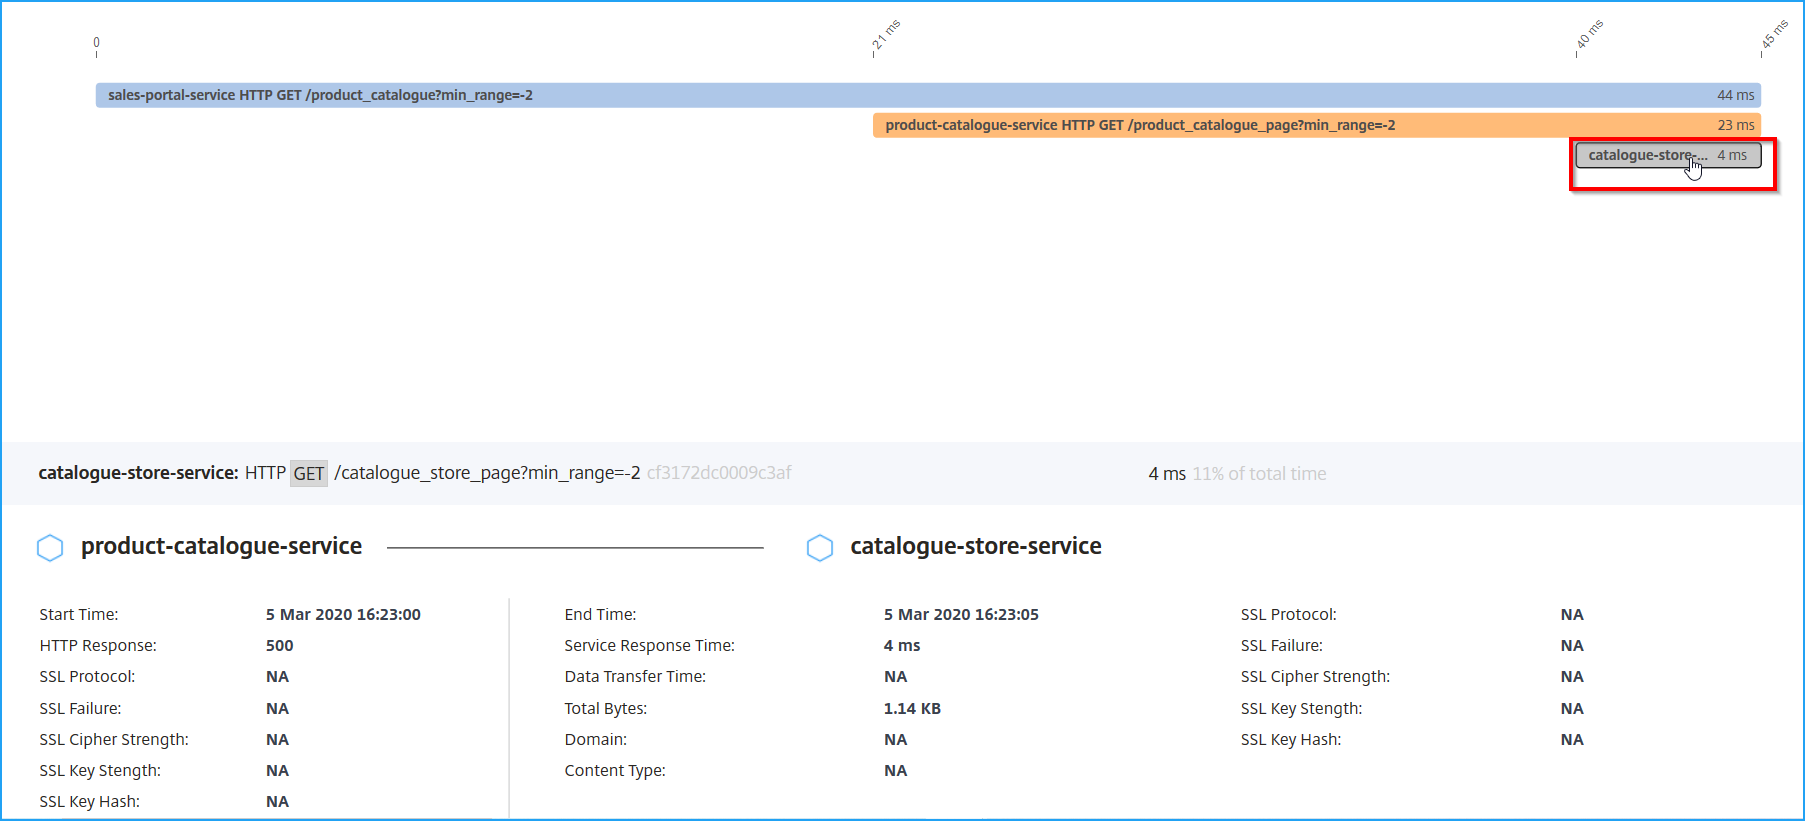
The transaction details between product-catalogue-service and catalogue-store-service indicate HTTP response as 500. With these details, as an administrator, you can analyze the erroneous service and troubleshoot product-catalogue-service as a resolution.
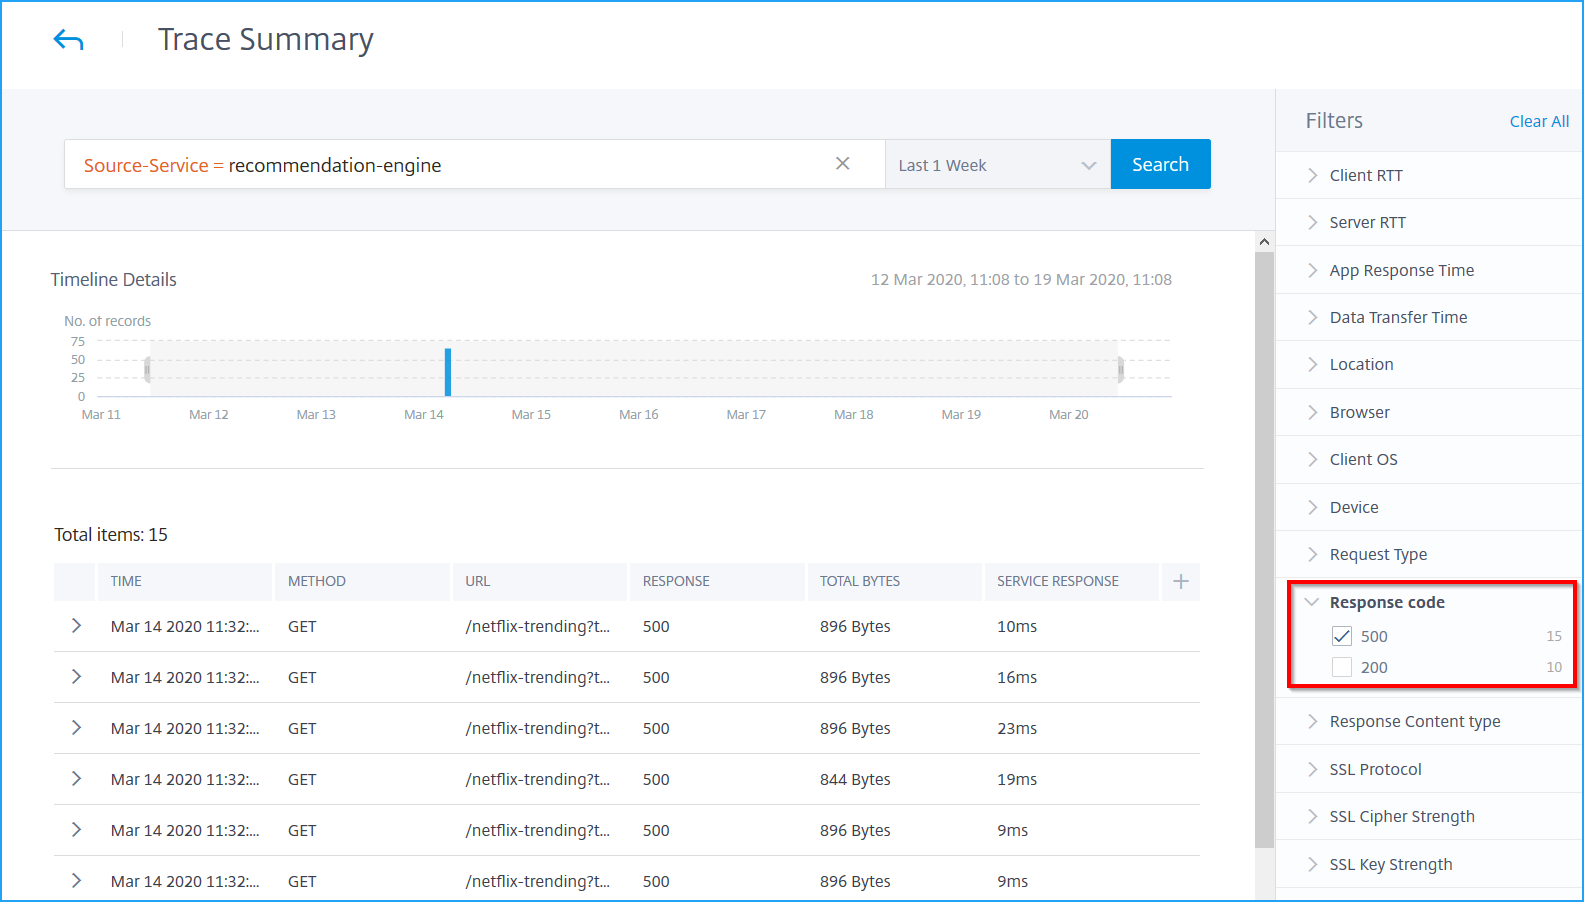
You can also filter results by selecting options from each metric under the Filters panel. For example, if you want to view all 5xx transactions, click Response code and select 500.
-
Client RTT: The time duration for a packet to travel from the client.
-
Server RTT: The time duration for a packet to travel from the server.
-
App Response Time: The application average response time
-
Data Transfer Time: The data transfer size and the rate at which the transmit can happen from/to a service.
-
Location: The client location
-
Browser: The browser types used by the clients. For example: Chrome, Firefox.
-
Client OS: The client OS based on the User Agent details from the browser.
-
Device: The devices based on the User Agent details from the browser. For example: Tablet, Mobile.
-
Request Type: The transaction request type. For example: GET.
-
Response code: The response code received from the server. For example: 501, 404, 200.
-
Response content type: The transaction content type. If the client request is for text/html, then the response from the server must be text/html.
-
SSL Protocol: The SSL protocol version used by the clients. For example: SSLv3.
-
SSL Cipher Strength: The cipher strength based on the SSL certificate key size such as high, medium, and low.
-
SSL Key Strength: The SSL cipher strength is calculated from the SSL certificate key size. The key length defines the SSL algorithm security. For example: 2048
-
SSL Front end Failure reason: The front-end SSL handshake error message. For example: SSL CLIENTAUTH FAILURE