FAQs
The diagnostics details in service graph suggest you the possible troubleshooting actions to resolve the partial or no data in service graph. The following FAQs might help you to analyze additional information to troubleshoot the partial or no data issue in service graph:
Why service graph is displaying partial data or no data?
The possible reasons might be:
-
Static route is not configured
-
Kubernetes cluster status is down
-
CPX registration is failed
-
CPX virtual servers are not licensed
-
The required analytics configuration is not set that prevents the service graph to load all data.
Service Graph displays only nodes and no edges
In service graph, the nodes refer to the services in the Kubernetes cluster and the edges refer to the traffic flow. If you do not see the edges, it means there is no traffic between the services.
After you add a Kubernetes cluster to NetScaler Console (Infrastructure > Orchestration > Kubernetes), the Kubernetes service node configuration is sent to the database every 1 hour. If no traffic is sent during this mentioned time, the edges are not visible.
If you are not able to see the edges, even after you have sent traffic, refer to the next question.
I’m sending traffic & have resolved all issues as part of Diagnostics for No/Partial Data. But I’m still not seeing any graph edges
-
Ensure that your application sends traffic through NetScaler by configuring a proper ingress. You can verify this by ensuring that the AppFlow policy hits count increments on sending traffic.

-
If your application has TCP Persistent Connections, that particular edge is not shown until the connection is terminated.
-
If you are using any other NetScaler form factor apart from CPX, ensure that the virtual servers of the NetScaler are licensed. NetScaler Console Graph Diagnostics considers only CPX by default.
How frequent does the service graph displays Kubernetes data?
You can view service details in service graph at a time interval of approximately 5-minute duration.
I have added static routes in Agent but still CPX Registration is failing
To debug this issue further:
Step 1: Ensure CPX to Agent Communication is fine:
-
Log on to the Kubernetes master node.
-
Run
kubectl get pods. -
Run
kubectl exec -it <cpx_pod> bashto get the CPX log. -
Run
/var/log/boot.logto ensure that the request sent to the agent has 200 response.
If there is any issue with this request (response code apart from 200):
-
If it is a connectivity-related issue, ensure that the CPX-Agent connectivity issue is resolved.
-
If it is an authentication issue, CPX registration fails when the agent password is changed.
-
Step 2: If step 1 worked fine, check the logs from the agent:
-
Log on to the agent
-
Run
grep <CPX IP> /var/mps/log/mps_service.log
If step 1 succeeded, the routes must be present in mps_service.log.
If routes are not present, a device not reachable error is displayed in mps_service.log.
-
If no error, run
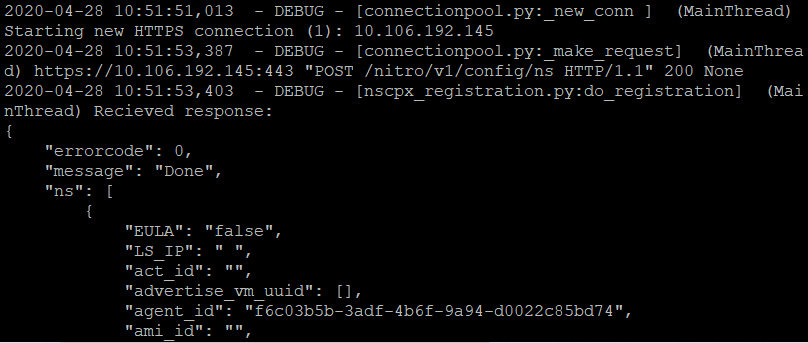
grep <CPX IP> /var/mps/log/mps_cloudagent.logto see the details on what happened during registration.Alternatively, although not recommended – You can also register CPX from the GUI by supplying user name and password, HTTP/HTTPS port (specified in CPX.yaml), and the agent which has the static routes configured.
TCP transactions are not visible in service graph
-
Ensure that the CPX version is 50.x or later.
-
Enable the TCP transaction setting to All. For more information, see Setting up service graph.
Service Graph is visible, but there is no client > Ingress > service edges
The Client IP address is used to infer the traffic that is coming from the client. Ensure that the data received from CPX has an IP which does not match any Kubernetes pod IP. This issue may not hold good in all deployments. For example: recent heartbeat issue.
What are the supported CNIs?
Flannel, Calico, and Canal
I am unable to add a Kubernetes cluster from NetScaler Console GUI
Ensure that your token has Kubernetes cluster wide access. For more information, see Add Kubernetes cluster in NetScaler Console.
I am unable to see any transactions under Trace Info
To get Distributed Tracing analytics, ensure that:
-
Your NetScaler has distributed tracing enabled in the CPX YAML.
-
your application persists trace headers.
To validate these settings, see Distributed Tracing.
I am unable to see my virtual server configured on the NetScaler in the NetScaler Console
NetScaler Console polls for NetScaler data for every 1 hour. You can manually poll for NetScaler config by navigating to Network > Network Functions, and clicking Poll Now.
In this article
- Why service graph is displaying partial data or no data?
- Service Graph displays only nodes and no edges
- I’m sending traffic & have resolved all issues as part of Diagnostics for No/Partial Data. But I’m still not seeing any graph edges
- How frequent does the service graph displays Kubernetes data?
- I have added static routes in Agent but still CPX Registration is failing
- TCP transactions are not visible in service graph
- Service Graph is visible, but there is no client > Ingress > service edges
- What are the supported CNIs?
- I am unable to add a Kubernetes cluster from NetScaler Console GUI
- I am unable to see any transactions under Trace Info
- I am unable to see my virtual server configured on the NetScaler in the NetScaler Console