NetScaler Observability Exporter with Splunk Enterprise as endpoint
NetScaler Observability Exporter is a container that collects metrics and transactions from NetScaler and sends the data to various endpoints. NetScaler Observability Exporter supports Splunk Enterprise as an endpoint.
Splunk Enterprise is a data platform for searching, monitoring, and analyzing machine-generated big data. Splunk Enterprise captures indexes and correlates real-time data in a repository from which it can generate reports, graphs, dashboards, and visualizations.
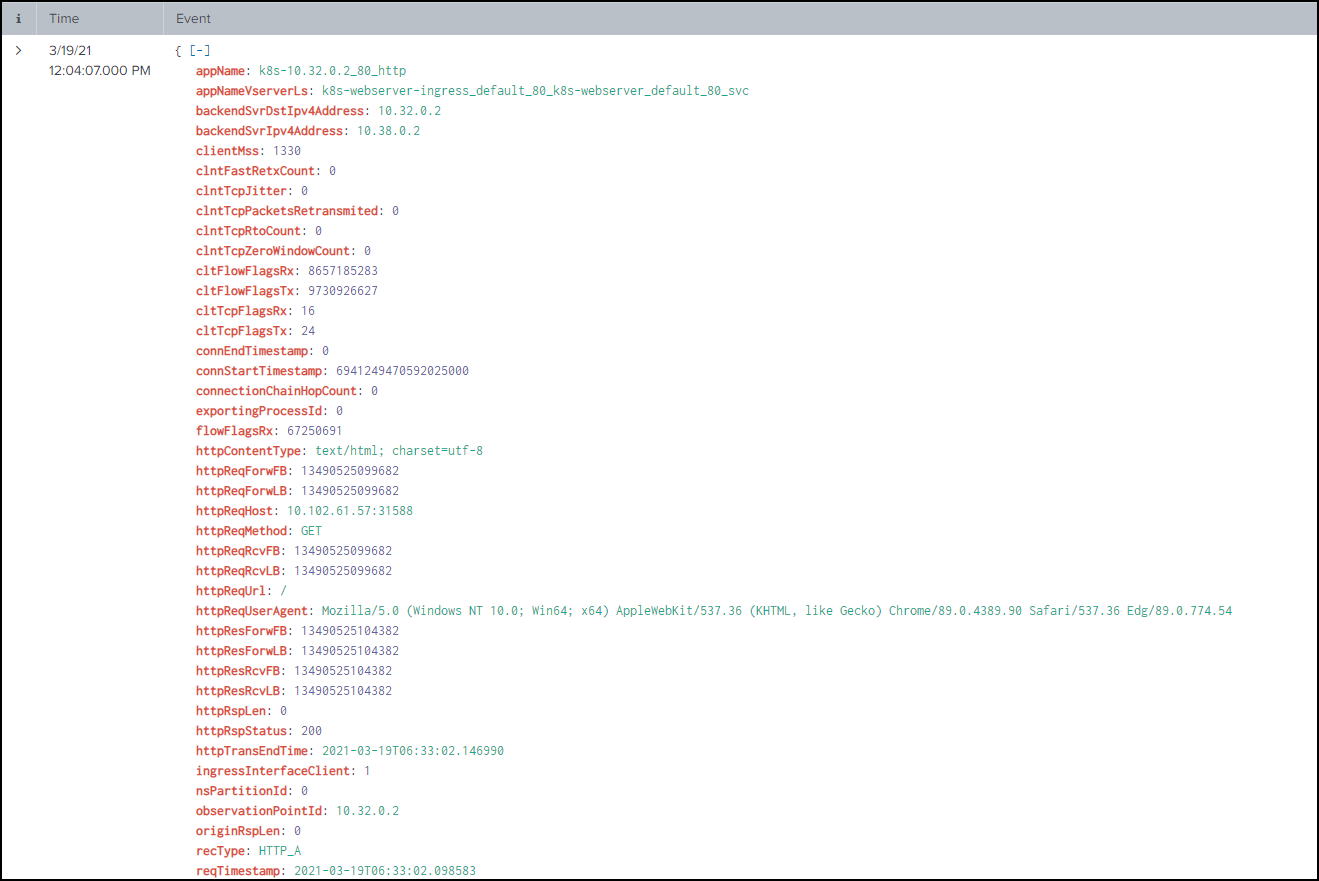
You can add Splunk Enterprise as an endpoint to receive audit logs, events, and transactions from NetScaler for analysis. Splunk Enterprise provides a graphical representation of these data. You can enable or disable the type of transactions, events, and audit logs which are to be sent to Splunk Enterprise.
Deploy NetScaler Observability Exporter
You can deploy NetScaler Observability Exporter using the YAML file. Based on your NetScaler deployment, you can deploy NetScaler Observability Exporter either outside or inside Kubernetes clusters. You can deploy NetScaler Observability Exporter as a pod inside the Kubernetes cluster or on the NetScaler MPX or VPX appliance outside the cluster.
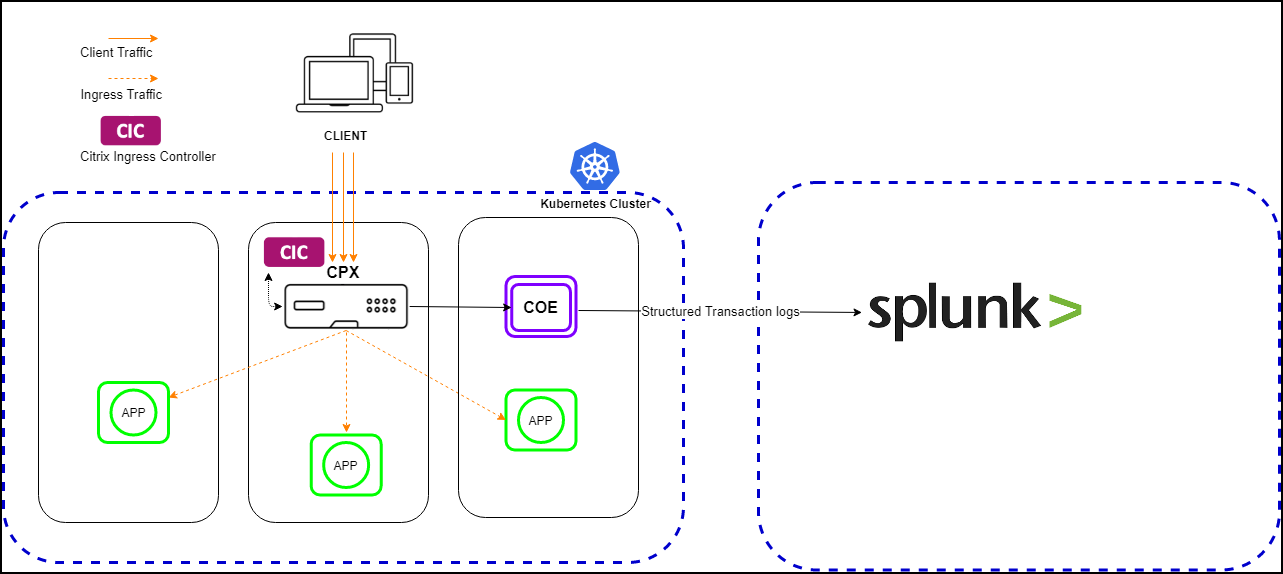
The following diagram illustrates a NetScaler as an Ingress Gateway with the NetScaler Ingress Controller and NetScaler Observability Exporter as sidecars. NetScaler Observability Exporter sends NetScaler application metrics and transaction data to Splunk Enterprise. Splunk Enterprise provides a graphical representation of the data.

Prerequisites
- Ensure that you have a Kubernetes cluster with
kube-dnsorCoreDNSaddon enabled.
Note:
In the following procedure, the YAML file is used to deploy NetScaler Observability Exporter in the Kubernetes defauIt namespace. If you want to deploy in a private namespace other than the default, edit the YAML file to specify the namespace.
Perform the following steps to deploy NetScaler Observability Exporter:
Note:
If you have a pre-deployed web application, skip the steps 1 and 2.
-
Create a secret ingress.crt and key ingress.key using your own certificate and key.
In this example, a secret, called ing in the default namespace, is created.
kubectl create secret tls ing --cert=ingress.crt --key=ingress.key -
Access the YAML file from webserver-splunk.yaml to deploy the application.
kubectl create -f webserver-splunk.yaml -
Define the specific parameters that you must import by specifying it in the ingress annotations of the application’s YAML file, using the smart annotations in the ingress.
ingress.citrix.com/analyticsprofile: '{"webinsight": {"httpurl":"ENABLED", "httpuseragent":"ENABLED", "httpHost":"ENABLED","httpMethod":"ENABLED","httpContentType":"ENABLED"}}'Note:
The parameters are predefined in the
webserver-splunk.yamlfile.For more information about Annotations, see Ingress annotations documentation.
Deploy NetScaler CPX with the NetScaler Observability Exporter support
You can deploy NetScaler CPX as a side car with the NetScaler Observability Exporter support enabled along with NetScaler Ingress Controller. You can modify the NetScaler CPX YAML file cpx-ingress-splunk.yaml to include the configuration information that is required for the NetScaler Observability Exporter support.
The following is a sample application deployment procedure.
-
Download the cpx-ingress-splunk.yaml and cic-configmap.yaml file.
-
Create a ConfigMap with the required key-value pairs and deploy the ConfigMap. You can use the
cic-configmap.yamlfile that is available, for the specific endpoint, in the directory. -
Modify NetScaler CPX related parameters, as required.
-
Edit the
cic-configmap.yamlfile and specify the following variables for NetScaler Observability Exporter in theNS_ANALYTICS_CONFIGendpoint configuration.server: 'coe-splunk.default.svc.cluster.local' # COE service FQDNNote:
If you have used a namespace other than default, change
coe-splunk.default.svc.cluster.local totocoe-splunk.<desired-namespace>.svc.cluster.local. If NetScaler is outside the Kubernetes cluster, then you must specify IP address and nodport address of NetScaler Observability Exporter. -
Deploy NetScaler CPX with the NetScaler Observability Exporter support using the following commands:
  kubectl create -f cpx-ingress-splunk.yaml
  kubectl create -f cic-configmap.yaml
Deploy NetScaler Observability Exporter using the YAML file
You can deploy NetScaler Observability Exporter using the YAML file. Download the YAML file from coe-splunk.yaml. Ensure to specify the Splunk server address for the right namespace by editing the coe-splunk.yaml file.
Following is an example of how to specify the ServerUrl in the lstreamd_default.conf section in the coe-splunk.yaml file . Here, ServerUrl means the address of the Splunk server.
          lstreamd\_default.conf: |
          {
            "Endpoints": {
              "SPLUNK": {
                "ServerUrl": "http://10.102.34.155:8088",
                "AuthToken": "",
                "Index": "",
                "RecordType": {
                  "HTTP": "all",
                  "TCP": "all",
                  "SWG": "all",
                  "VPN": "all",
                  "NGS": "all",
                  "ICA®": "all",
                  "APPFW": "none",
                  "BOT": "all",
                  "VIDEOOPT": "none",
                  "BURST_CQA": "none",
                  "SLA": "none",
                  "MONGO": "none"
                },
                "TimeSeries": {
                  "EVENTS": "yes",
                  "AUDITLOGS": "yes"
                },
                "ProcessAlways": "no",
                "ProcessYieldTimeOut": "500",
                "MaxConnections": "512",
                "JsonFileDump": "no"
              }
            }
          }
Note:
While deploying NetScaler Observability Exporter using the YAML file, along with the Splunk server address, you can provide the
Indexname to which the data to be sent in Splunk Enterprise. By default, thisIndexPrefixoption is empty and the data is uploaded to the default index, that ismain, in Splunk Enterprise.
To deploy NetScaler Observability Exporter using the Kubernetes YAML, run the following command in the Splunk Enterprise endpoint:
kubectl create -f coe-splunk.yaml
Note:
Modify the YAML file for NetScaler Observability Exporter if you have a custom namespace.
Verify the NetScaler Observability Exporter deployment
You can verify the deployment after deploying NetScaler Observability Exporter, web application, NetScaler CPX, and NetScaler Ingress Controller.
To verify the deployment, perform the following steps:
-
Verify the deployment using the following command:
kubectl get deployment,pods,svc -o wide -
Access the application using a browser with the URL. For example:
https://kubernetes-node-IP:cpx-ingress-splunk nodeport/ -
Access the Splunk server using a browser with the URL. For example:
https://splunk-node-IP:splunk nodeport/
Import pre-built dashboards for Splunk
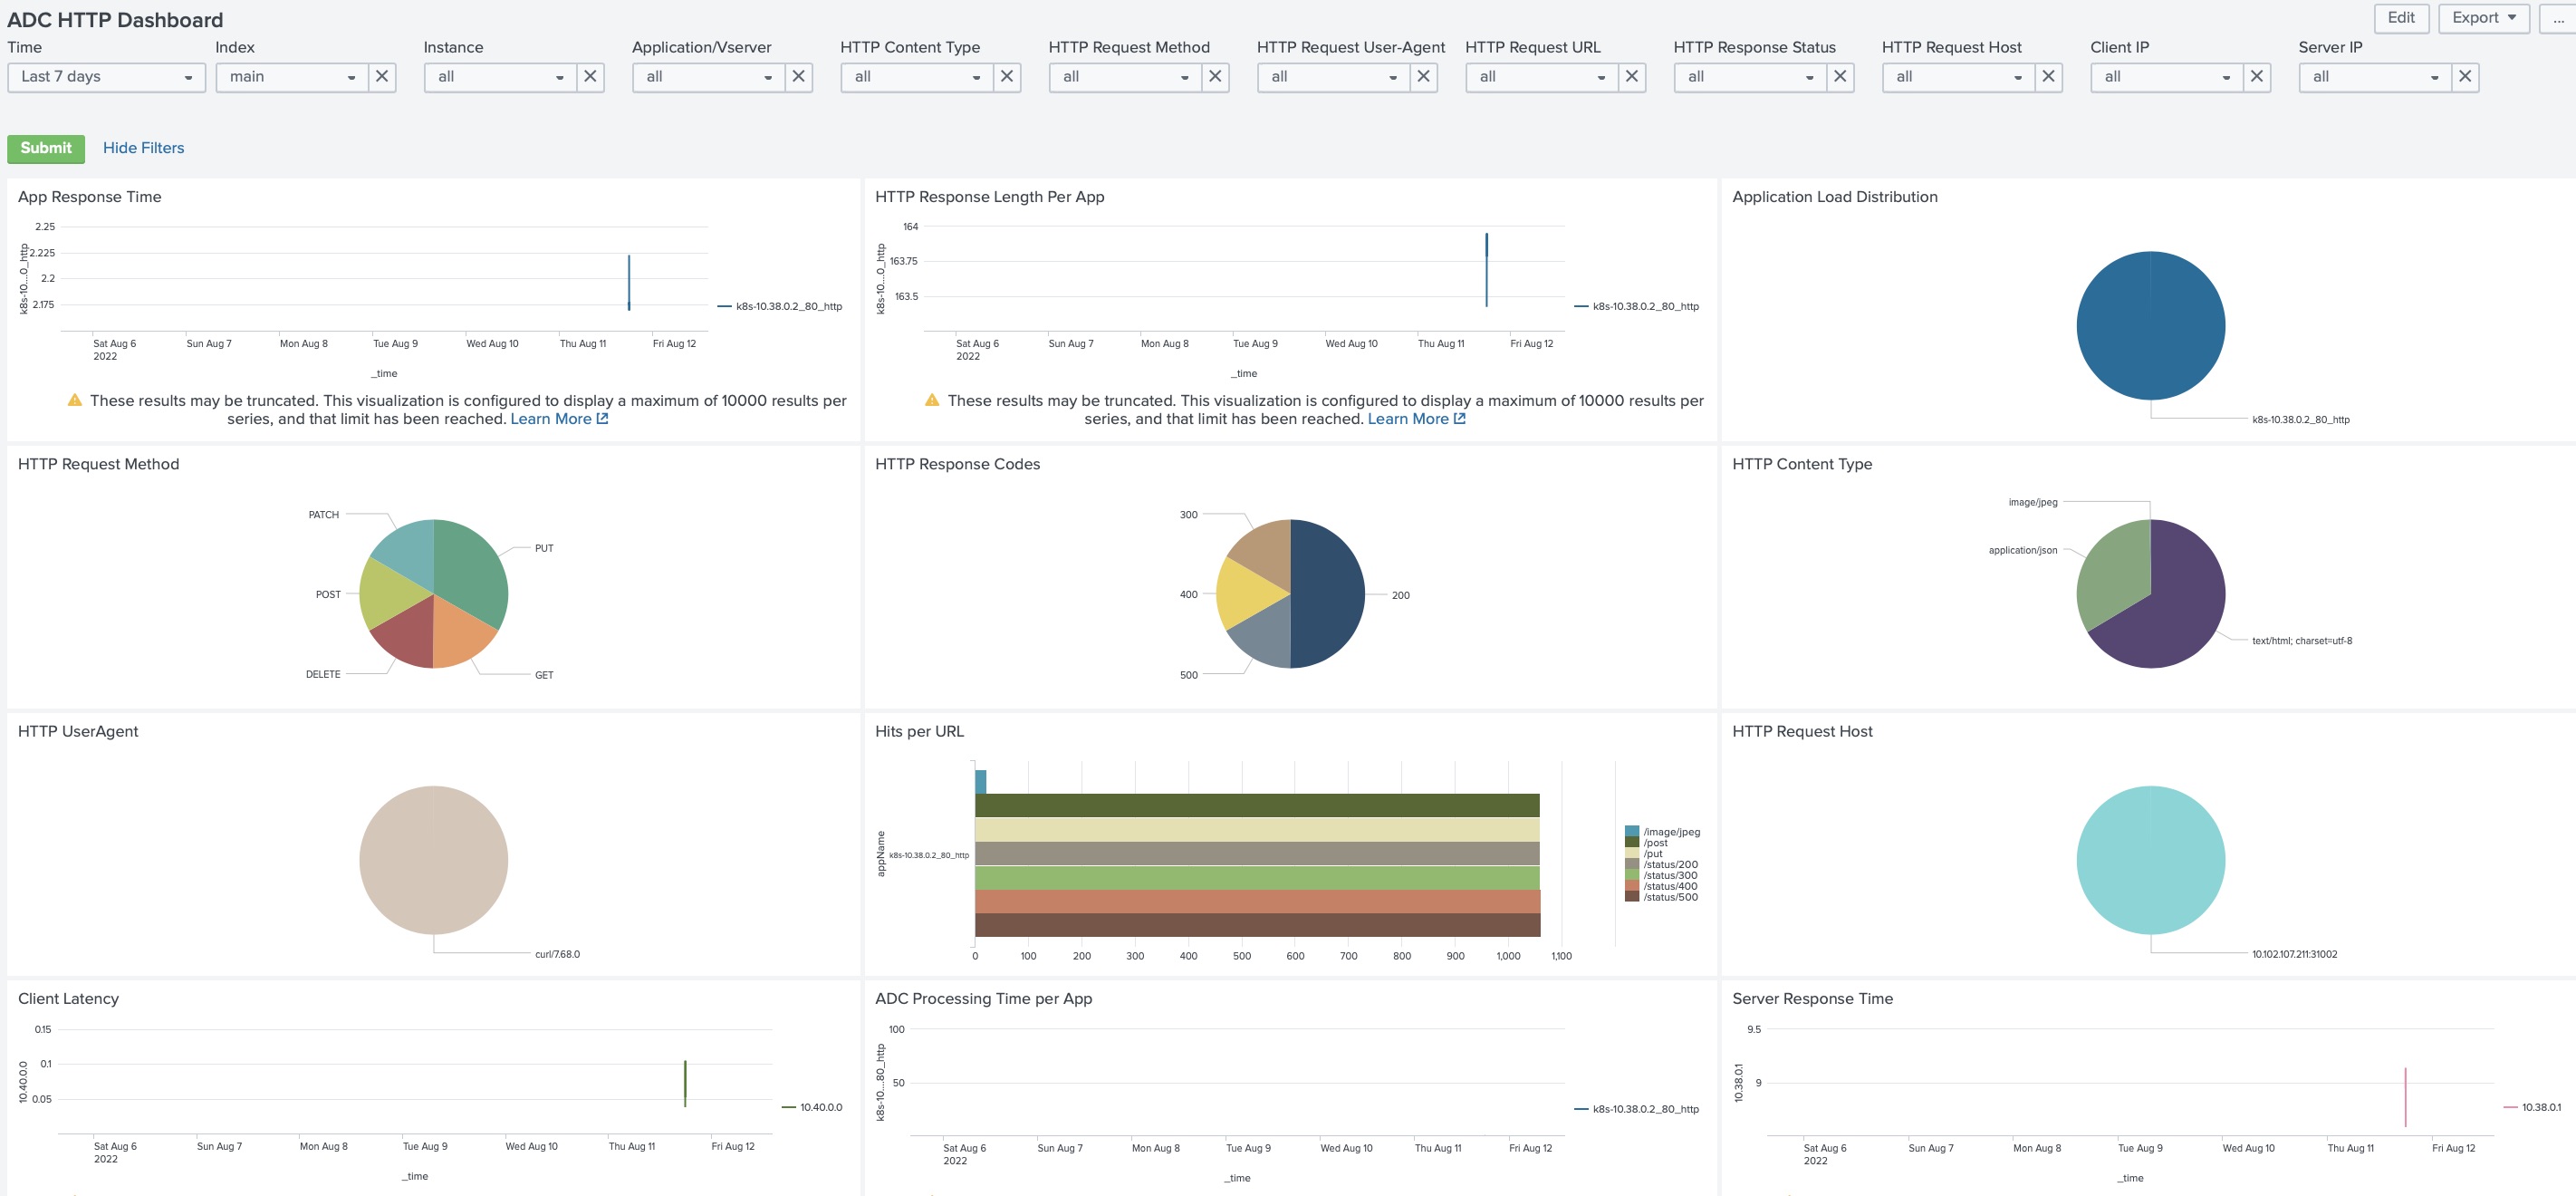
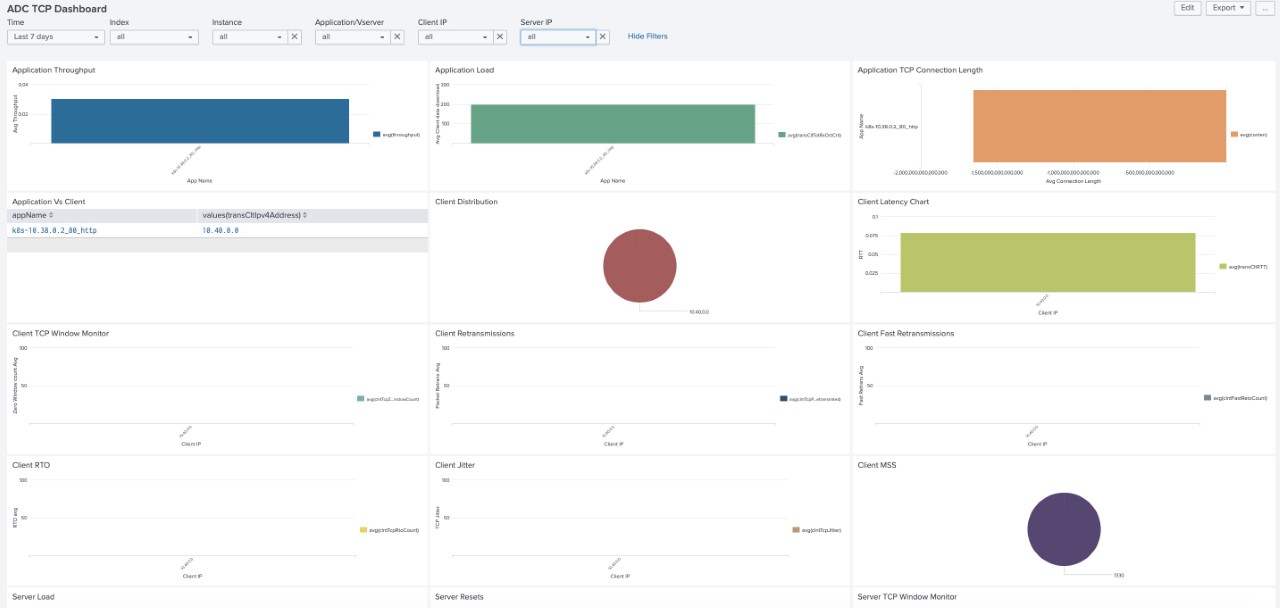
You can import pre-built Splunk dashboards provided by NetScaler. The JSON files for importing the dashboards are available at the GitHub repository. These dashboards provide you the option to filter the transactions based on parameters such as an instance IP address, application name, or client and server IP address and so on.
Following is a sample HTTP dashboard. This dashboard shows data such as HTTP header-based charts, transactional latency, response type distribution, and so on.

Following is a sample TCP dashboard for Splunk. This dashboard shows data such as bandwidth distribution for each application, TCP Jitter, client and server RTT, and so on.
