NetScaler Observability Exporter with Zipkin as endpoint
NetScaler Observability Exporter supports OpenTracing (OpenTracing is a part of OpenTelemetry now) using Zipkin as the endpoint. NetScaler Observability Exporter transforms the tracing data collected from NetScalers into supported formats suitable for OpenTracing and exports them to Zipkin. Zipkin is a distributed tracing system that helps to gather the timing data required to troubleshoot latency problems in microservice architectures. Elasticsearch is used for long-term retention of trace data and the traces can be visualized using the Zipkin UI or Kibana.
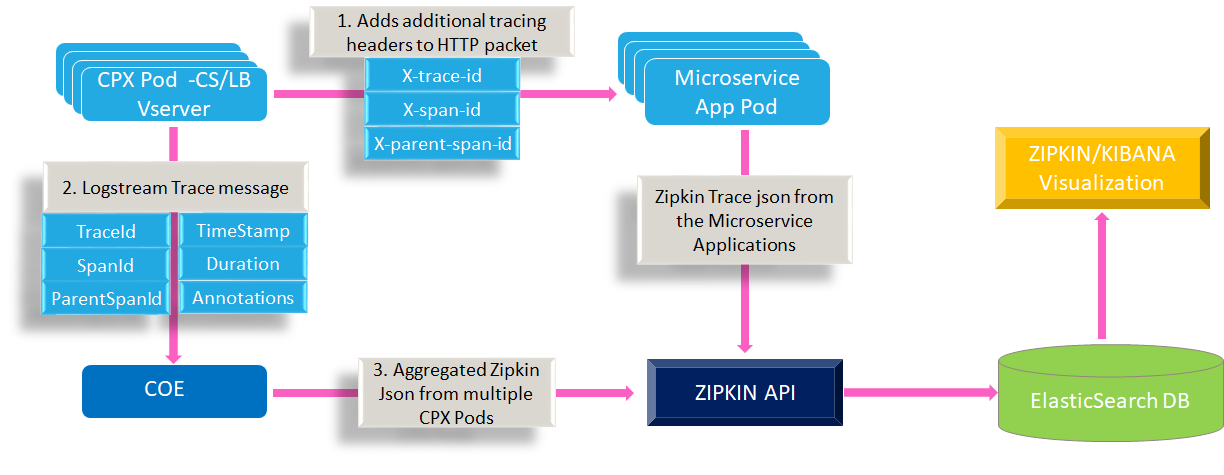
The following diagram illustrates how the Zipkin architecture works:
-
When the tracing is enabled, initially, it adds additional open-tracing headers:
x-trace-id,x-span-id, andx-parent-span-idto HTTP packet, before it forwards the packet to the next microservice pod. -
The information about this communication or transaction is pushed to NetScaler Observability Exporter. The information includes the details about the headers, the timestamp (time when this request is initiated and the entire duration of the process), and annotations (annotations include HTTP, SSL, and TCP associated with that request).
-
Then, NetScaler Observability Exporter receives multiple trace messages from all the NetScalers and aggregates them into Zipkin understandable JSON format, and push that to Zipkin through the API.
-
Similarly, if microservices are enabled with tracing, then that trace is sent to Zipkin through the API.
-
Zipkin API stores the trace data in the Elasticsearch database, and finally stitch the complete trace to the given HTTP request and visualize it in the visualization tool such as Kibana. You can view the time that the request spent on each microservices.

Deploy NetScaler Observability Exporter
Based on your NetScaler deployment, you can deploy NetScaler Observability Exporter either outside or inside Kubernetes clusters. You can deploy NetScaler Observability Exporter as a pod inside the Kubernetes cluster or enable the configuration on NetScaler MPX or VPX form factor outside the cluster. You can deploy NetScaler Observability Exporter using the Kubernetes YAML file provided by NetScaler.
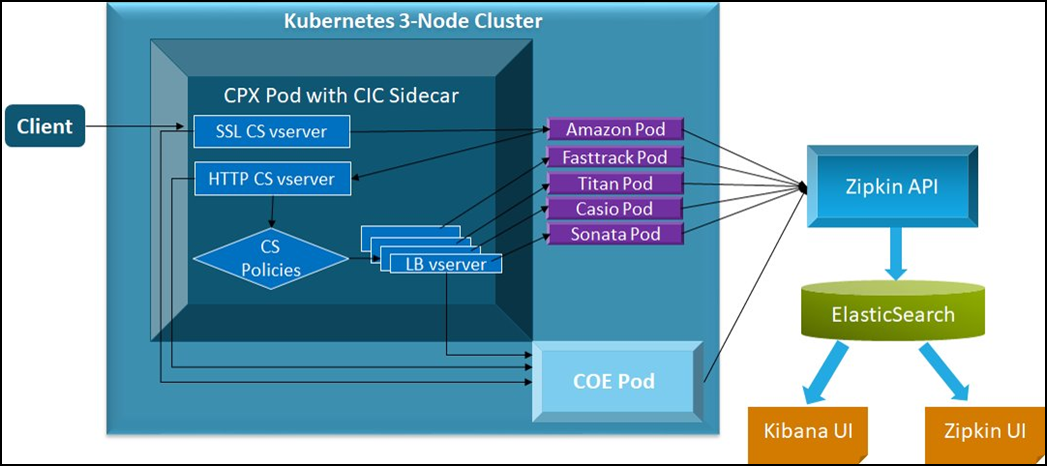
The following diagram illustrates NetScaler as an ingress gateway with the NetScaler Ingress Controller as a sidecar. NetScaler Observability Exporter sends the tracing data collected from NetScalers to Zipkin API. The tracing data is, then, uploaded to the Elasticsearch server. From Elasticsearch, the data is sent to Zipkin UI or Kibana UI for visualization.

Prerequisites
- Ensure that you have a Kubernetes cluster with
kube-dnsorCoreDNSaddon enabled.
To deploy NetScaler Observability Exporter with Zipkin, you must perform the following tasks:
-
Deploy the required application with the tracing support enabled.
-
Deploy NetScaler CPX enabled with the NetScaler Observability Exporter support.
-
Deploy Zipkin, Elasticsearch, and Kibana using the YAML files.
-
Deploy NetScaler Observability Exporter using the YAML file.
Deploy application with tracing enabled
The following is a sample application deployment with tracing enabled.
Note:
If you have a pre-deployed web application, skip the steps 1 and 2.
-
Create a secret ingress.crt and key ingress.key using your own certificate and key.
In this example, a secret, called ing in the default namespace, is created.
kubectl create secret tls ing --cert=ingress.crt --key=ingress.key -
Access the YAML file from watches-app-tracing.yaml to deploy the application.
kubectl create -f watches-app-tracing.yaml -
Define the specific parameters that you must import by specifying it in the ingress annotations of the application’s YAML file, using the smart annotations in the ingress.
ingress.citrix.com/analyticsprofile: '{"webinsight": {"httpurl":"ENABLED", "httpuseragent":"ENABLED", "httpHost":"ENABLED","httpMethod":"ENABLED","httpContentType":"ENABLED"}}'Note: The parameters are predefined in the
watches-app-tracing.yamlfile.For more information about annotations, see Ingress annotations documentation.
Deploy NetScaler CPX with the NetScaler Observability Exporter support
You can deploy NetScaler CPX enabled with the NetScaler Observability Exporter support.
While deploying NetScaler CPX, you can modify the deployment YAML file cpx-ingress-tracing.yaml to include the configuration information that is required for the NetScaler Observability Exporter support.
Perform the following steps to deploy a NetScaler CPX instance with the NetScaler Observability Exporter support:
-
Download the cpx-ingress-tracing.yaml and
cic-configmap.yamlfile. -
Create a ConfigMap with the required key-value pairs and deploy the ConfigMap. You can use the
cic-configmap.yamlfile that is available, for the specific endpoint, in the directory. -
Modify NetScaler CPX related parameters, as required. For example, add lines under
argsin thecpx-ingress-tracing.yamlfile as following:args: - --configmap default/cic-configmap -
Edit the
cic-configmap.yamlfile to specify the following variables for NetScaler Observability Exporter in theNS_ANALYTICS_CONFIGendpoint configuration.server: 'coe-zipkin.default.svc.cluster.local' # COE service FQDN -
Deploy NetScaler CPX with the NetScaler Observability Exporter support using the following commands:
  kubectl create -f cpx-ingress-tracing.yaml
  kubectl create -f cic-configmap.yaml
Note:
If you have used a namespace other than default, change
coe-zipkin.default.svc.cluster.localtocoe-zipkin.<desired-namespace>.svc.cluster.local. If ADC is outside the Kubernetes cluster, then you must specify IP address and Nodport address of NetScaler Observability Exporter.
Deploy Zipkin, Elasticsearch, and Kibana using YAML files
To deploy Zipkin, Elasticsearch, and Kibana using YAML, perform the following steps:
-
Download the following YAML files:
-
Edit the namespace definition, if you want to use a custom namespace other than the default.
-
Run the following commands to deploy Zipkin, Elasticsearch, and Kibana:
  kubectl create -f zipkin.yaml
  kubectl create -f elasticsearch.yaml
  kubectl create -f kibana.yaml
Note:
Zipkin, Elasticsearch, and Kibana are deployed in the default namespace of the same Kubernetes cluster.
Deploy NetScaler Observability Exporter using the YAML file
You can deploy NetScaler Observability Exporter using the YAML file. Download the coe-zipkin.yaml file.
To deploy NetScaler Observability Exporter using the Kubernetes YAML, run the following command in the Elasticsearch endpoint:
kubectl create -f coe-zipkin.yaml
Note:
Modify the YAML file for NetScaler Observability Exporter if you have a custom namespace other than the default.
Verify the NetScaler Observability Exporter deployment
To verify the NetScaler Observability Exporter deployment, perform the following:
-
Verify the deployment by sending a request to the application using the following command.
kubectl run -i --tty busybox --image=busybox --restart=Never --rm -- wget --no-check-certificate "https://cpx-ingress-zipkin.default.svc.cluster.local/serial/view/watches" -
Open the Zipkin user interface using the Kubernetes node IP address and nodeport.
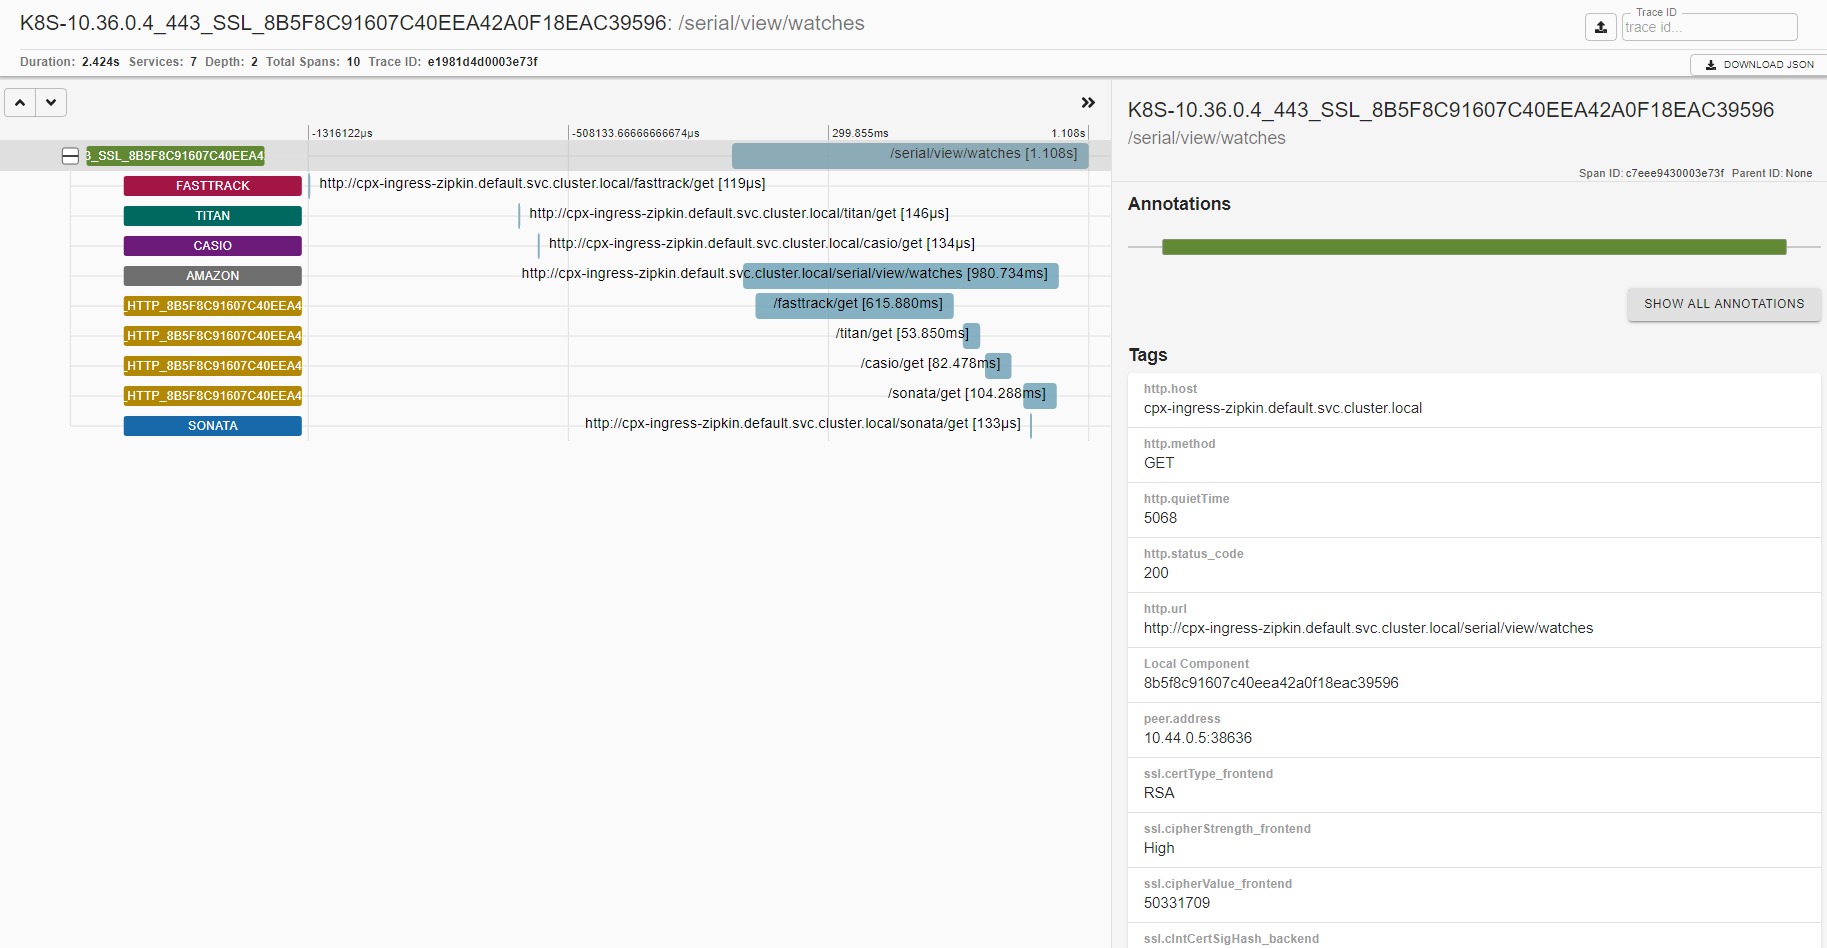
http://*k8-node-ip-address*:*node-port*/In the following image, you can view the traces of the Watches application. The Watches application has multiple microservices for each watches type, communicating with each other to serve the application data. The trace data shows application
FASTTRACKtook more time to serve when compare to other micro services. In this way, you can identify the slow performing workloads and troubleshoot it.
You can view raw data on your Kibana dashboard too. Open Kibana using the
http://<node-ip>:<node-port>and commence with defining a zipkin index pattern.Use the
timestamp_millisfield as the timestamp field. After creating the index pattern, click the Discover tab and you can view the trace information collected by Zipkin.
For information on troubleshooting related to NetScaler Observability Exporter, see NetScaler CPX troubleshooting.
In this article
- Deploy NetScaler Observability Exporter
- Deploy application with tracing enabled
- Deploy NetScaler CPX with the NetScaler Observability Exporter support
- Deploy Zipkin, Elasticsearch, and Kibana using YAML files
- Deploy NetScaler Observability Exporter using the YAML file
- Verify the NetScaler Observability Exporter deployment