Monitoring and Managing Events Generated on NetScaler instances
Use the Events feature to monitor and manage the events generated on the NetScaler instances. The Management Service identifies events in real time, helping you address issues immediately and keeps the NetScaler instances running effectively. You can also configure event rules to filter the events generated and get notified to take actions on the filtered list of events.
Viewing All Events
You can view all the events generated on the NetScaler instances provisioned on the NetScaler SDX appliance. You can view the details such as severity, category, date, source, and message for each of the events.
To view the events, navigate to Configuration > NetScaler > Events > All Events.
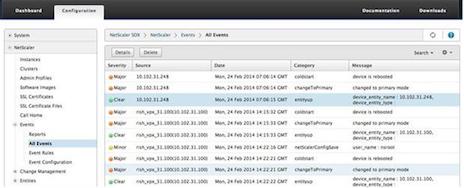
You can view the event history and entity details by selecting the event and clicking the Details button. You can also search for a particular event or delete it from this page.
Note: After you delete the events, you will not be able to recover them.
-
Viewing Reports
The Reports page displays the events summary in a graphical format. Your view of the reports can be based on various time scales. By default the time scale is Day.
To display the reports, navigate to Configuration > NetScaler > Events > Reports. Following are the graphical reports supported on the Management Service
-
Events
The Events report is a pie chart representation of the number of events, segmented, and color coded based on their severity.
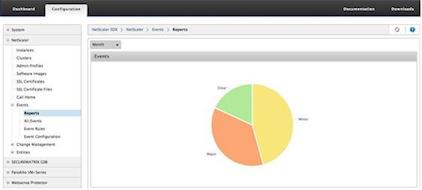
To view the details of the events of a particular severity, click that segment of the pie chart, you can view the following details:
- Source: System name, host name, or the IP address on which the event was generated.
- Date: Date and time when the alarm was generated.
- Category: Event category (for example,
entityup). - Message: Description of the event.
-
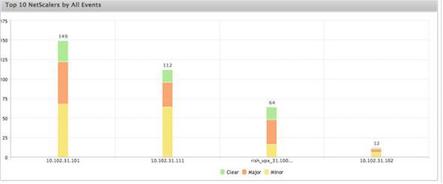
Top 10 NetScaler instances by All Events
This report is a bar chart that displays the top 10 NetScaler instances according to the number of events for the selected time scale.
-
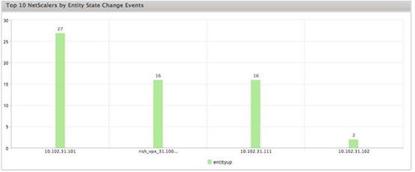
Top 10 NetScaler instances by Entity State Change Events
This report is a bar chart that displays the top 10 NetScaler instances according to the number of entity state changes for the selected time scale. The entity state changes reflect entity up, entity down, or out of service events.
-
Top 10 NetScaler instances by Threshold Violation Events
This report is a bar chart that displays the top 10 NetScaler instances according to the number of threshold violation events for the selected time scale. The threshold violation events reflect the following events:
- cpuUtilization
- memoryUtilization
- diskUsageHigh
- temperatureHigh
- voltageLow
- voltageHigh
- fanSpeedLow
- temperatureCpuHigh
- interfaceThroughputLow
- interfaceBWUseHigh
- aggregateBWUseHigh
-
Top 10 NetScaler instances by Hardware Failure Events
This report is a bar chart that displays the top 10 NetScaler instances according to the number of hardware failure events for the selected time scale. The hardware failure events reflect the following events:
- hardDiskDriveErrors
- compactFlashErrors
- powerSupplyFailed
- “sslCardFailed”
-
Top 10 NetScaler instances by Configuration Change Events
This report is a bar chart that reflects the top 10 NetScaler instances according to the number of configuration change events for the selected time scale. You can click the chart to drill down and view the user based configuration changes for an instance. You can further view the authorization and execution status details by clicking this chart.
-
<Top 10 NetScaler instances by Authentication Failure Events
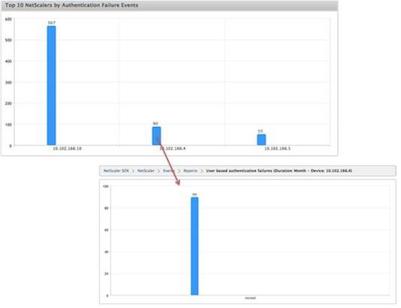
This report is a bar chart that displays the top 10 NetScaler instances according to the number of authentication failure events for the selected time scale. You can click the chart to drill down and view the user based authentication failures for an instance.
-
-
Configuring Event Rules
You can filter a set of events by configuring rules with specific conditions and assigning actions to the rules. When the events generated meet the filter criteria in the rule, the action associated with the rule is performed. The conditions for which you can create filters are: severity, devices, failure objects, and category.
You can assign the following actions to the events:
- Send e-mail Action Sends an email for the events that match the filter criteria.
- Send SMS Action Sends a Short Message Service(SMS) for the events that match the filter criteria.
To add event rules
-
Navigate to Configuration > NetScaler > Events > Event Rules, and click Add.
-
On the Rule page set the following parameters:
- Name—Name of the event rule.
- Enabled—Enable the event rule.
- Severity—Severity of the events for which you want to add the event rule.
- Devices—IP addresses of the NetScaler instances for which you want to define an event rule.
- Category—Category or categories of the events generated by the NetScaler instances.
- Failure Objects—Entity instances or counters for which an event has been generated.
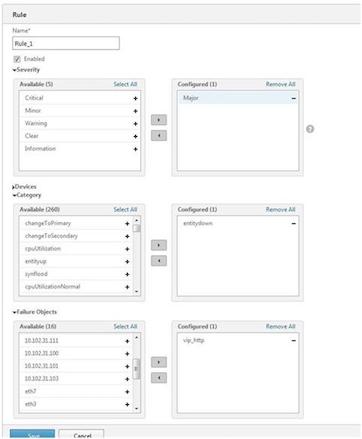
Note: This list can contain counter names for all threshold-related events, entity names for all entity-related events, and certificate names for certificate-related events.
-
Click Save.
-
Under Rule Actions, you can assign the notification actions for the event.
-
Mail Profile—Mail server and mail profile details. An email is triggered when the events meet the defined filter criteria.
-
SMS Profile—SMS server and SMS profile details. An SMS is triggered when the events meet the defined filter criteria.

-
-
Click Done.
-
Configuring Events
You can assign severity levels to events that are generated for the NetScaler instances on the SDX appliance. You can define the following types of severity levels: Critical, Major, Minor, Warning, Clear, and Information. You can also suppress the events for a specific time. To configure severity:
-
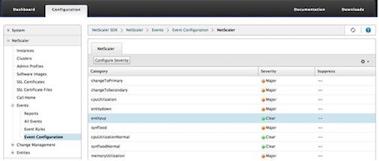
Navigate to Configuration > NetScaler > Events > Event Configuration, select the event from the list, and then click Configure Severity.
-
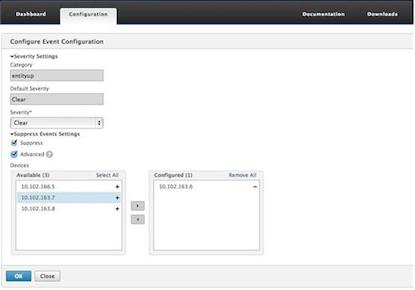
On the Configure Events Configuration page, select the required severity level from the drop-down list.
-
Alternatively, you can suppress the events by selecting the Suppress check box. You can also specify the NetScaler instances for which you want to suppress this event by using the Advanced option.
-
Click OK.
-