View applications
By default, the application dashboard displays all applications. Depending upon your requirement, you can use the filter option to view applications.
Note:
Starting from 14.1 20.x build, you can view metrics details for applications that are created from the NetScaler admin partitions.
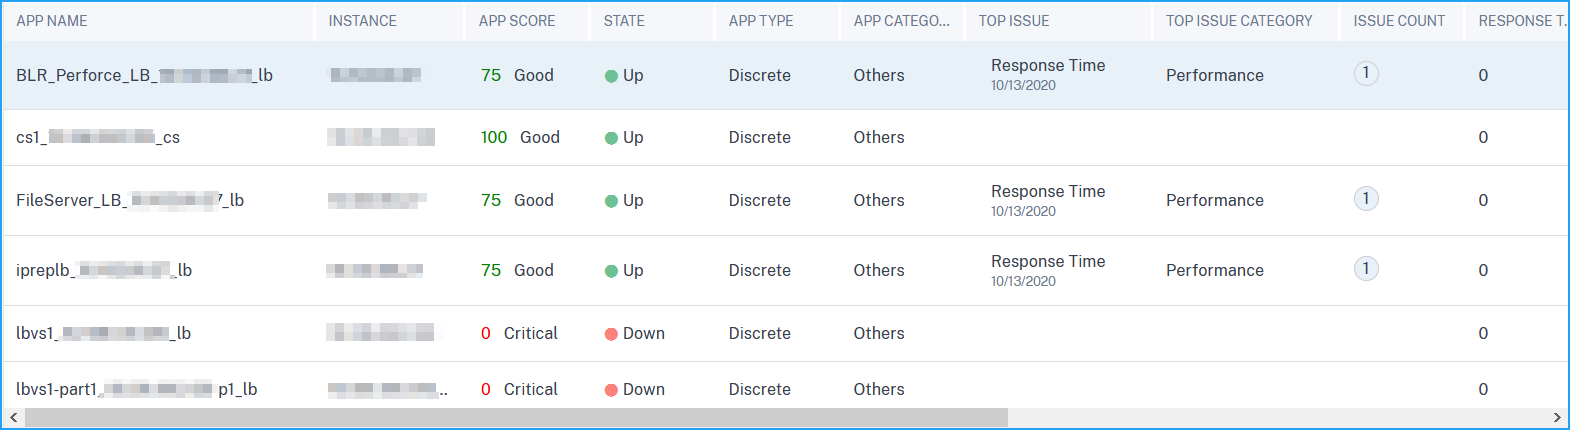
The dashboard displays the following application details:
-
App name – Denotes the application name.
-
Instance – Denotes the NetScaler instance.
-
App Score – Denotes the application score and the status such as Critical, Good, Fair, and Not Applicable.
-
State – Denotes the current availability of the application, such as Up, Down, Partially Up, Out of Service, and NA.
-
Up – All virtual servers associated with the application are Up.
-
Down – All virtual servers associated with the application are Down.
-
Partially Up – Either one virtual associated with the application is Down or Out of Service.
-
Out of Service – All virtual servers associated with the applications are out of service.
-
NA – No virtual servers is configured for the application.
-
-
App Type – Denotes the application type such as Custom, Discrete, or Kubernetes services.
-
App Category – Denotes the category that is assigned to the application.
-
Top issue – Denotes the issue that has the maximum error counts on the application.
-
Top issue category – Denotes the category of the issue.
-
Issue count – Denotes the total issue counts for the application.
-
Response time – Denotes the average response time to respond from the application.
-
Total requests – Denotes the total requests received by the application.
-
Throughput – Denotes the total network throughput for the application. Throughput is calculated by the Req Bytes / Sec + Res Bytes / Sec for the virtual servers.
-
Data volume – Denotes the total data processed by the application.
-
Client connections – Denotes the average client connections established by the application.
-
Server connections – Denotes the average server connections established by the application.
View microservices applications
To view the microservices applications, select the K8s_Discrete option under App Type filter.
You can view the microservice applications in App Dashboard as the following name format:
<k8s service>_<k8s namespace>_<k8s cluster_name>
For example, tea-beverage_sg-demo_adm-cluster refers to a service named “tea-beverage” with the namespace of sg-demo in the cluster adm-cluster.
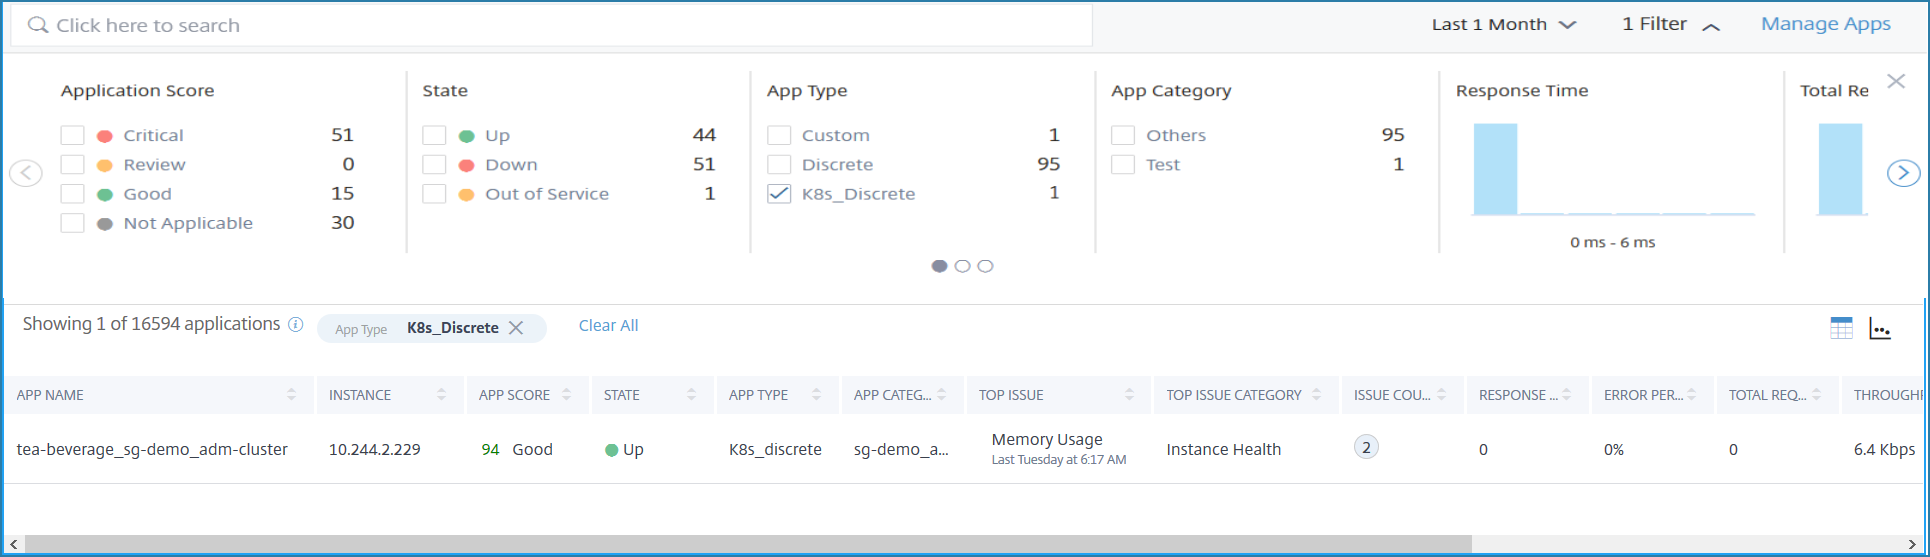
The following metrics are displayed in dashboard for the selected time duration:
-
App Name – Denotes the application name.
-
Instance – Denotes the NetScaler CPX instance IP address.
-
App Score – Denotes the application score.
-
Critical – App score is between 0 and < 40
-
Review – App score is between 40 and < 75
-
Good – App score is greater than 75
-
-
State – Denotes the current application status.
-
App Category – Denotes the cluster name where the application is hosted.
-
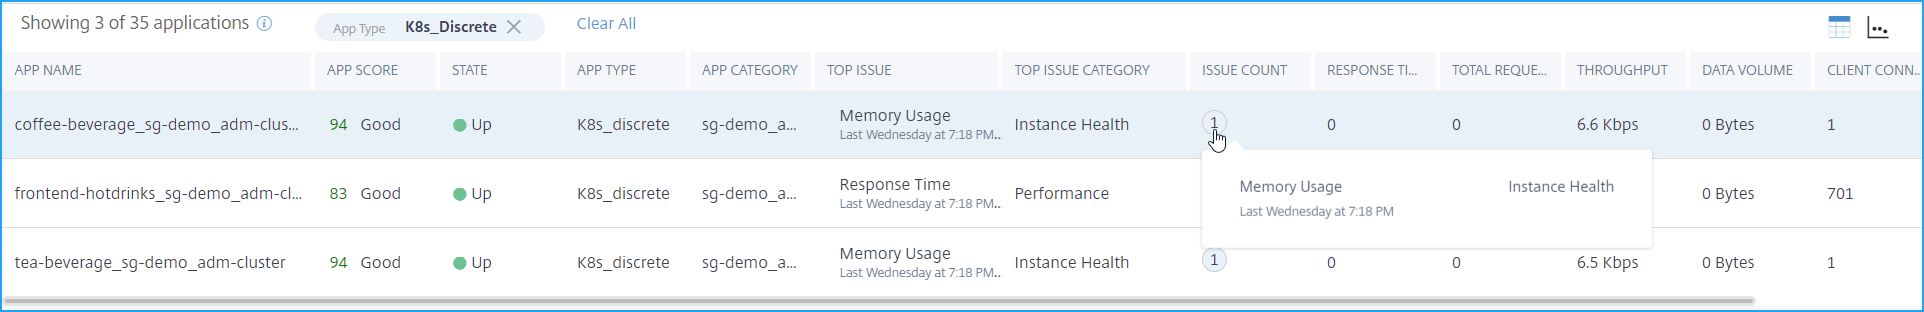
Top Issue – Denotes the top issues that affects the current application score.
-
Top Issue Category – Denotes the issue category affecting the application.
-
Issue Count – Denotes the total issues affecting the application. Hover the mouse pointer on the issue count to see the overview of the issues.
-
Response Time – Denotes the average response time received by the application.
-
Error Percentage – Denotes the average error percentage of 5xx errors for the application.
-
Total Requests – Denotes the total number of requests received by the application.
-
Throughput – Denotes the total network throughput processed by the application.
-
Data volume – Denotes the total data processed by the application. Data volume is calculated as the total request bytes and response bytes for the application.
-
Client connections – Denotes the average client connections established by the application. This can also refer to the associated outgoing services connected with the selected service.
-
Server connections – Denotes the average server connections established by the application. This can also refer to the associated incoming services connected with the selected service.
Click the + option to add or remove the options to be displayed in the dashboard.
Click an application to view the application details. For more information, Microservices application details