Application details for microservices applications
Click a microservices application from the dashboard to drill down for further detailed information.
The selected application page is displayed.

From the application details page:
-
Select the time duration from the list to view details for the specific time duration
-
Click Service Graph to view service graph for the selected application. For more information, see Service Graph for Applications
-
Click Transaction Logs to view the detailed transactions for the selected application
-
Click Audit logs to view the detailed audit log information
After you select the time duration, the following application details are displayed:
-
App Score – The application score for the selected time duration. You can also view the current application issues, which are known as the penalty score applicable based on the issue category. The final score is calculated as 100 minus total penalty.

1 – Denotes the current app score
2 – Denotes the CPX IP address, application type such as load balancing or content switching, and service namespace and cluster name where the service is hosted
3 – Denotes the issues affecting the current application score
This dashboard also enables you to view the current issues that are affecting the app score. You can view the issues details under Issues.
-
K8s service details
You can view the following details:

-
Service Name – The service name
-
Cluster Name – The cluster name where the service is hosted
-
Namespace – The namespace assigned to the service
-
Service Labels – The service labels assigned to the service
-
-
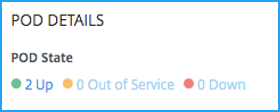
Pod Details
A pod is a group of containers hosted in the Kubernetes cluster. Inside a pod, you can deploy multiple containerized applications. Each pod is associated with an IP address.

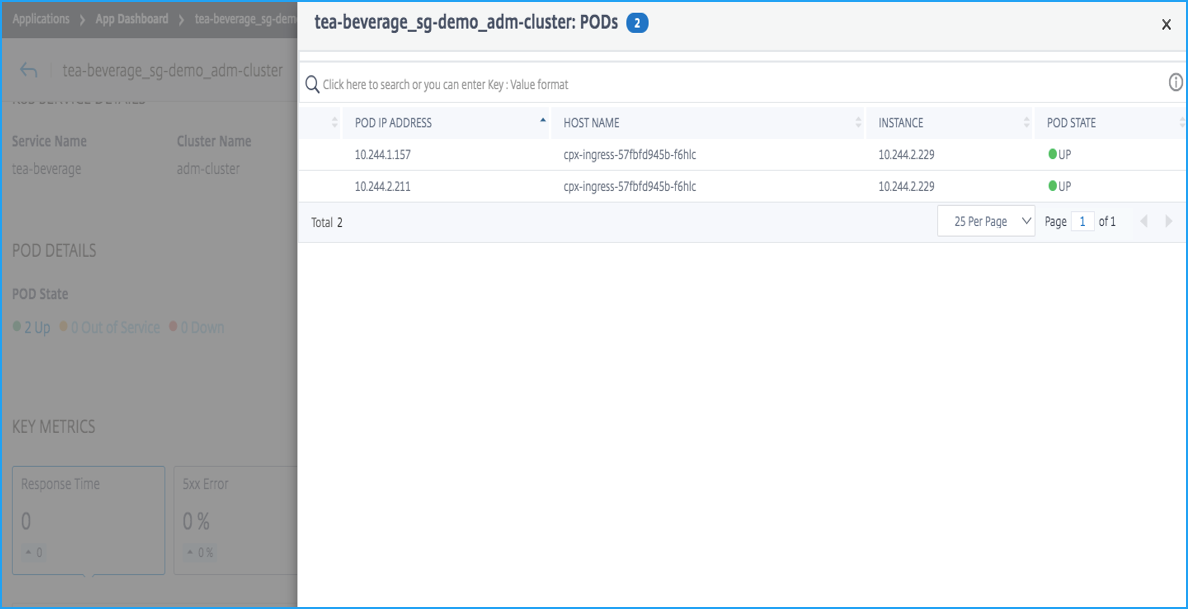
Click the pod state to view the details

-
Pod IP Address – Denotes the Pod IP address
-
Host name – Denotes the host name assigned to the pod
-
Instance – Denotes the NetScaler CPX IP address
-
POD state – Denotes the pod current status
-
-
Key Metrics – The key metrics details, such as Response time, 5xx errors, Requests per second, Throughput, Client Connections, Server Connections, and Data Volume are displayed.
In each metric, you can view the average value and the difference value for the selected time duration. The difference value is calculated as the first value minus the last value of the selected time duration.
You can view the following instance metrics in a graph format for the selected time duration:

The following image is an example for Data Volume and the selected time duration is 1 month. The value 202.66 MB is the total Data Volume for the 1-month duration and the value 8.13 MB is the difference value. In the graph, the first value is 14.11 and the last value is 5.98. The difference value is 14.11 – 5.98 = 8.13 MB.

-
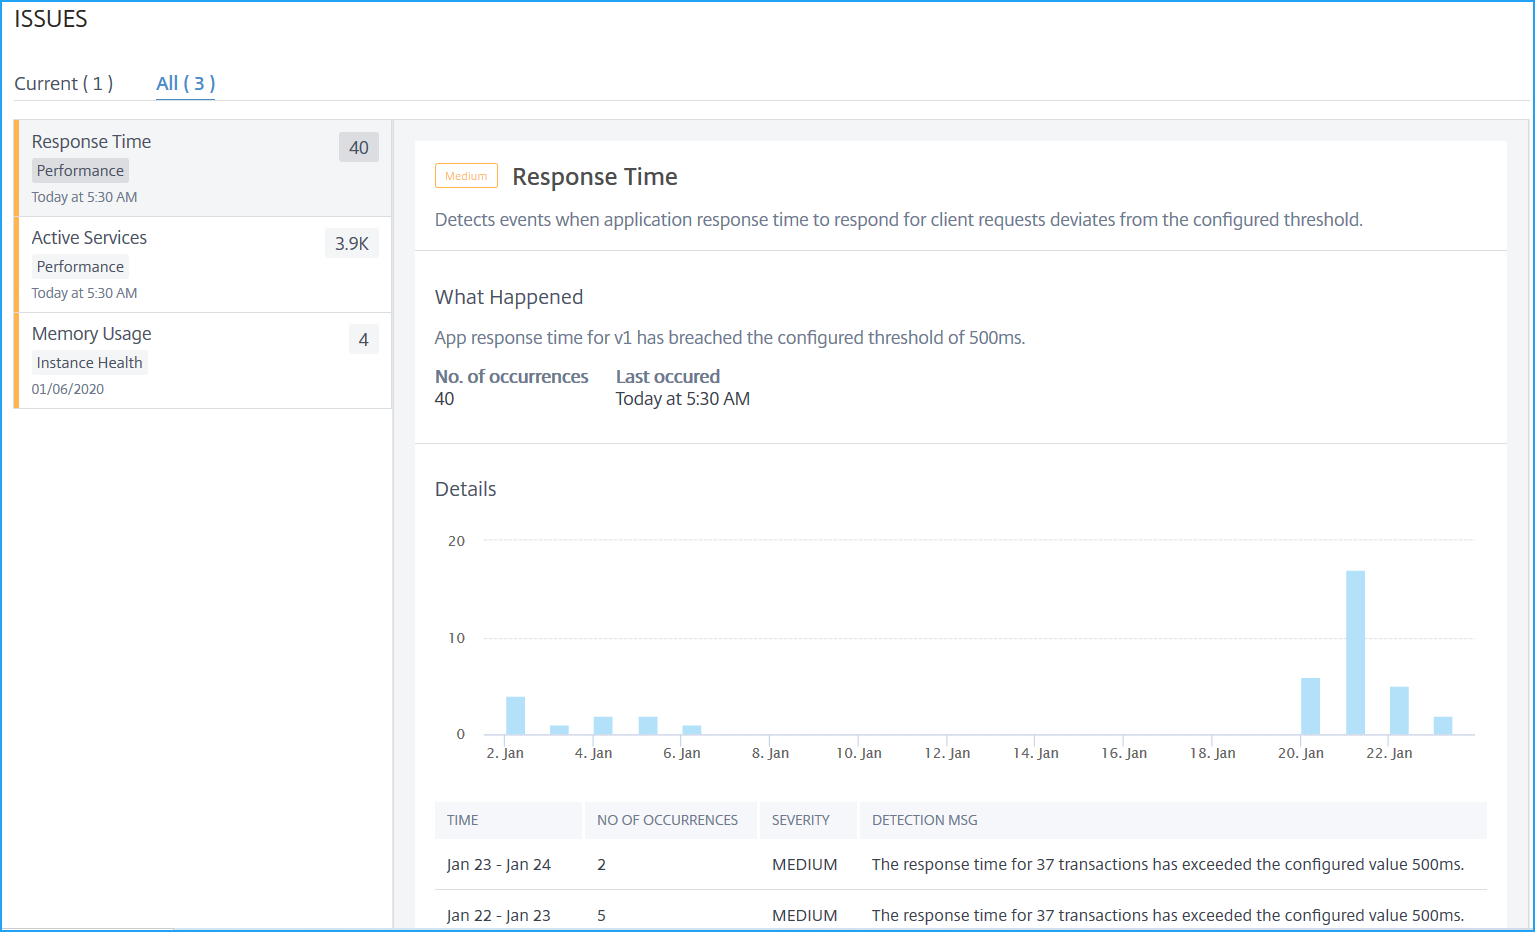
Issues – The issues that are applicable for the selected application. You can view the following issues along with its category:
Performance Instance Health Config System Resources Response Time Average CPU Usage High 5xx response Improper persistence type Low Session Reuse Memory Usage Unusually large HTTP packets NIC Card Saturation SurgeQueue Buildup TCP reassemble queue limit hits SSL Real Time Traffic Click each issue to view the following information:
-
Total occurrences
-
Recommended Actions to troubleshoot the issue
-
The issue details such as time, service name, total occurrences, severity, and detection message

-
The issues that display in Current tab refer to the application issues for the select time duration.
-
The issues that display in All tab refer to total application issues.
-
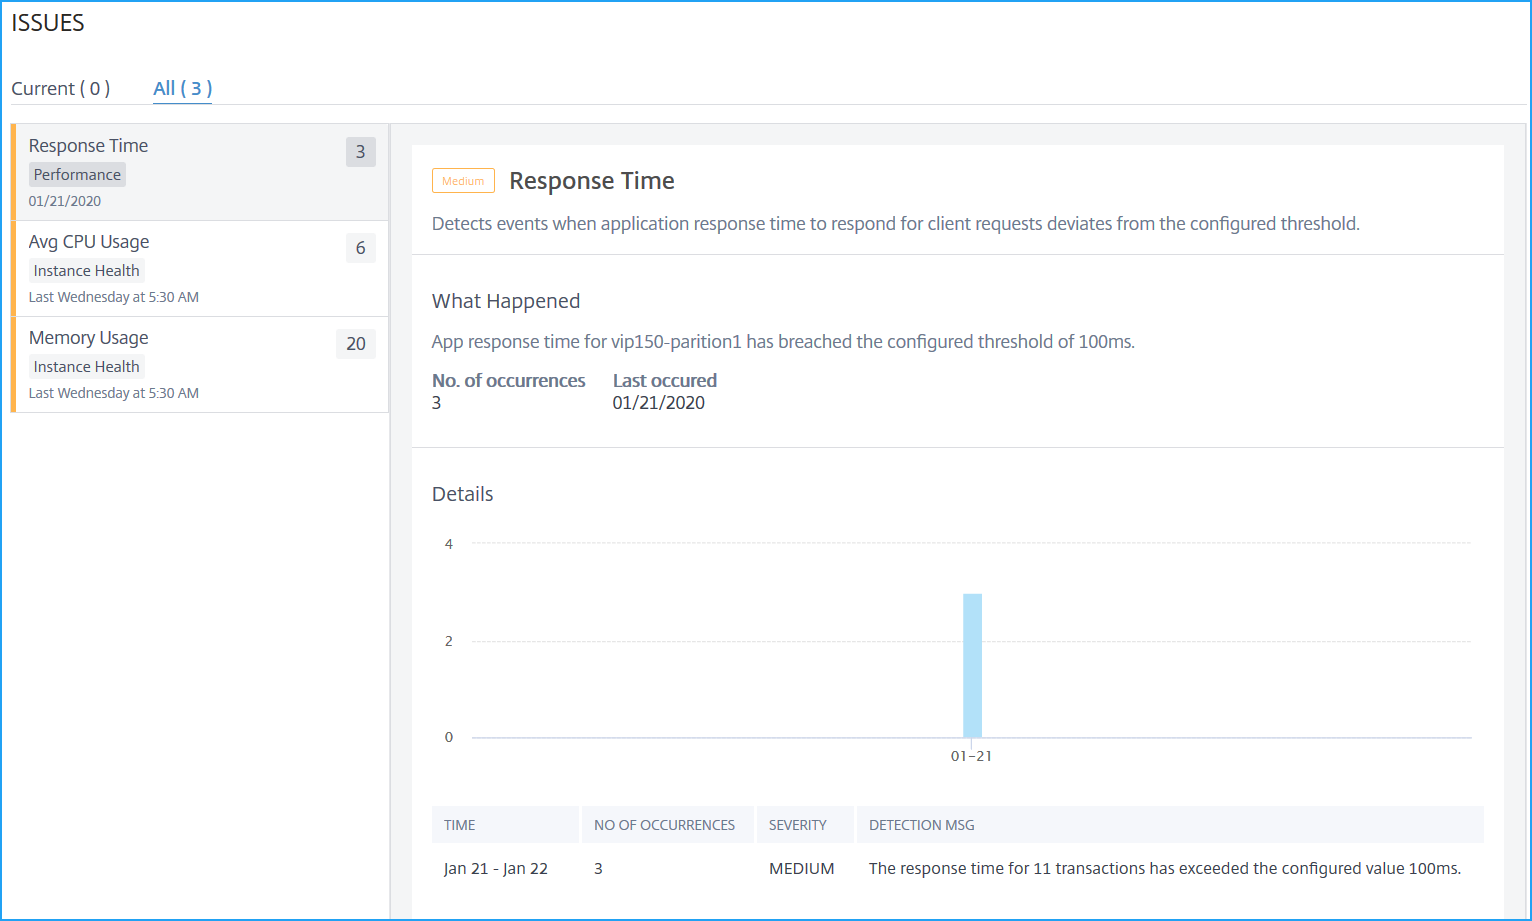
The following example is the application issues for 1-day duration. The Current tab indicates no current issues impacting the app score.

The All tab displays the total issues detected for the 1-day duration.

-