Select App Score components and set thresholds
In App Dashboard, as an administrator, you can decide to select the components and configure thresholds for app score calculation. App Score is the scoring system that defines:
-
How well an application is performing
-
Whether the application is performing well in terms of responsiveness
Navigate to Applications > Dashboard and then select the settings icon.

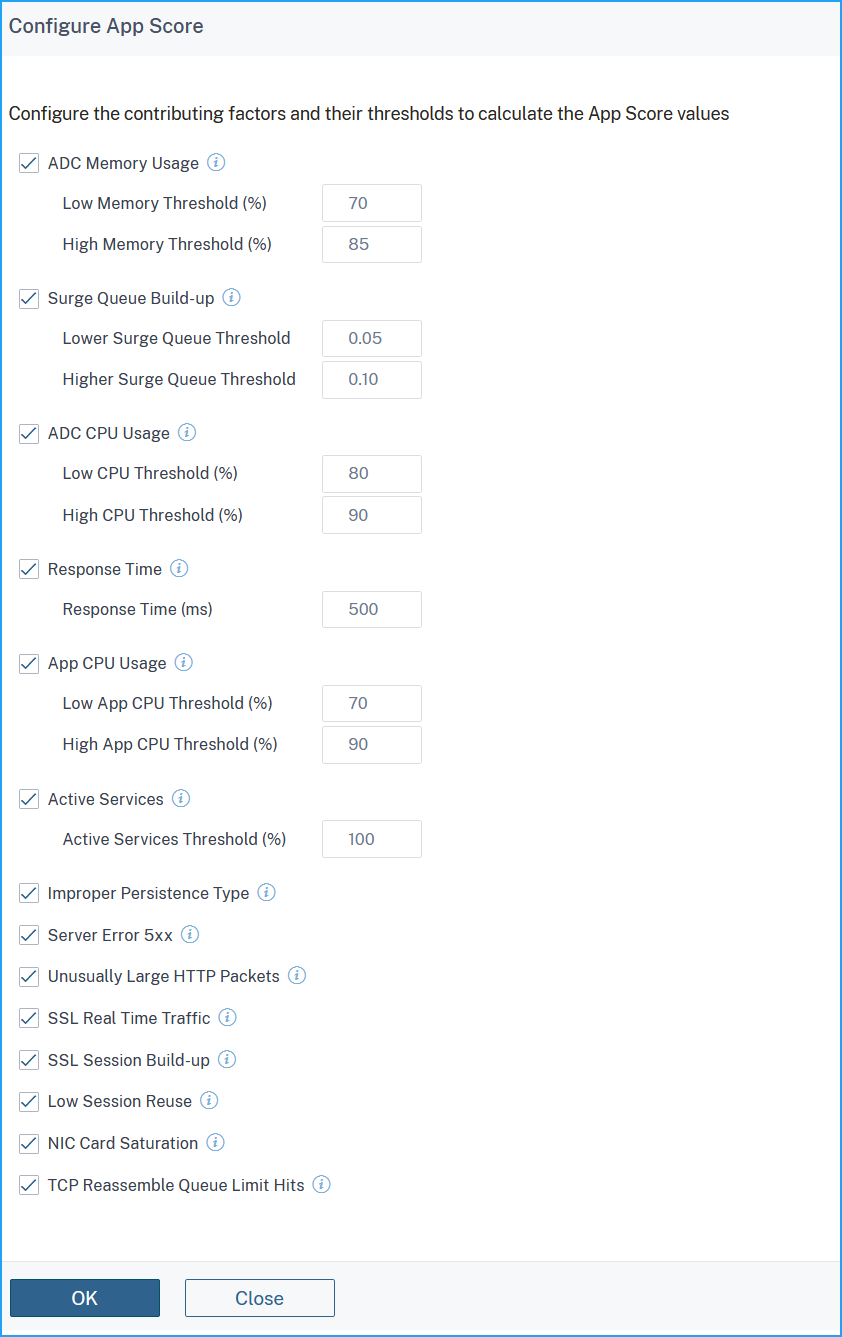
In the Configure App Score page, you can select the components and configure thresholds to determine the final app score.

App Score calculation is based on the following components:
| App Score components | User configured thresholds | Description |
|---|---|---|
| NetScaler Memory usage | Yes | The low and high threshold value for the total memory usage in the NetScaler instance |
| Surge queue buildup | Yes | The low and high threshold value for the total surge requests that are in queue and need a response. |
| NetScaler CPU usage | Yes | The low and high threshold value for the total CPU usage in the NetScaler instance. |
| Response time | Yes | The time interval between sending a request packet and receiving the first response packet from the service configured on the virtual server. |
| App CPU Usage | Yes | The low and high threshold value for the total CPU usage by the application. |
| Active services | Yes | The threshold value of the percentage of services that must be active which are bound to the virtual server. |
| Improper persistence type | No | Indicates if the persistence usage on a virtual server is low. |
| Server error (5xx) | No | Indicates if the web server responds with 5xx errors. |
| Unusually large HTTP packets | No | Indicates the occurrences, if the HTTP messages with HTTP header size exceed the configured values in the NetScaler instance. |
| SSL real time traffic | No | Analyzes the SSL traffic to identify real time traffic and suggests optimal configuration settings for improving latency. |
| SSL session buildup | No | Indicates the session build-up over a period of time, which can lead to a large amount of memory being held up by these sessions in the NetScaler instance. |
| Low session reusage | No | Indicates if the actual number of sessions being reused by the NetScaler instance is less. |
| NIC card saturation | No | Indicates the total packets discarded by the interfaces. |
| TCP reassemble queue limit hits | No | Indicates if the Out-of-Order packets on a TCP connection exceed the configured out of order packet queue size. |
By default, all components are enabled. If you disable any component, NetScaler Console performs the final app score calculation only based on the selected components.