Configure Intelligent App Analytics
Note:
Starting from 14.1-21.x or later builds, Metrics Collector is disabled by default in the new NetScaler instances added in NetScaler Console. The metrics collector configuration for the existing managed instances remain unchanged.
The Intelligent App Analytics feature is supported only in NetScaler 12.1 Build 50.28 or later. Metrics Collector pushes the NetScaler counter data to NetScaler Console, which is used to detect application issues. To use the Intelligent App Analytics feature, Metrics Collector must be configured on each NetScaler instance.
Starting from 14.1-28.x build, Metrics collector and lean usage analytics are enabled at the virtual server level instead of the instance level. With this enhancement, Metrics Collector and lean usage analytics remain enabled only on your active virtual servers with high traffic. For more information, see Peak and lean usage analytics.
You can review your virtual servers and enable Metrics Collector and lean usage on other virtual servers.
To review and enable Metrics Collector:
-
Navigate to Settings > Analytics Configuration.
-
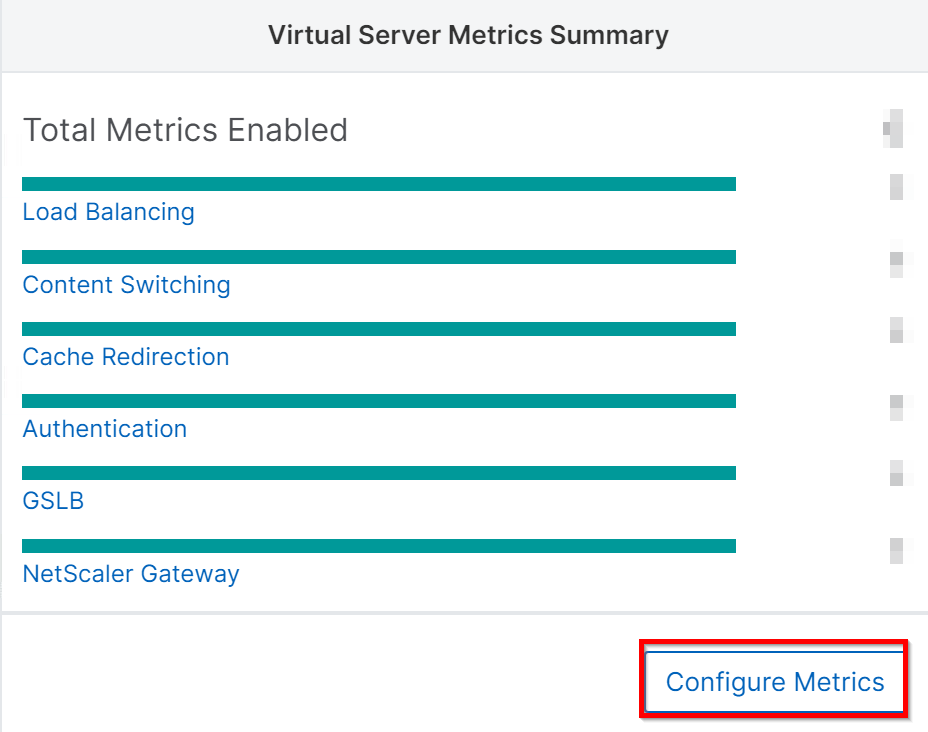
Click Configure Metrics under Virtual Server Metrics Summary.
-
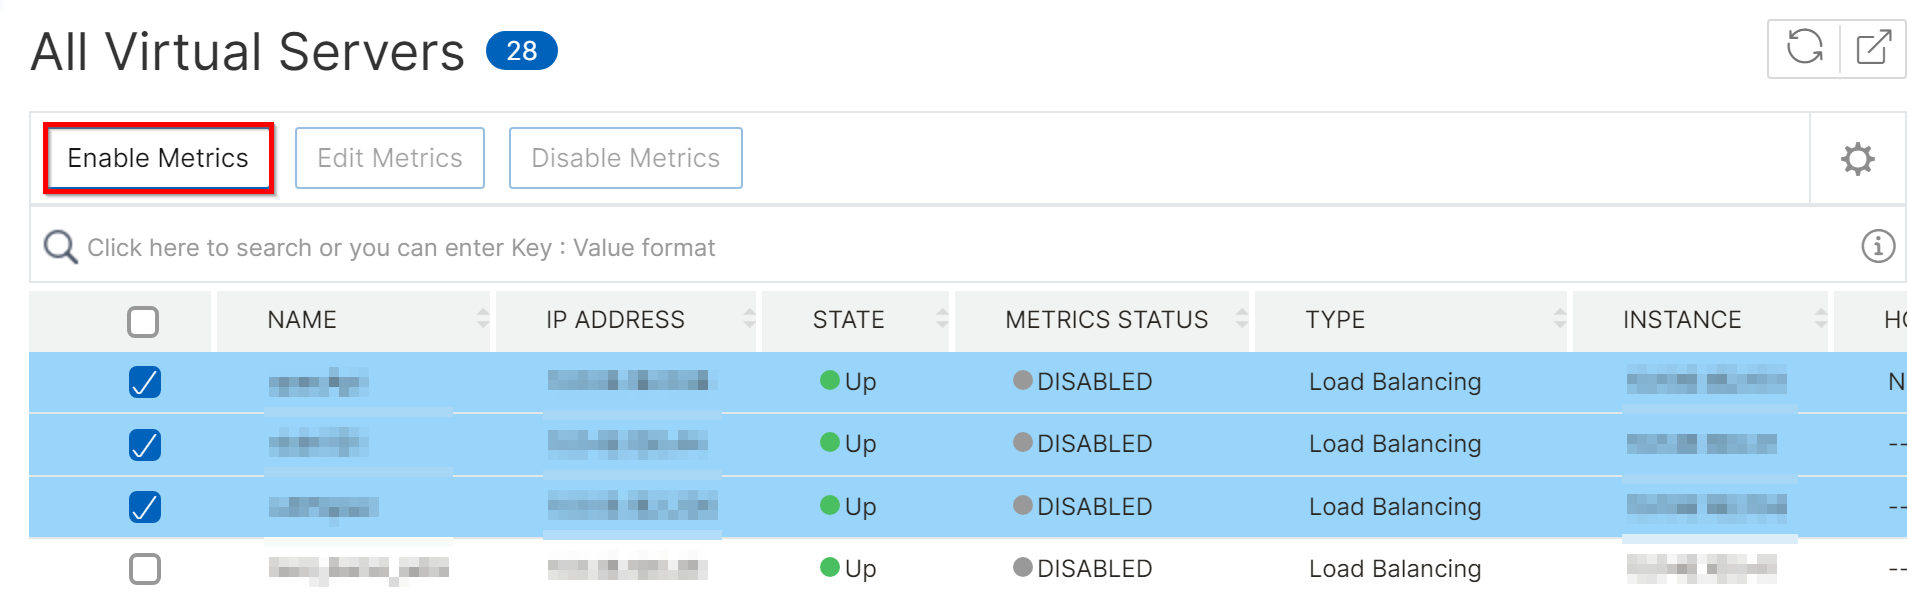
In the All Virtual Servers page, you can view the status of the metrics collector on each virtual server. Select the virtual servers that you want to enable and click Enable Metrics.
-
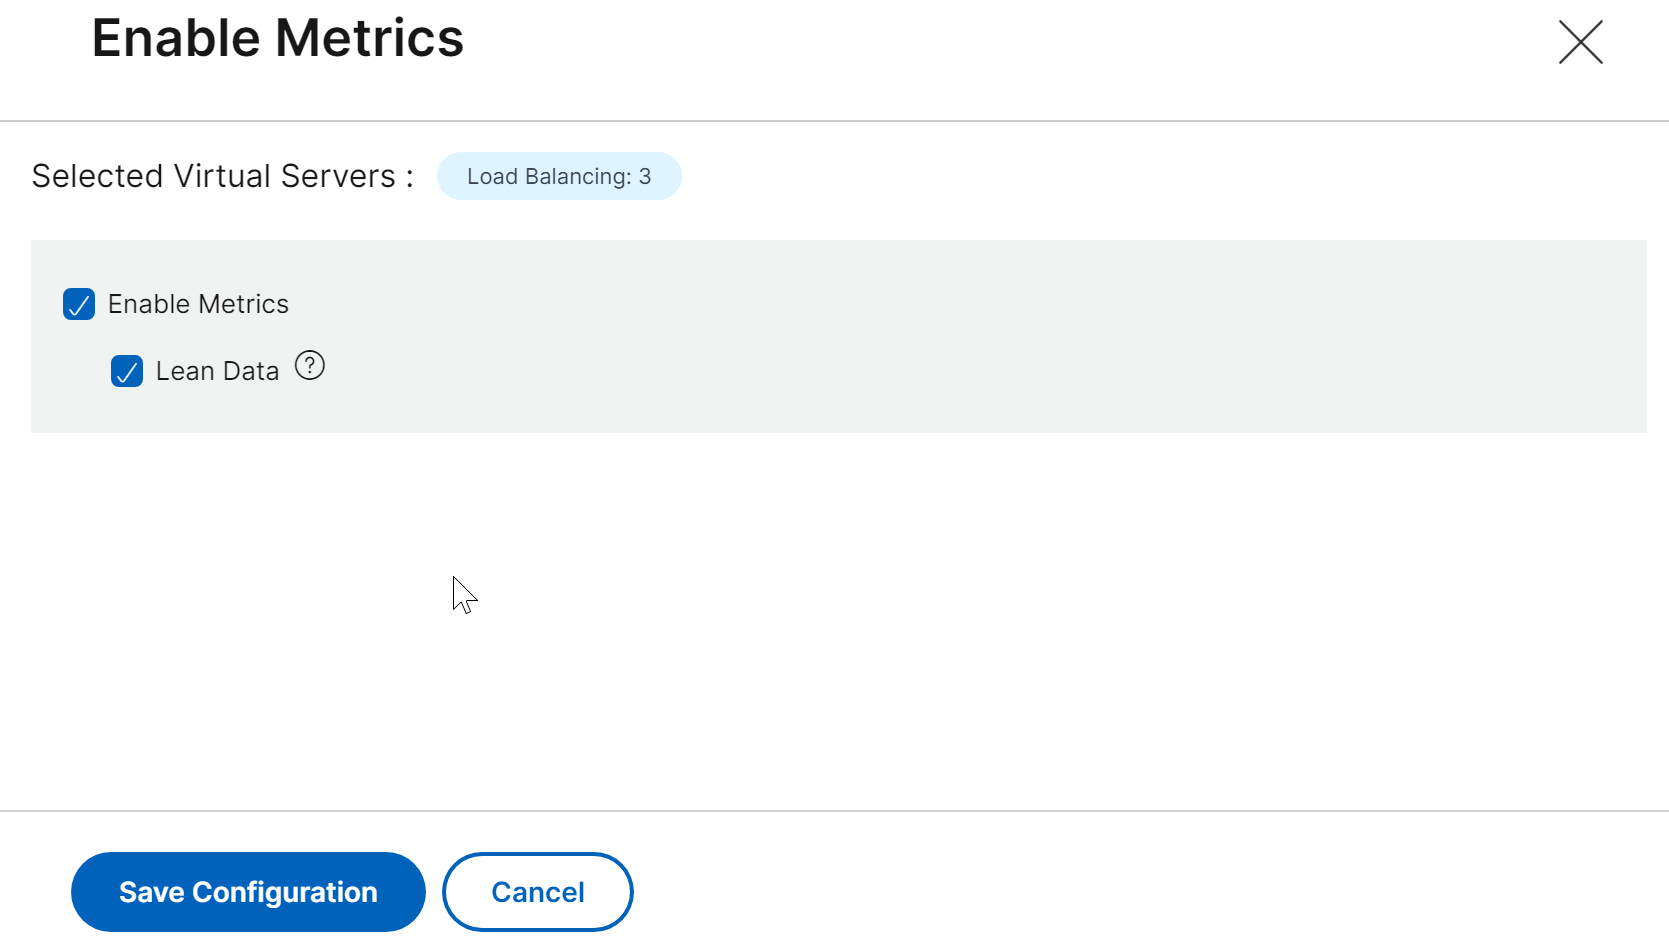
Select Enable Metrics to enable Metrics Collector. You can also select Lean Data if you want to enable and view lean period usage analytics. After selecting, click Save Configuration. For more information, see Peak and lean usage analytics.
Alternatively, you can also enable metrics collector and lean usage for the virtual servers from the NetScaler® instances page:
-
Navigate to Infrastructure > Instances, select the instance type, and select Metrics Collector from the Select Action list.
-
Select the virtual servers for which you want to enable metrics collector and click Enable Metrics.
-
Select Enable Metrics to enable Metrics Collector. You can also select Lean Data if you want to enable and view lean period usage analytics. After selecting, click Save Configuration.
Once the Metrics Collector option is enabled on the virtual server, navigate to Applications > Dashboard. Select an instance to view anomalies under Issues section.
We recommended to also enable analytics to visualize issues such as detailed web transactions for server errors (5xx). For more information, see Enable Analytics.