NetScaler Observability Exporter with Elasticsearch as endpoint
NetScaler Observability Exporter is a container that collects metrics and transactions from NetScaler. It transforms the data into the supported format (such as JSON) and exports data to Elasticsearch as an endpoint. Elasticsearch is a search engine based on the Lucene library. It provides a distributed, multitenant-capable, and full-text search engine with an HTTP web interface and schema-free JSON documents.
Deploy NetScaler Observability Exporter
You can deploy NetScaler Observability Exporter using the YAML file. Based on your NetScaler deployment, you can deploy NetScaler Observability Exporter either outside or inside Kubernetes clusters. You can deploy NetScaler Observability Exporter as a pod inside the Kubernetes cluster or on NetScaler MPX or VPX appliance outside the cluster.
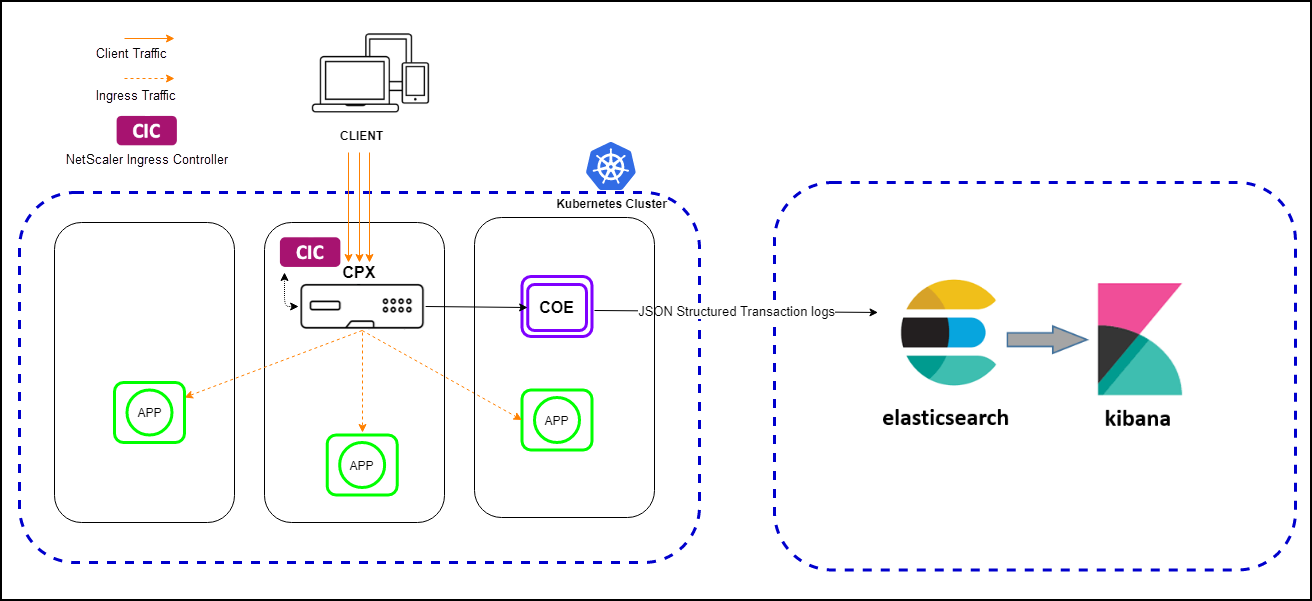
The following diagram illustrates a NetScaler as an Ingress Gateway with the NetScaler Ingress Controller and NetScaler Observability Exporter as sidecars. NetScaler Observability Exporter sends NetScaler application metrics and transaction data to Elasticsearch and the same data exports to Kibana. Kibana provides a graphical representation of the data.
Prerequisites
- Ensure that you have a Kubernetes cluster with
kube-dnsorCoreDNSaddon enabled.
In the following procedure, the YAML file is used to deploy NetScaler Observability Exporter in the Kubernetes defauIt namespace. If you want to deploy in a private namespace other than the default, edit the YAML file to specify the namespace.
The following is a sample application deployment procedure.
Note:
If you have a pre-deployed web application, skip the steps 1 and 2.
-
Create a secret ingress.crt and key ingress.key using your own certificate and key.
In this example, a secret, called ing in the default namespace, is created.
kubectl create secret tls ing --cert=ingress.crt --key=ingress.key -
Access the YAML file from webserver-es.yaml to deploy the application.
kubectl create -f webserver-es.yaml -
Define the specific parameters that you must import by specifying it in the ingress annotations of the application’s YAML file, using the smart annotations in the ingress.
ingress.citrix.com/analyticsprofile: '{"webinsight": {"httpurl":"ENABLED", "httpuseragent":"ENABLED", "httpHost":"ENABLED","httpMethod":"ENABLED","httpContentType":"ENABLED"}}'Note:
The parameters are predefined in the
webserver-es.yamlfile.For more information about Annotations, see Ingress annotations documentation.
Deploy NetScaler CPX with the NetScaler Observability Exporter support
You can deploy NetScaler CPX as a side car with the NetScaler Observability Exporter support enabled along with NetScaler Ingress Controller. You can modify the NetScaler CPX YAML file cpx-ingress-es.yaml to include the configuration information that is required for the NetScaler Observability Exporter support.
Perform the following steps to deploy a NetScaler CPX instance with the NetScaler Observability Exporter support:
- Download the cpx-ingress-es.yaml and cic-configmap.yaml file.
- Create a ConfigMap with the required key-value pairs and deploy the ConfigMap. You can use the
cic-configmap.yamlfile that is available, for the specific endpoint, in the directory. - Modify NetScaler CPX related parameters, as required.
-
Edit the
cic-configmap.yamlfile and specify the following variables for NetScaler Observability Exporter in theNS_ANALYTICS_CONFIGendpoint configuration.server: 'coe-es.default.svc.cluster.local' # COE service FQDNNote:
If you have used a namespace other than default, change
coe-es.default.svc.cluster.local totocoe-es.<desired-namespace>.svc.cluster.local. If ADC is outside the Kubernetes cluster, then you must specify IP address and nodport address of NetScaler Observability Exporter. -
Deploy NetScaler CPX with the NetScaler Observability Exporter support using the following commands:
  kubectl create -f cpx-ingress-es.yaml
  kubectl create -f cic-configmap.yaml
Deploy Elasticsearch and Kibana using YAML files
-
Download the Elasticsearch YAML file from elasticsearch.yaml and the Kibana YAML file from kibana.yaml.
-
Edit the namespace definition, if you want to use a different namespace other than default.
-
Run the following commands to deploy Elasticsearch and Kibana:
  kubectl create -f elasticsearch.yaml
  kubectl create -f kibana.yaml
Note: Elasticsearch and Kibana are deployed in the default namespace of the same Kubernetes cluster.
Deploy NetScaler Observability Exporter using the YAML file
You can deploy NetScaler Observability Exporter using the YAML file. Download the YAML file from coe-es.yaml.
To deploy NetScaler Observability Exporter using the Kubernetes YAML, run the following command in the Elasticsearch endpoint:
kubectl create -f coe-es.yaml
Note:
Modify the YAML file for NetScaler Observability Exporter if you have a custom namespace.
Verify the NetScaler Observability Exporter deployment
To verify the NetScaler Observability Exporter deployment, perform the following:
-
Verify the deployment using the following command:
kubectl get deployment,pods,svc -o wide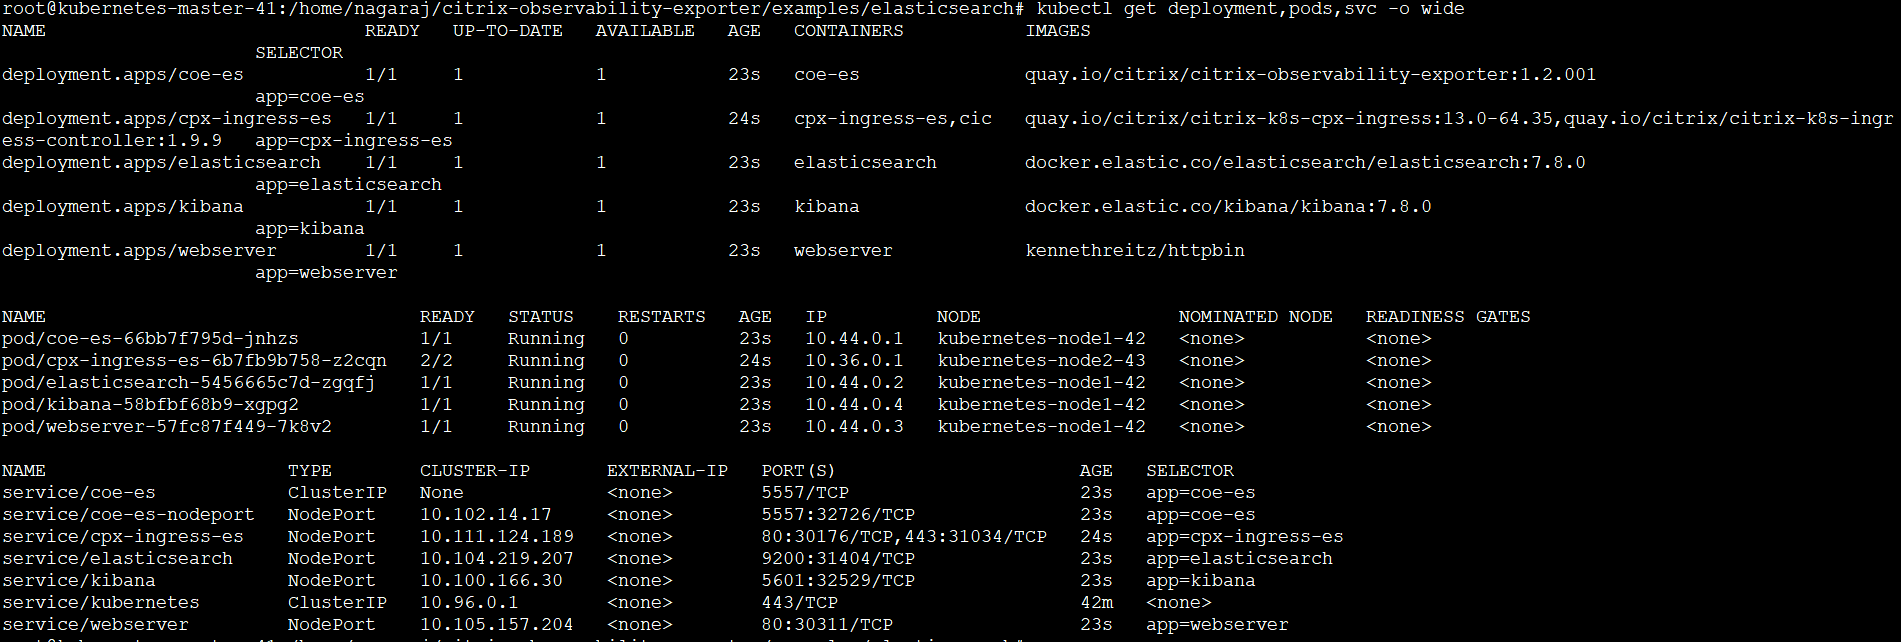
-
Access the application with a browser using the URL:
https://kubernetes-node-IP:cpx-ingress-es nodeport/.For example, from Step 1, access http://10.102.40.41:30176/ in which,
10.102.40.41is one of the Kubernetes node IPs.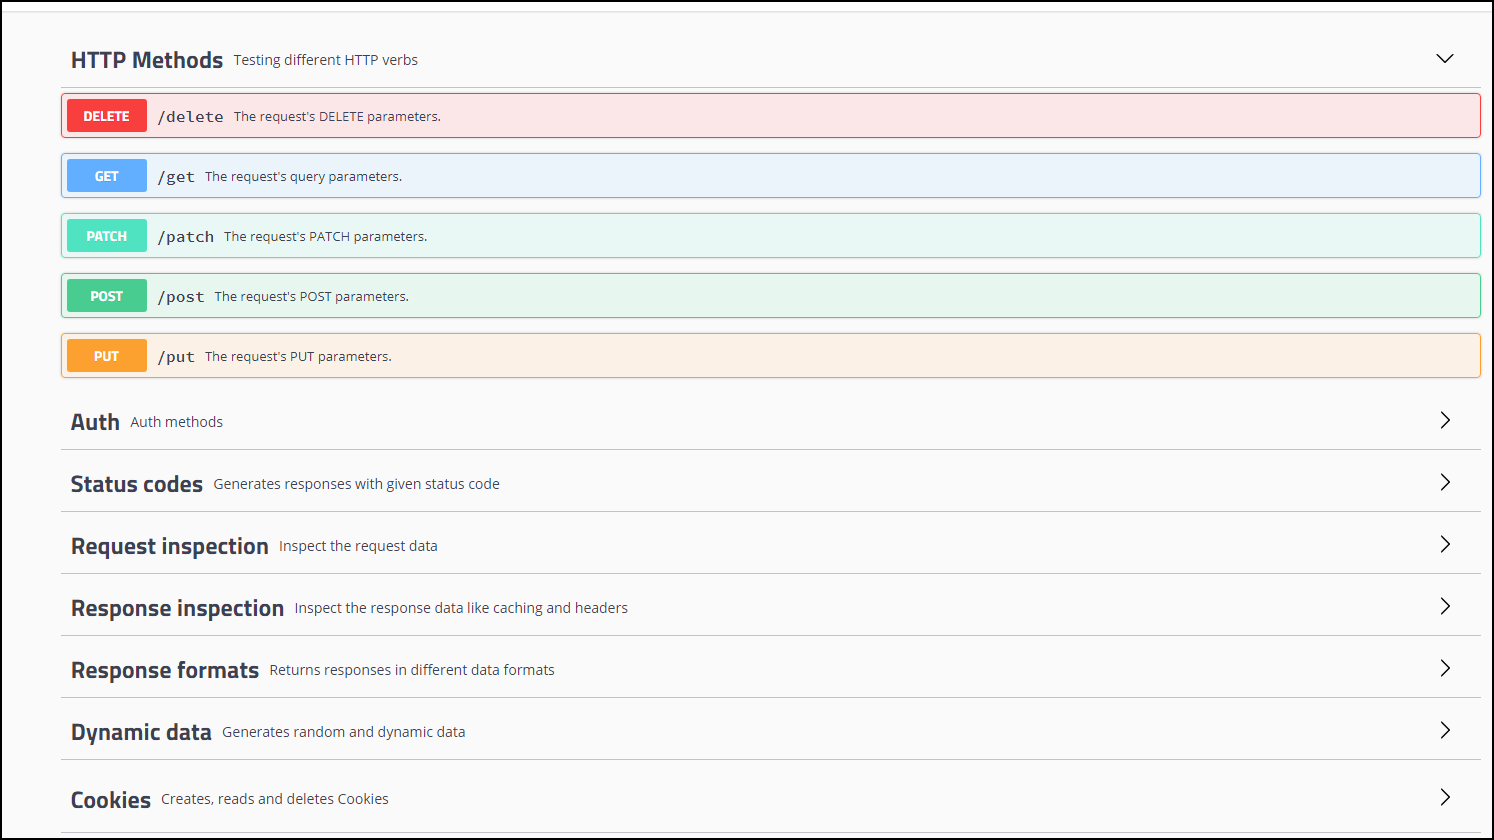
-
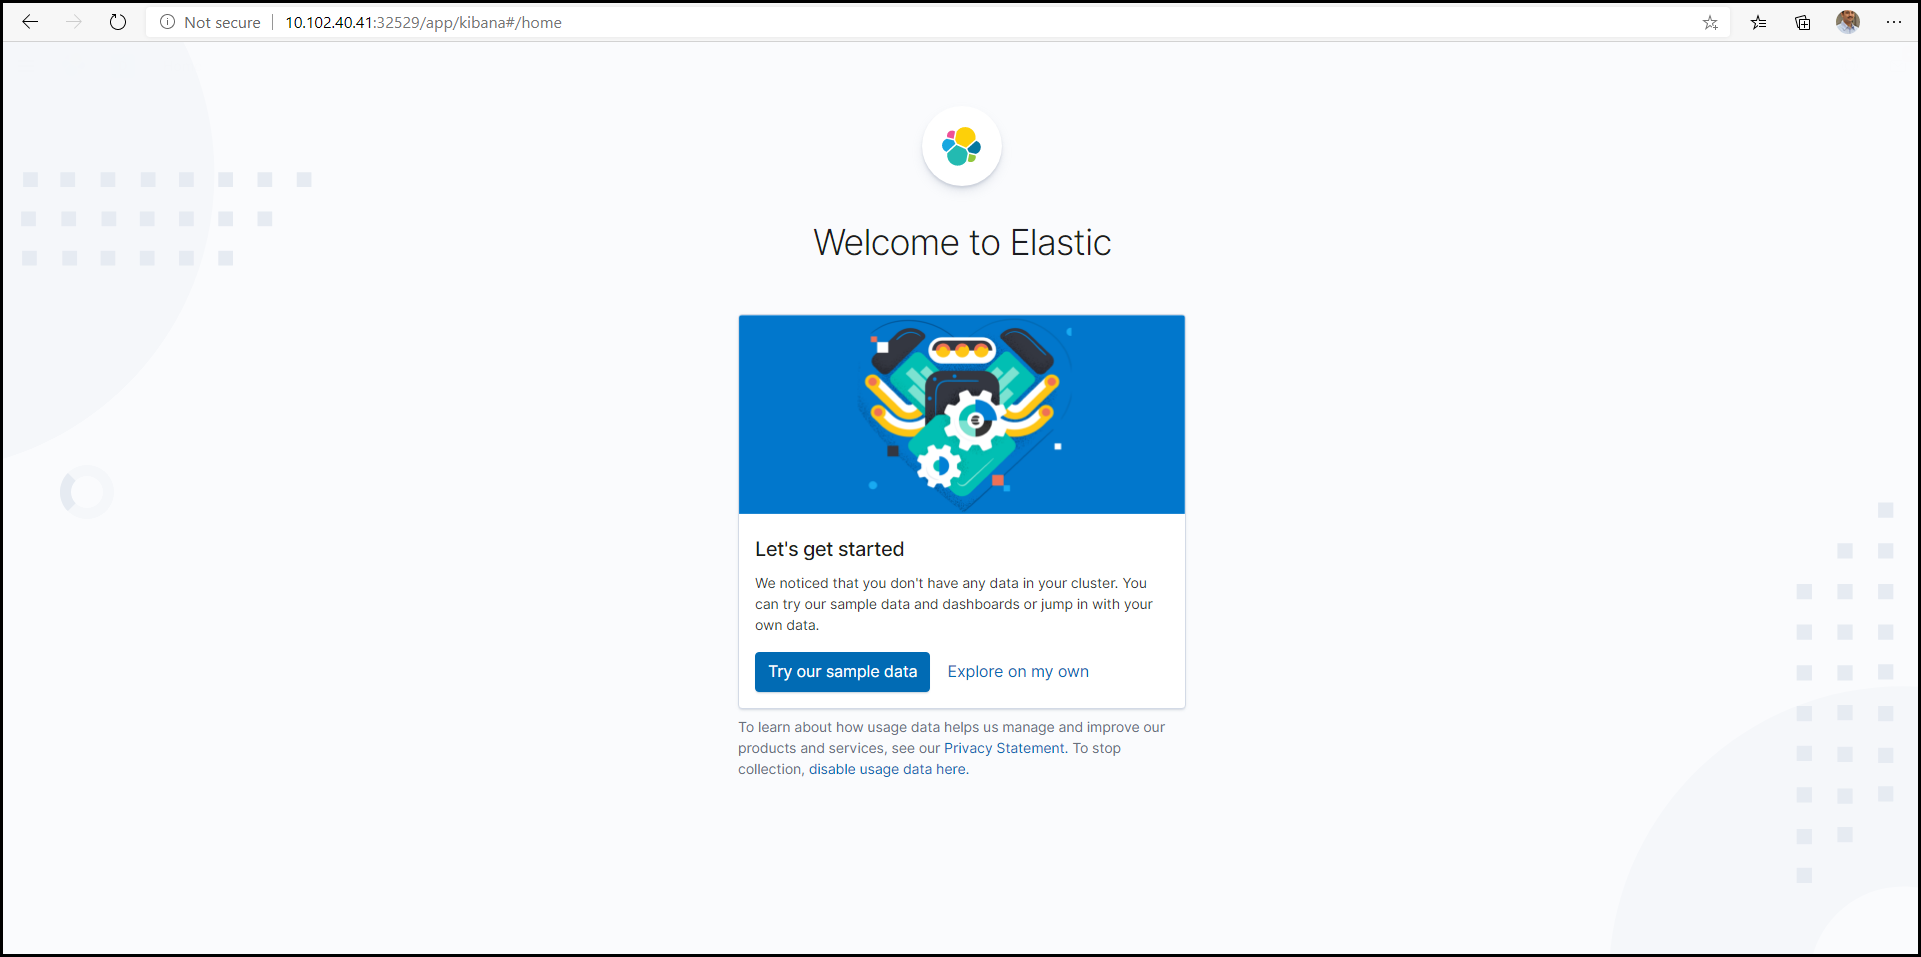
Access Kibana with a browser using the URL:
https://<kubernetes-node-IP>:<kibana nodeport>/.For example, from step 1, access http://10.102.40.41:32529/ in which,
10.102.40.41is one of the Kubernetes node IPs.-
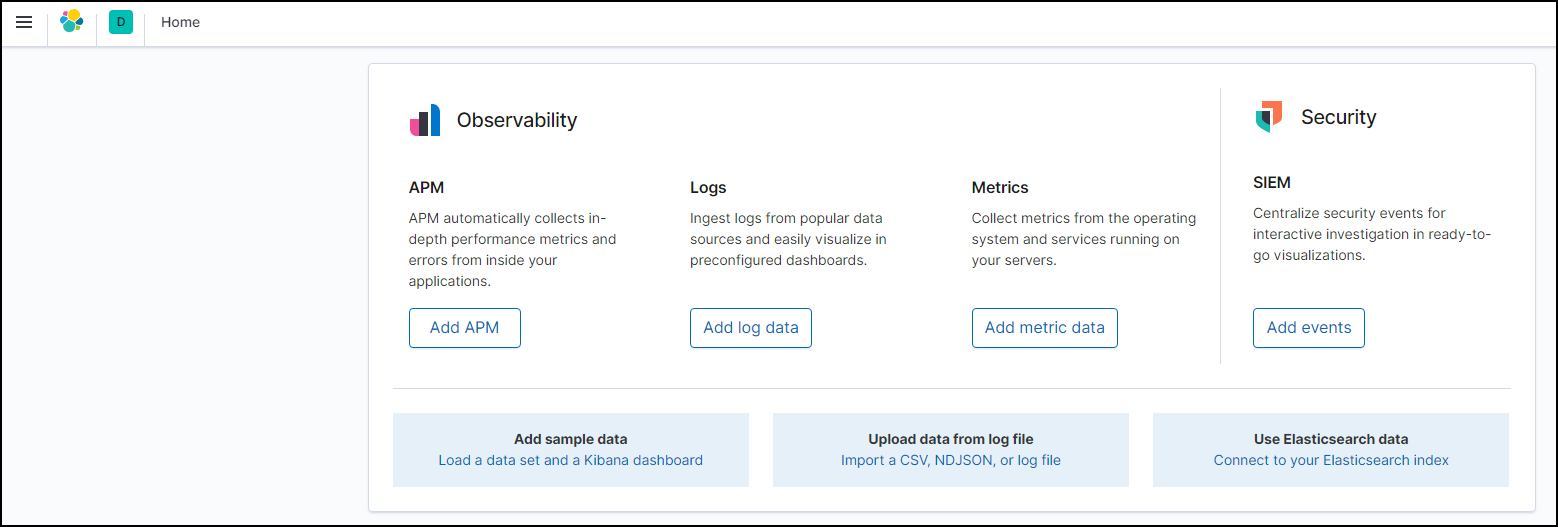
Click Explore on my own.
-
Click Connect to your Elasticsearch index.
-
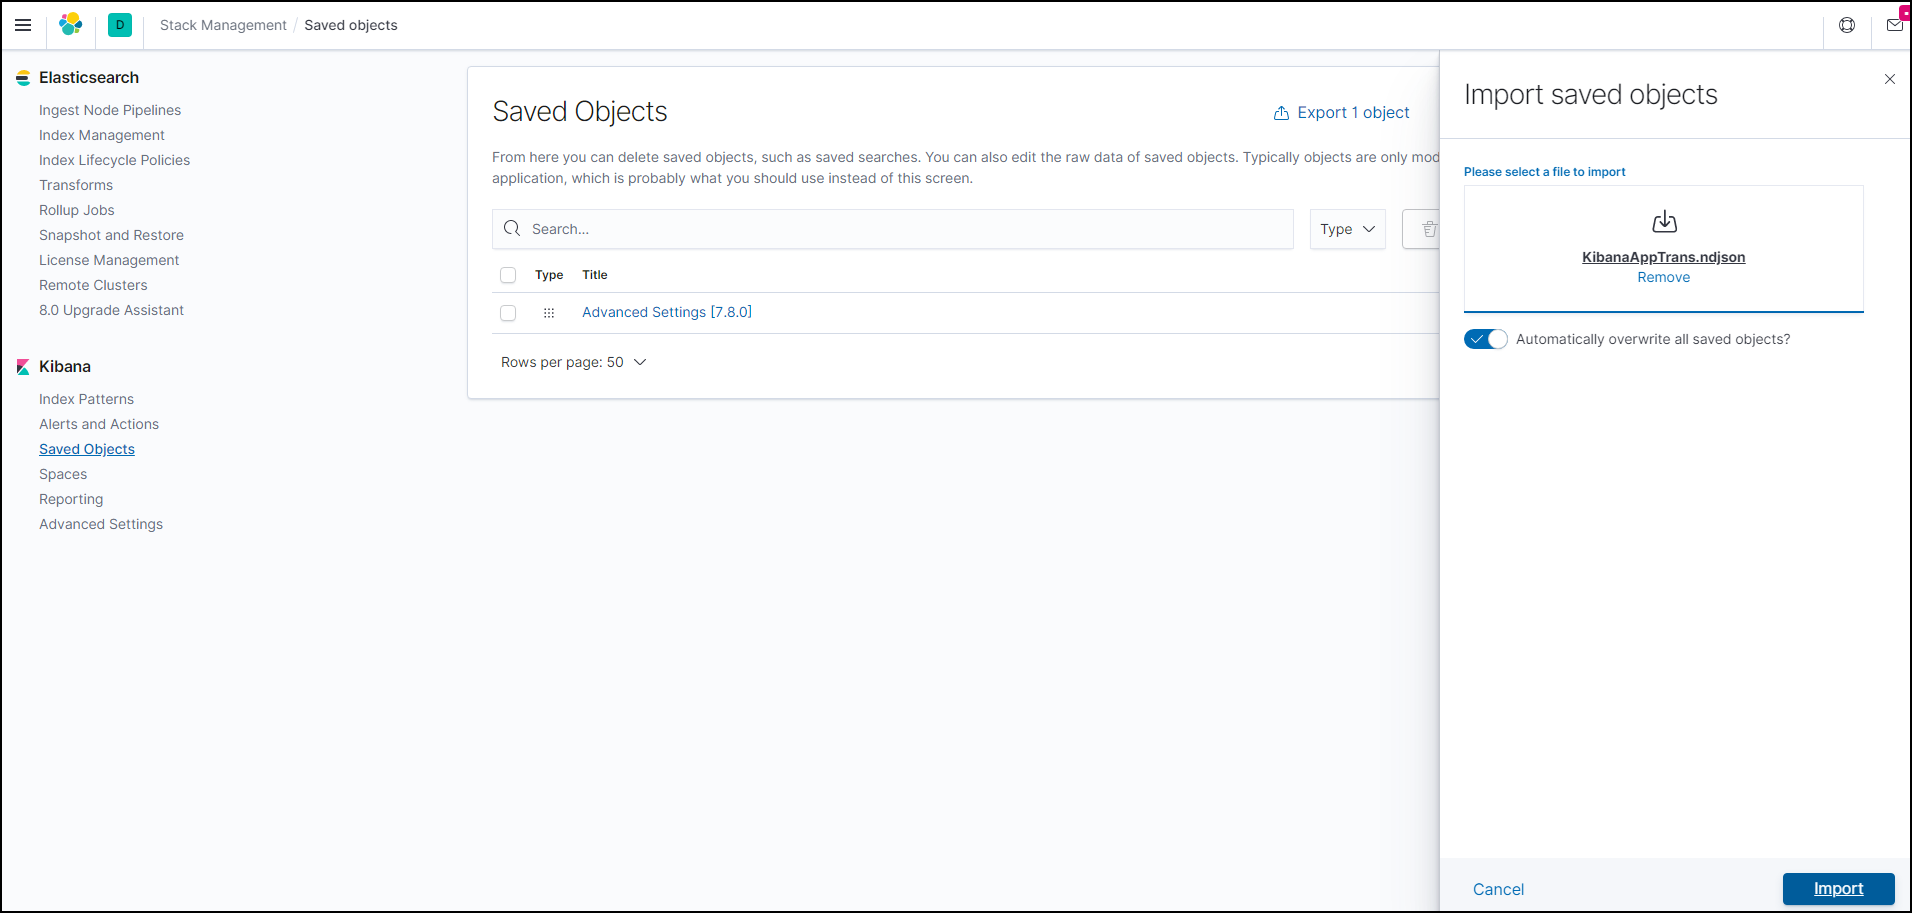
Click Saved Objects.
-
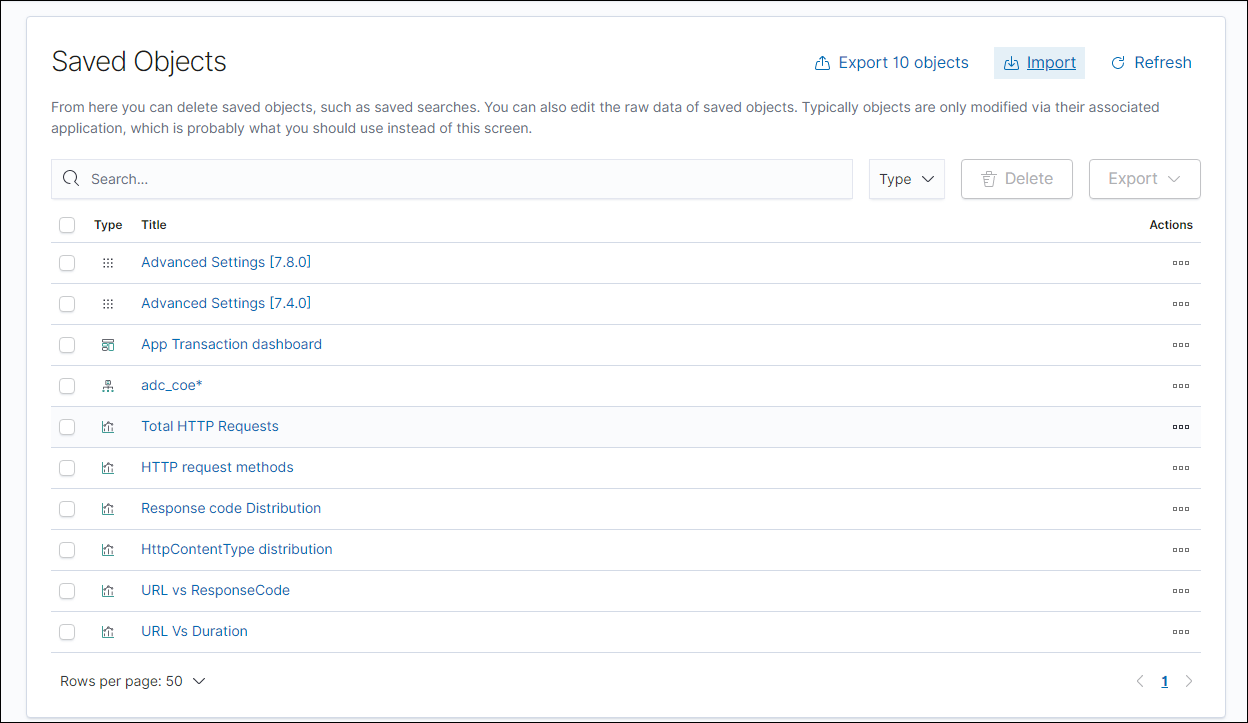
Download and import the Kibana Dashboard from KibanaAppTrans.ndjson.
-
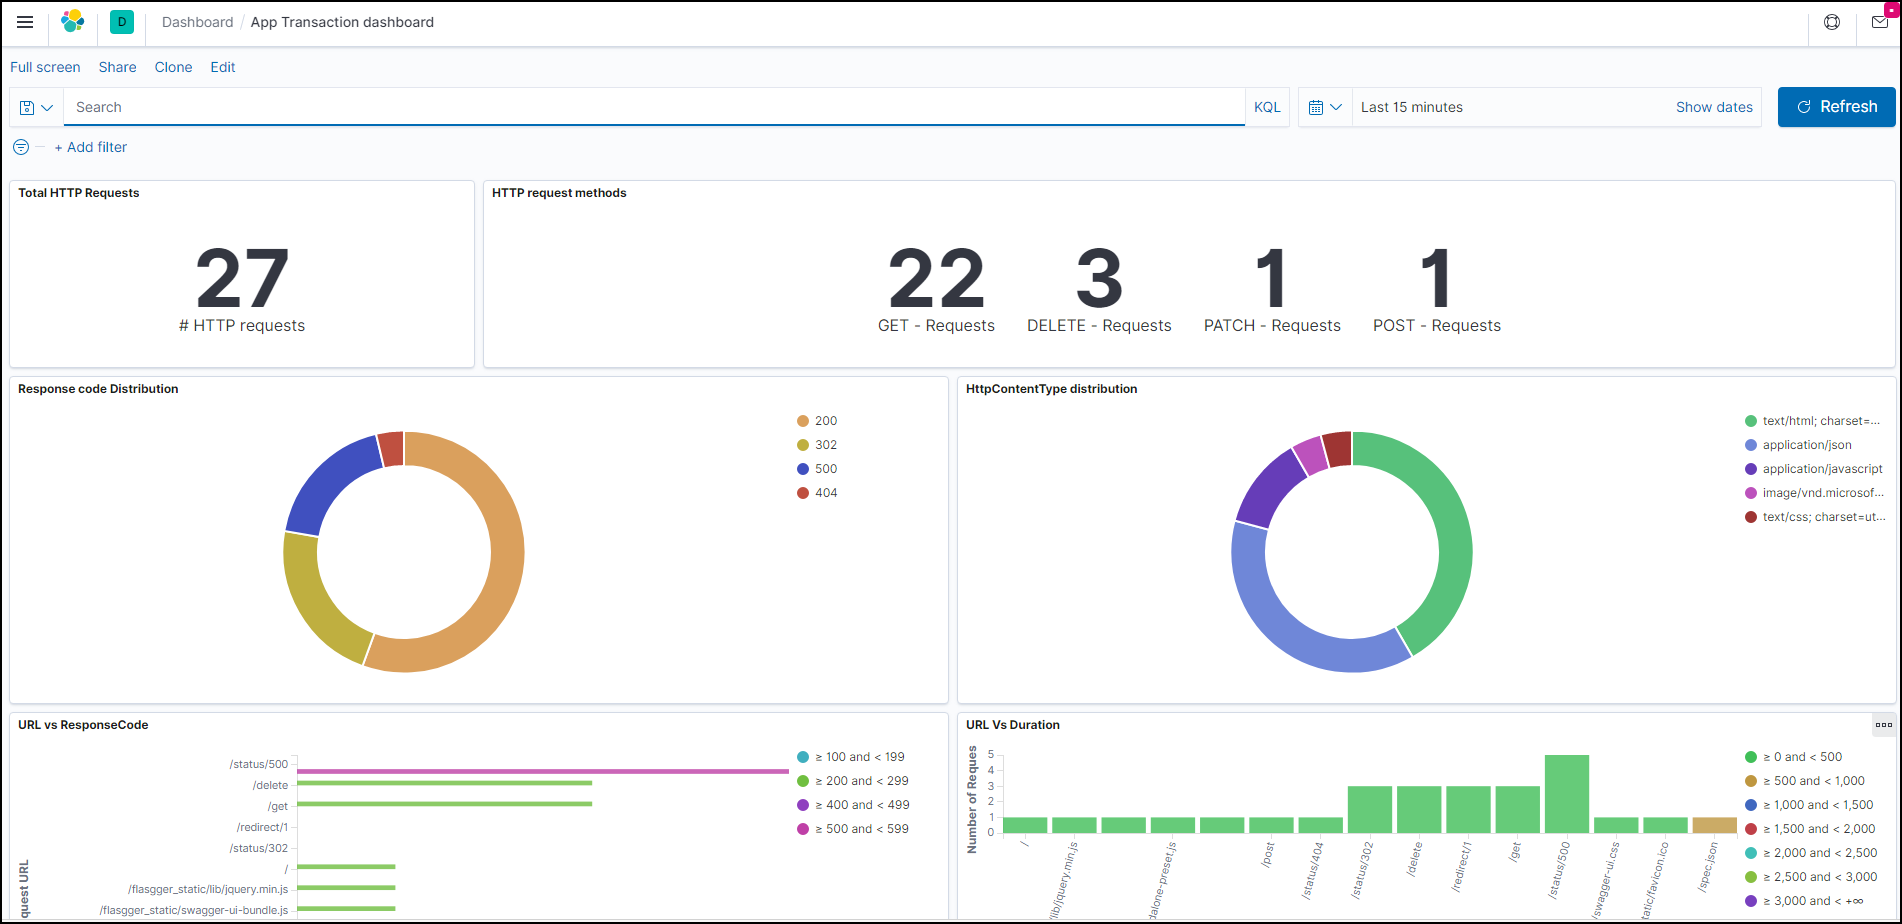
Click App Transaction dashboard.
The dashboard appears.

-
Integrate NetScaler with multiple NetScaler Observability Exporter instances manually
You can also configure NetScaler Observability Exporter manually. We recommend deploying NetScaler Observability Exporter in an automated way with the YAML file as described in the preceding sections. You can also perform manual configuration for NetScaler in the MPX and VPX form factors.
            enable feature appflow®
            enable ns mode ULFD
            add dns nameserver <KUBE-CoreDNS>
            add server COEsvr <FQDN/IP>
            add servicegroup COEsvcgrp LOGSTREAM  -autoScale™ DNS
            bind servicegroup COEsvcgrp COEsvr <PORT>
            add lb vserver COE LOGSTREAM 0.0.0.0 0
            bind lb vserver COE COEsvcgrp
            add analytics profile web_profile -collectors COE -type webinsight -httpURL ENABLED -httpHost ENABLED -httpMethod ENABLED -httpUserAgent ENABLED -httpContentType ENABLED
            add analytics profile tcp_profile -collectors COE -type tcpinsight
            bind lb vserver <WEB-VSERVER> -analyticsProfile web_profile
            bind lb vserver <WEB-VSERVER> -analyticsProfile tcp_profile

            # To enable metrics push to prometheus
            add service metrichost_SVC <IP> HTTP <PORT>
            set analyticsprofile ns_analytics_time_series_profile -collectors metrichost_SVC -metrics ENABLED -outputMode prometheus
Add NetScaler Observability Exporter using FQDN
            enable feature appflow
            enable ns mode ULFD
            add dns nameserver <KUBE-CoreDNS>
            add server COEsvr <FQDN>
            add servicegroup COEsvcgrp LOGSTREAM  -autoScale DNS
            bind servicegroup COEsvcgrp COEsvr <PORT>
            add lb vserver COE LOGSTREAM 0.0.0.0 0
            bind lb vserver COE COEsvcgrp
            add analytics profile web_profile -collectors COE -type webinsight -httpURL ENABLED -httpHost ENABLED -httpMethod ENABLED -httpUserAgent ENABLED -httpContentType ENABLED
            add analytics profile tcp_profile -collectors COE -type tcpinsight
            bind lb vserver <WEB-VSERVER> -analyticsProfile web_profile
            bind lb vserver <WEB-VSERVER> -analyticsProfile tcp_profile

            # To enable metrics push to prometheus
            add service metrichost_SVC <IP> HTTP <PORT>
            set analyticsprofile ns_analytics_time_series_profile -collectors metrichost_SVC -metrics ENABLED -outputMode prometheus
To verify if NetScaler sends application data logs to NetScaler Observability Exporter:
nsconmsg -g lstream_tot_trans_written -d current
The counter value indicates that the number of application transactions (for example, HTTP transactions) which have been sent to NetScaler Observability Exporter.

If the application traffic rate (for example, HTTP req/sec) that is sent to NetScaler Observability Exporter is not equal to lstream_tot_trans_written, you can verify the same using the following command:
nsconmsg -g nslstream_err_ulf_data_not_sendable -d current
The counter value indicates that NetScaler cannot send the data to NetScaler Observability Exporter due to network congestion, unavailability of network bandwidth, and so on. The data is stored in the available buffers.
Information about various transaction data and individual fields, and their datatype are available in the following location on the NetScaler:
shell/netscaler/appflow/ns_ipfix.yaml

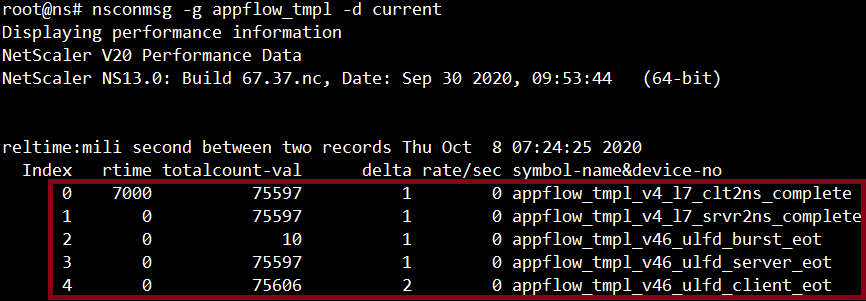
To verify that if application transaction records are exported from NetScaler to NetScaler Observability Exporter, use the following command:
nsconmsg -g appflow_tmpl -d current
Location of metrics data export logs to NetScaler for time series data:
/var/nslog/metrics_prom.log
To verify Elasticsearch related counters, run the following command:
      kubectl exec -it <cpx-pod-name> [-c <cpx-container-name>] [-n <namespace-name>] -- bash

      tail -f /var/ulflog/counters/lstrmd\_counters\_codes.log | grep -iE \"\(http\_reqs\_done|elk)\"
Find the logs in the following location to verify that the NetScaler Observability Exporter configuration is applied correctly:
vi /var/logproxy/lstreamd/conf/lstreamd.conf
If NetScaler Observability Exporter fails, you can collect logs and files available at the following location and contact NetScaler support.
      /var/crash/ (Loation of the coredump files, if any.)
      /var/ulflog/ (Location of the `libulfd` logs and counter details.)
      /var/log  (Location of the console logs, lstreamd logs and so on.)
For information on troubleshooting related to NetScaler Observability Exporter, see NetScaler CPX troubleshooting.
In this article
- Deploy NetScaler Observability Exporter
- Deploy NetScaler CPX with the NetScaler Observability Exporter support
- Deploy Elasticsearch and Kibana using YAML files
- Deploy NetScaler Observability Exporter using the YAML file
- Verify the NetScaler Observability Exporter deployment
- Integrate NetScaler with multiple NetScaler Observability Exporter instances manually