HDX™ report
Select one of the following report types from the drop-down list:
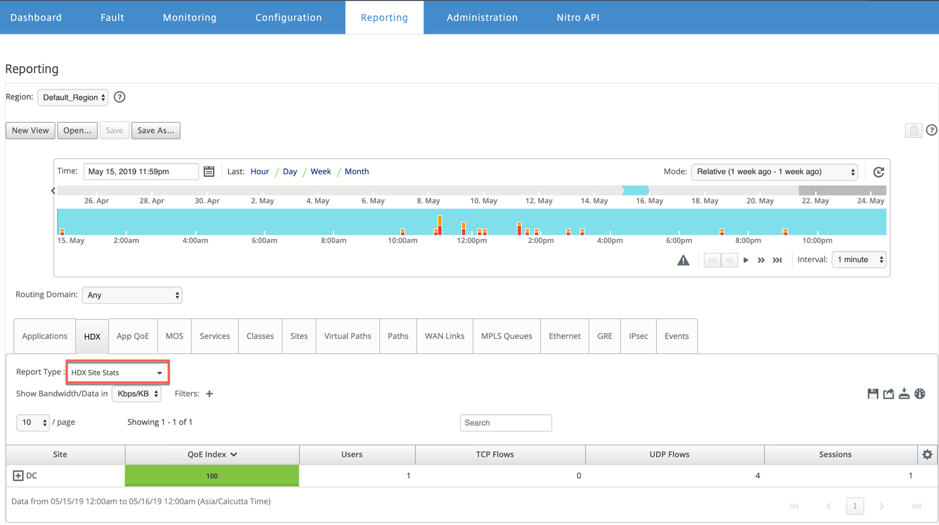
- HDX Site Stats
- HDX Summary (applicable for both HDX information channel available and unavailable sessions)
- HDX User Sessions (applicable for only HDX information channel available sessions only)
- HDX Apps (applicable for only HDX information channel available sessions only)
HDX site statistics
HDX report provides detailed HDX data per site. The data for each site is shown in two views.
Summary view
The Summary view shows the following data for a site:
- QoE Index - The Quality of Experience (QoE) is a numeric value between 0–100. The higher the value the better the user experience.
- Users – The number of active users on the site.
- TCP Flows - The number of active HDX sessions on the site that use the TCP protocol.
- UDP Flows – The number of active HDX sessions on the site that use the UDP protocol.
- Sessions – The total number of active HDX sessions on the site that includes both Small-Scale Integration (SSI) and Medium-Scale Integration (MSI) sessions.
Detail view
You can click an individual site to view details about all the variables affecting QoE. Each pair of row shows the QoE factors for data calculated at local and remote sides for a given virtual path.
Latency, jitter, and packet drop variables affecting QoE are the effective numbers that the Citrix SD-WAN™ appliance is measuring. For example, there might be larger percent of packet drop in the network, since Citrix SD-WAN corrects the packet drops through its own protocol, the effective packet loss seen by the application would be much lesser, hence improves the QoE for HDX applications.
Similarly, latency improvement through packet duplication also improves the QoE for HDX applications. In other words, Citrix SD-WAN improves the QoE for HDX traffic by improving the factors affecting the QoE. For more information see, HDX QoE.
To view HDX Reports:
In the Citrix SD-WAN Center, navigate to Reporting > HDX, and in the timeline control select a period.
You can select and view reports of a particular time frame by using the timeline controls. For more information, see, Timeline controls.
You can also create, save, and open report views. For more information, see, Manage views.

HDX summary
Select the HDX Summary report and the site from the drop-down list. The HDX summary report displays each user’s report that has logged in during the selected time period.

In the HDX summary report, you can view the following parameters:
- User: Name of the user.
- Client IP: Client IP address.
- SSI sessions: Number of active Single Stream ICA® (SSI) sessions.
- MSI sessions: Number of active Multi Stream ICA (MSI) sessions.
- Bytes from Client: Size in bytes from client.
- Bytes from Server: Size in bytes from server.
- HDX Channel Availability: Provides the HDX information channel availability status as Yes/No. If the channel is not available, then the user name shows as a hyphen (-).
HDX user sessions
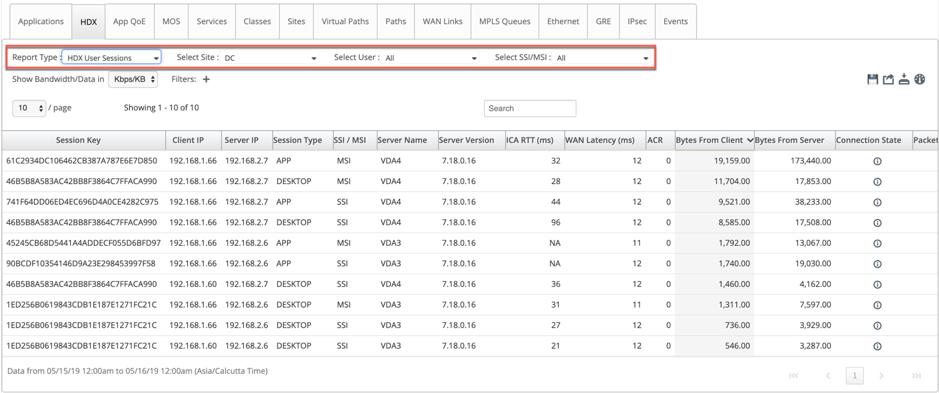
In the HDX user sessions report, you can see every sessions detail used by each user. Select the site, user, and SSI or MSI from the drop-down list. By default, the Select User and Select SSI/MSI fields shows ALL.

You can use the Search or Filter:+ options to find out the required session information as per your requirement.
- Session Key: The session key represents the unique identity for an ICA session.
- Client IP: Client IP address for each session.
- Server IP: Server IP address for each session.
- Session Type: Type of the sessions (Desktop, App).
- SSI/MSI: Shows whether it is an SSI or MSI session.
- Server Name: Shows the name of the server.
- Server Version: Shows the version of the server.
- ICA RTT (ms): Shows the ICA Round Trip Time (RTT) in milliseconds. This is an end-to-end round trip time between the client and the server.
- WAN Latency: Latency over the WAN, that is between the two SD-WANs over the virtual path. This latency doesn’t include client-side or server-side network latency.
- ACR: Shows the auto client reconnect counts.
- Bytes from Client: Size in bytes from client.
- Bytes from Server: Size in bytes from server.
-
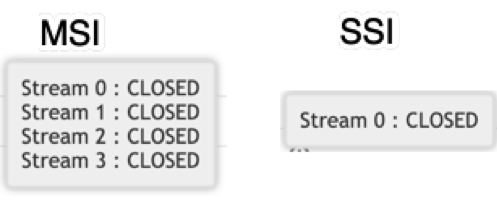
Connection State: Hover the mouse to see the connection state.
- For MSI, there are four connections. These connections are L4 level (TCP/UDP state).
-
For SSI, there is only one connection.

- Packet from Client: Number of packets from client.
- Packet from Server: Number of packets from server.
HDX apps
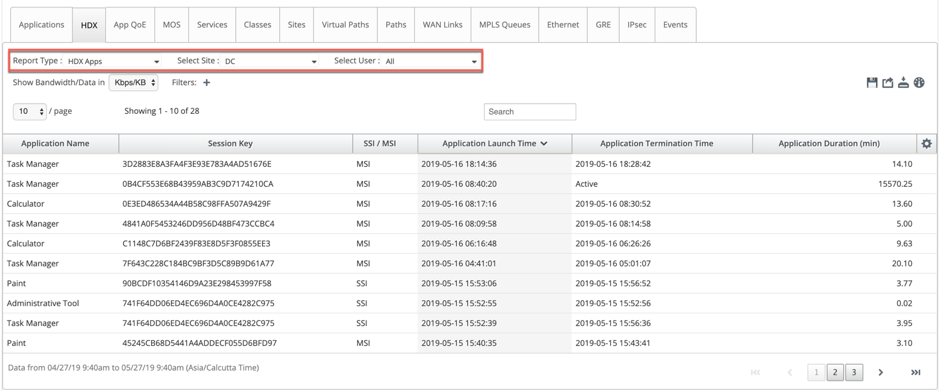
You can see all the application used by a specific user or by all users. Select the Site and the User to view the applications details.

- Application Name: Provides the name of the HDX application.
- Session Key: Provides the unique session key which is used for that particular application.
- SSI/MSI: Shows whether it is an SSI or MSI session.
- Application Launch Time: Provides the application launch time with date.
- Application Termination Time: Provides the application termination time with date. If an application is active, it shows active instead of the termination time.
- Application Duration (min): Provides the application time duration in minutes.
Note
- If there is any unintended error such as, if the HDX session information is unavailable on the appliance, then the HDX user-based reports are not shown even if the HDX User Reporting is enabled. Some of the fields such as user name, server name, server version, ICA RTT in the reports might be shown as NA.
- Application termination time in HDX Apps report is shown only if SD-WAN receives Application Termination Time from Xen Application/Xen Desktop Server. Otherwise, some of the applications are reported to be active even if closed.
- Due to the limitation from Citrix Virtual Apps and Desktops™ (formerly XenApp and XenDesktop), the Application Name shown in the HDX Apps report is limited to 19 characters only.