This content has been machine translated dynamically.
Dieser Inhalt ist eine maschinelle Übersetzung, die dynamisch erstellt wurde. (Haftungsausschluss)
Cet article a été traduit automatiquement de manière dynamique. (Clause de non responsabilité)
Este artículo lo ha traducido una máquina de forma dinámica. (Aviso legal)
此内容已经过机器动态翻译。 放弃
このコンテンツは動的に機械翻訳されています。免責事項
이 콘텐츠는 동적으로 기계 번역되었습니다. 책임 부인
Este texto foi traduzido automaticamente. (Aviso legal)
Questo contenuto è stato tradotto dinamicamente con traduzione automatica.(Esclusione di responsabilità))
This article has been machine translated.
Dieser Artikel wurde maschinell übersetzt. (Haftungsausschluss)
Ce article a été traduit automatiquement. (Clause de non responsabilité)
Este artículo ha sido traducido automáticamente. (Aviso legal)
この記事は機械翻訳されています.免責事項
이 기사는 기계 번역되었습니다.책임 부인
Este artigo foi traduzido automaticamente.(Aviso legal)
这篇文章已经过机器翻译.放弃
Questo articolo è stato tradotto automaticamente.(Esclusione di responsabilità))
Translation failed!
Diagnostics
This section provides diagnostic tools to identify network issues in your SD-WAN WANOP network and troubleshoot them. You can also obtain system log files, system information, and other necessary details that assist the Citrix SD-WAN Support team in diagnosing and resolving network issues.
Following are the Diagnostics tool available in SD-WAN WANOP:
- Tracing
- Packet Analyzer
- Bypass Card Test
- Retrieve Course
- Line Tester
- Ping
- Traceroute
- System Info
- Diagnostic Data
Tracing
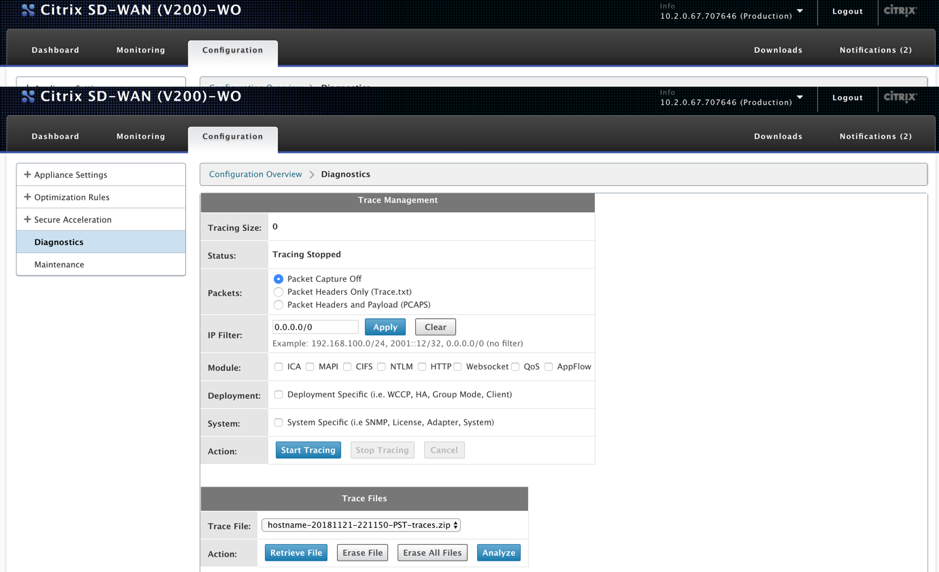
The Tracing tool is used to watch the packets flowing over the SD-WAN WANOP network. It can open each packet and identify the protocol used, the IP address of the source and destination, and other payload information. This information is used by Citrix Support team to find the root cause of network issues.
You can choose to trace Packet Headers Only or Packet Headers and Payload. You can choose the module to trace and specify if the tracing should be deployment specific or system specific.
Click Start Tracing, the appliance begins to trace the packets. The results are packaged into a ZIP archive when you click Stop Tracing. This archive can be downloaded onto your computer, using the Retrieve File option. You can then forward these files to the Support team. The trace files also provide crash analysis data.
Click Analyze to view more information about the packets in Packet Analyzer tab.
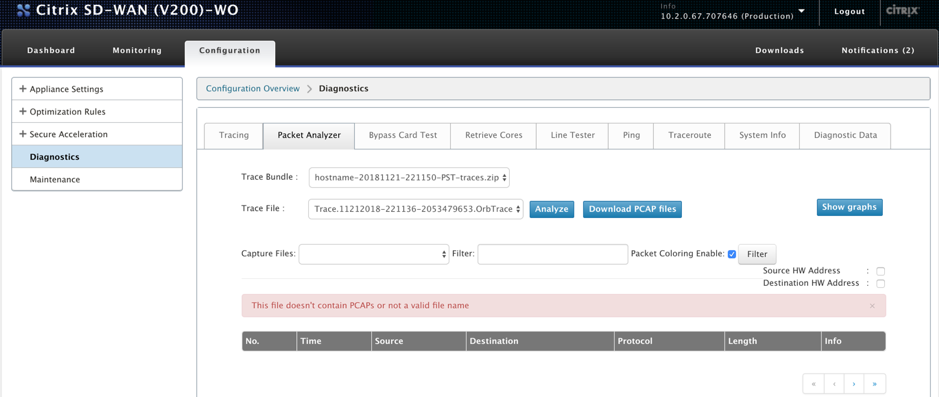
You can view the time, source address, destination address, protocol, length, and payload information.
Bypass card test
You can test the fail-to-wire functionality of Ethernet interface for an appliance deployment in inline (Fail-to-wire) mode. Enter the number of seconds for the appliance to stay in bypass mode and click Start Test. During this period, the appliance is bypassed. Normal operation will resume after that.

Retrieve cores
Core files are created when the SD-WAN WANOP appliance exits abnormally or crashes. The appliance restarts automatically after a crash. In case of persistent crashes, acceleration is disabled but the management interface remains active.
You can select and retrieve the required core files that were created during the appliance crash or when the appliance behaved abnormally. The retrieved files are saved in a ZIP archive. You can share this with the support team for further analysis.

Line tester
The Line Test: SERVER function starts an iperf server on the appliance, running in TCP mode. This option can be used to verify connectivity between WANOP appliances and troubleshooting network traffic. To run iperf tests, one system (an appliance or another host) must run iperf as a server, and another must connect to it as a client.
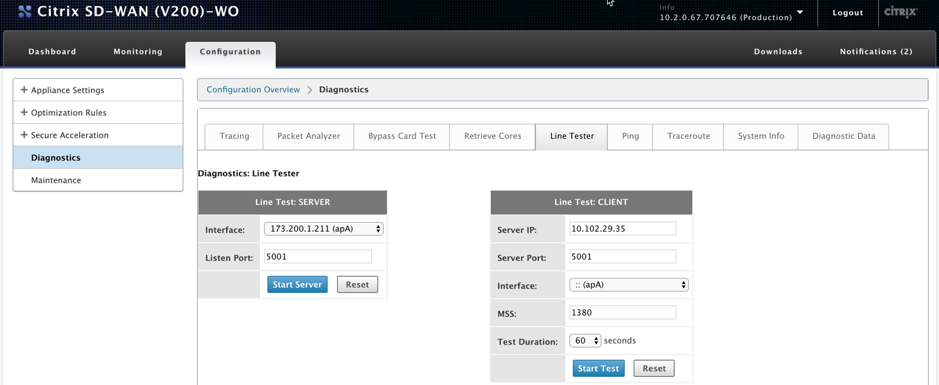
You can use the default Line Tester Server interface and port number. Click Start Server to start an iperf server on the appliance.

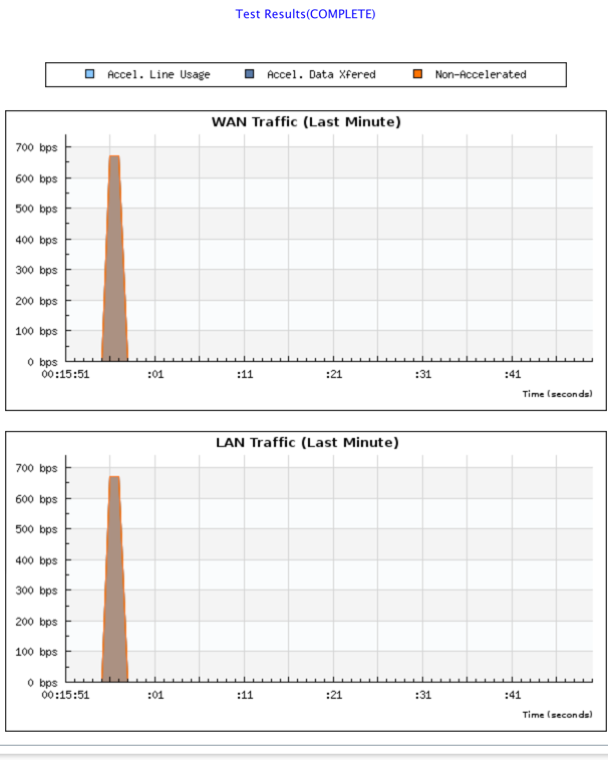
The Line Test: CLIENT function starts an iperf client on the unit, running in TCP mode. You can also specify the iperf server port number and the length of the test. When the test is complete, the connection speed will be reported. Click Start Test to see the WAN and LAN traffic result.
Ping
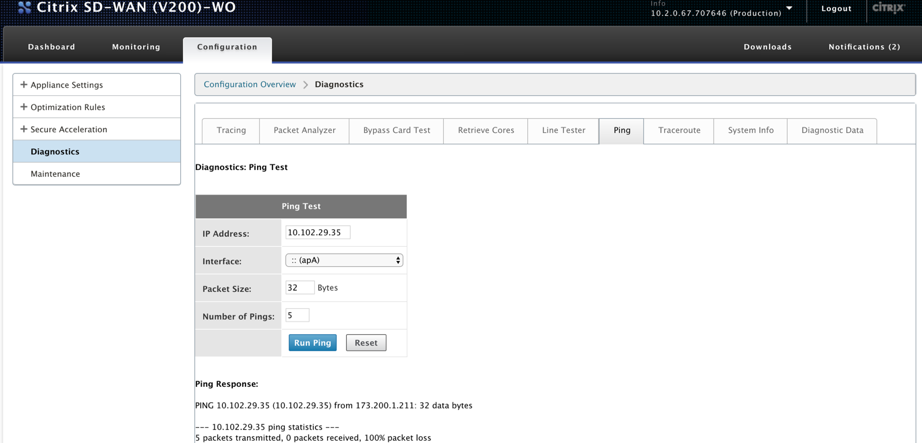
Ping allows you to check connectivity of the network elements in your SD-WAN network. Enter the IP address of the network element and click Run Ping to see the result.
Traceroute
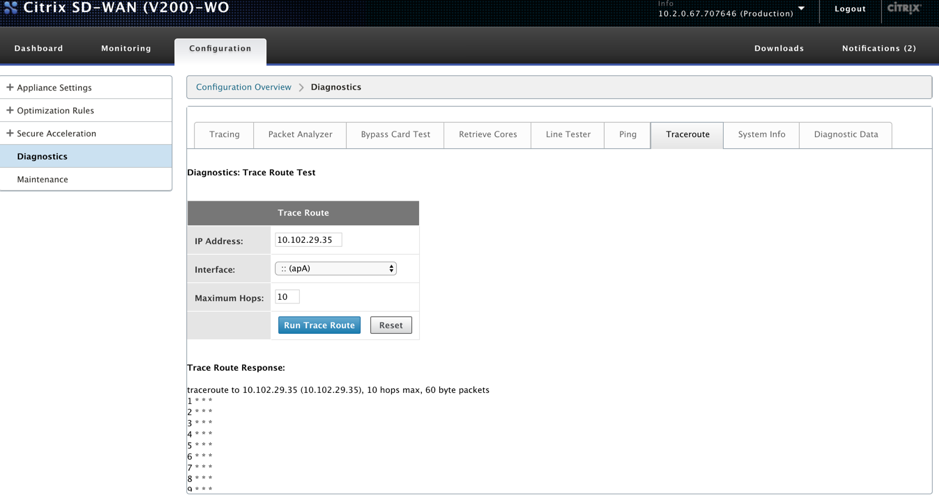
Traceroute allows you to record the route between your SD-WAN appliance and any other network element in your SD-WAN network or on the internet. It calculates and displays the amount of time each hop took.
System info
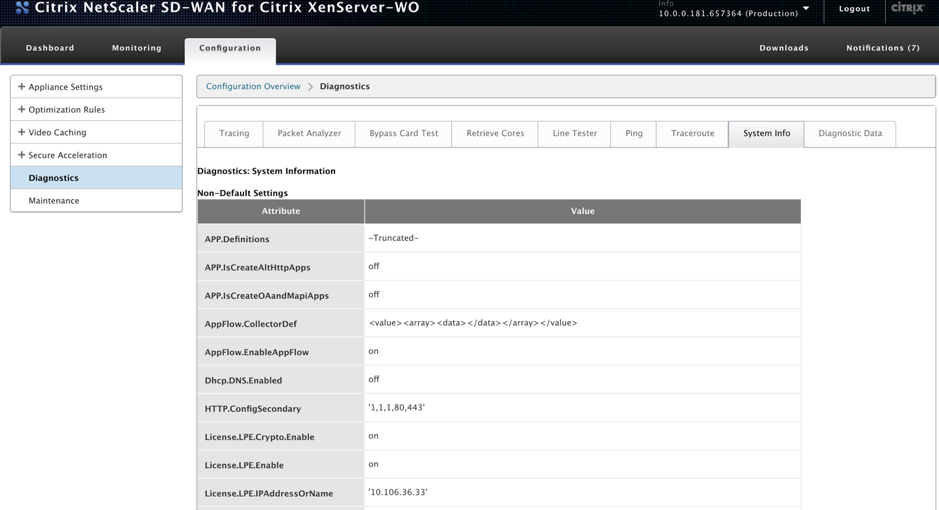
The System Info lists all the parameters that are not set to their defaults. This information is read-only. It is used by Support when some kind of misconfiguration is suspected. When you report a problem, you may be asked to check one or more values on this page.
It provides Non-Default Settings, Detailed Information For Adapter Primary, Detailed Information For Adapter apA.2, and Detailed Information For Adapter apA.1.
Diagnostic Data
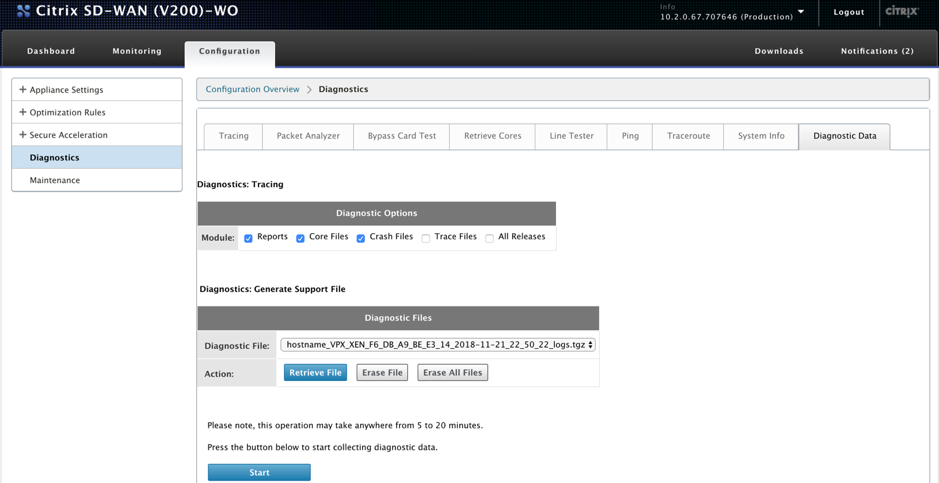
Diagnostic Data allows you to package diagnostic data for analysis by the Citrix Support team. Select the diagnostic files required and click Start. You can then, click Retrieve File to download the zip archive, and share it with Citrix Support.
Share
Share
This Preview product documentation is Cloud Software Group Confidential.
You agree to hold this documentation confidential pursuant to the terms of your Cloud Software Group Beta/Tech Preview Agreement.
The development, release and timing of any features or functionality described in the Preview documentation remains at our sole discretion and are subject to change without notice or consultation.
The documentation is for informational purposes only and is not a commitment, promise or legal obligation to deliver any material, code or functionality and should not be relied upon in making Cloud Software Group product purchase decisions.
If you do not agree, select I DO NOT AGREE to exit.