Compression
Citrix SD-WAN WANOP compression uses breakthrough technology to provide transparent multilevel compression. It is true compression that acts on arbitrary byte streams. It is not application-aware, is indifferent to connection boundaries, and can compress a string optimally the second time it appears in the data. Citrix SD-WAN WANOP compression works at any link speed.
The compression engine is very fast, allowing the speedup factor for compression to approach the compression ratio. For example, a bulk transfer monopolizing a 1.5 Mbps T1 link and achieving a 100:1 compression ratio can deliver a speedup ratio of almost 100x, or 150 Mbps, provided that the WAN bandwidth is the only bottleneck in the transfer.
Unlike with most compression methods, Citrix SD-WAN WANOP compression history is shared between all connections that pass between the same two appliances. Data sent hours, days, or even weeks earlier by connection A can be referred to later by connection B, and receive the full speedup benefit of compression. The resulting performance is much higher than can be achieved by conventional methods.
Compression can use the appliance’s disk as well as memory, providing up to terabytes of compression history.
How compression works
All compression algorithms scan the data to be compressed, searching for strings of data that match strings that have been sent before. If no such matches are found, the literal data is sent. If a match is found, the matching data is replaced with a pointer to the previous occurrence. In a very large matching string, megabytes or even gigabytes of data can be represented by a pointer containing only a few bytes, and only those few bytes need be sent over the link.
Compression engines are limited by the size of their compression history. Traditional compression algorithms, such as LZS and ZLIB, use compression histories of 64 KB or less. Citrix SD-WAN WANOP appliances maintain at least 100 GB of compression history. With more than a million times the compression history of traditional algorithms, the Citrix SD-WAN WANOP algorithm finds more matches and longer matches, resulting in superior compression ratios.
The Citrix SD-WAN WANOP compression algorithm is very fast, so that even the entry-level appliances can saturate a 100 Mbps LAN with the output of the compressor. The highest-performance models can deliver well over 1 Gbps of throughput.
Only payload data is compressed. However, headers are compressed indirectly. For example, if a connection achieves 4:1 compression, only one full-sized output packet is sent for every four full-sized input packets. Thus, the amount of header data is also reduced by 4:1.
Compression as a general-purpose optimization:
Citrix SD-WAN WANOP compression is application-independent: it can compress data from any non-encrypted TCP connection.
Unlike caching, compression performance is robust in the face of changing data. With caching, changing a single byte of a file invalidates the entire copy in the cache. With compression, changing a single byte in the middle of a file just creates two large matches separated by a single byte of nonmatching data, and the resulting transfer time is only slightly greater than before. Therefore, the compression ratio degrades gracefully with the amount of change. If you download a file, change 1% of it, and upload it again, expect a 99:1 compression ratio on the upload.
Another advantage of a large compression history is that precompressed data compresses easily with Citrix SD-WAN WANOP technology. A JPEG image or a YouTube video, for example, is precompressed, leaving little possibility for additional compression the first time it is sent over the link. But whenever it is sent again, the entire transfer is reduced to just a handful of bytes, even if it is sent by different users or with different protocols, such as by FTP the first time and HTTP the next.
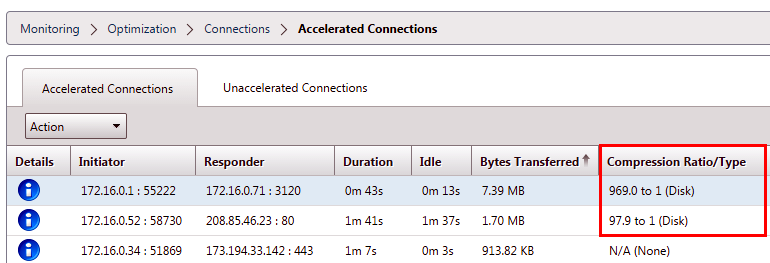
In practice, compression performance depends on how much of the data traversing the link is the same as data that has previously traversed the link. The amount varies from application to application, from day to day, and even from moment to moment. When looking at a list of active accelerated connections, expect to see ratios anywhere from 1:1 to 10,000:1.
Compress encrypted protocols:
Many connections showing poor compression performance do so because they are encrypted. Encrypted traffic is normally uncompressible, but Citrix SD-WAN WANOP appliances can compress encrypted connections when the appliances join the security infrastructure. Citrix SD-WAN WANOP appliances join the security infrastructure automatically with Citrix Citrix Virtual Apps and Desktops, and can join the security infrastructure of SSL, Windows file system (CIFS/SMB), and Outlook/Exchange (MAPI) servers with manual configuration.
Adaptive, zero-config operation:
To serve the different needs of different kinds of traffic, Citrix SD-WAN WANOP appliances use not one but five compression engines, so the needs of everything from the most massive bulk transfer to the most latency-sensitive interactive traffic can be accommodated with ease. The compression engine is matched dynamically to the changing needs of individual connections, so that compression is automatically optimized. An added benefit is that the compression engine requires no configuration.
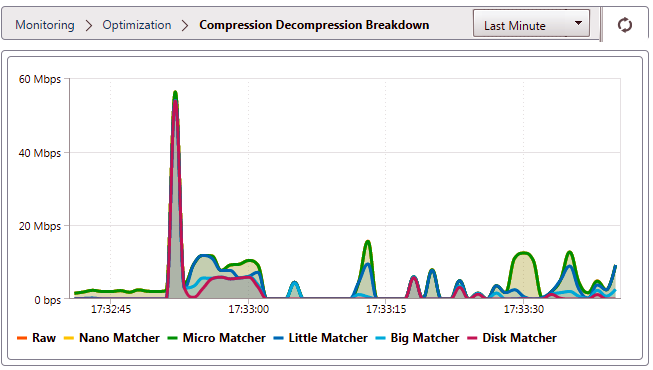
Memory based compression
Most of the compression engines use RAM to store their compression history. This is called memory-based compression. Some appliances devote gigabytes of memory to these compression engines. Memory-based compression has a low latency and is often chosen automatically for interactive tasks such as Virtual Apps/Virtual Desktops traffic.
Disk based compression
The disk-based compression engine uses anywhere between tens of gigabytes and terabytes of memory to store compression history, allowing more and better compression matches. The disk-based compression engine is very fast but sometimes has a higher latency than the memory-based engines, and is often chosen automatically for bulk transfers.
Enable or disable compression
Compression is enabled, on a per-service-class basis, on the Configuration: Service Classes page. This page has a pull-down menu for each service class, with the following options:
-
Disk, meaning that both disk based and memory based compression are enabled. This option should be selected unless you have a specific reason for disabling it.
-
Memory, meaning that memory based compression is enabled but disk based compression is not. This setting is rarely used, because the appliance automatically selects memory or disk if both types of compression are enabled.
-
Flow-Control Only, which disables compression but enables flow-control acceleration. Select this option for services that are always encrypted, and for the FTP control channel.
-
None, meaning that compression and flow-control are both disabled.
For more information, see Service Classes.
Measure disk based compresssion performance
The Compression Status tab of the Reports: Compression page reports the system compression performance since the system was started or since the Clear button was used to reset the statistics. Compression for individual connections is reported in the connection closure messages in the system log.
Compression performance varies with a number of factors, including the amount of redundancy in the data stream and, to a lesser extent, the structure of the data protocol.
Some applications, such as FTP, send pure data streams; the TCP connection payload is always byte-for-byte identical to the original data file. Others, such as CIFS or NFS, do not send pure data streams, but mix commands, metadata, and data in the same stream. The compression engine distinguishes the file data by parsing the connection payload in real time. Such data streams can easily produce compression ratios between 100:1 and 10,000:1 on the second pass.
Average compression ratios for the link depend on the relative prevalence of long matches, short matches, and no matches. This ratio is dependent on the traffic and is difficult to predict in practice.
Test results show the effect of multi-level compression as a whole, with memory based and disk based compression each making its contribution.
Maximum compression performance is not achieved until the storage space available for disk based compression is filled, providing a maximum amount of previous data to match with new data. In a perfect world, testing would not conclude until the appliance’s disks had not only been filled, but filled and overwritten at least once, to ensure that steady-state operation has been reached. However, few administrators have that much representative data at their disposal.
Another difficulty in performance testing is that acceleration often exposes weak links in the network, typically in the performance of the client, the server, or the LAN, and these are sometimes misdiagnosed as disappointing acceleration performance.
You can use Iperf or FTP for preliminary and initial testing. Iperf is useful for preliminary testing. It is extremely compressible (even on the first pass) and uses relatively little CPU and no disk resources on the two endpoint systems. Compressed performance with Iperf should send more than 200 Mbps over a T1 link if the LANs on both sides use Gigabit Ethernet, or slightly less than 100 Mbps if there is any Fast Ethernet equipment in the LAN paths between endpoints and appliances.
Iperf is preinstalled on the appliances (under the Diagnostics menu) and is available from http://iperf.sourceforge.net/. Ideally, it should be installed and run from the endpoint systems, so that the network is tested from end to end, not just from appliance to appliance.
FTP is useful for more realistic testing than is possible with Iperf. FTP is simple and familiar, and its results are easy to interpret. Second-pass performance should be roughly the same as with Iperf. If not, the limiting factor is probably the disk subsystem on one of the endpoint systems.
To test the disk based compression system:
-
Transfer a multiple-gigabyte data stream between two appliances with disk based compression enabled. Note the compression achieved during this transfer. Depending on the nature of the data, considerable compression may be seen on the first pass.
-
Transfer the same data stream a second time and note the effect on compression.
Compression reports in premium edition
Citrix SD-WAN Premium (Enterprise) edition does not have a view for showing compression reports on a per protocol or application basis through WANOP service classes, which have the protocol or application association. If you are using a Premium (Enterprise) edition appliance then the only report available for compression is a connection level compression report which does not give visibility into the extent to which a protocol has been optimized or compressed. Compression reports are available in the WAN Optimization GUI which displays a break-up of all unique protocols and how reports have been optimized over a period of time.
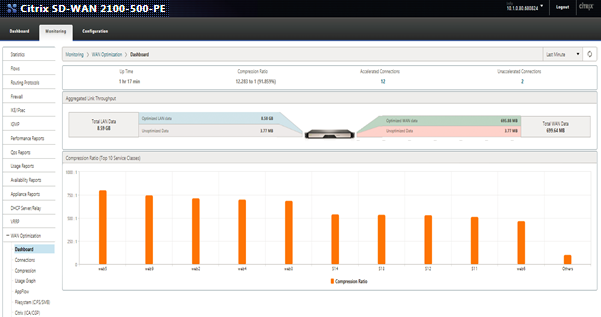
In the Citrix SD-WAN Premium (Enterprise) Edition appliance GUI, for WAN Optimization, the following widgets have been added under the WAN Optimization Dashboard.
-
Consolidated compression ratio – all traffic passing through WANOP appliance and total number of accelerated and un-accelerated connections. This allows you to monitor total traffic transmitted from LAN to WAN.
-
Compression Ratio - top 10 Service Classes.
-
Aggregated Link Throughput – LAN and WAN.
Consolidated compression ratio:
This report displays consolidated compression ratio for all traffic transmitted to WANOP and total number of accelerated and un-accelerated connections. It also shows the up-time of the WANOP service in the appliance.

Aggregated link throughput:
This report displays the total traffic that is transmitted to WANOP and the total traffic that transmits out with break-ups in categories of optimized and unoptimized data on both ends.

Compression ratio (Top 10 service classes):
In the Citrix SD-WAN appliance GUI, you can check the connection details and the compression ratio (per service-class dashboard) by navigating to Monitoring > WAN Optimization. This auto selects the Dashboard node and provides an overview in the form of dashboard.
The graph displays the top 10 values of compression ratio for traffic categorised by service classes.
An extra “others” bar is displayed, which shows the compression ratio for all the other accelerated connections that are part of the system in addition to the Top 10 service classes compression ratio reports.