Server response time
Application slowness is a major concern for any organization because it results in business impact or productivity. As an administrator, you must ensure that all applications perform optimally to avoid any business impact.
Each application behaves different and has different response time expectations. When you have a large server farm, it becomes a time-consuming task for administrators to assess each application and set thresholds for server response time.
The Server Response Time indicator helps administrators assess every application based on the machine learning algorithm. This indicator reports:
-
Abnormal high response time
-
Abnormal low response time
View anomalies for server response
To view anomalies for server response:
-
Navigate to Application > Dashboard
-
Double-click the application
-
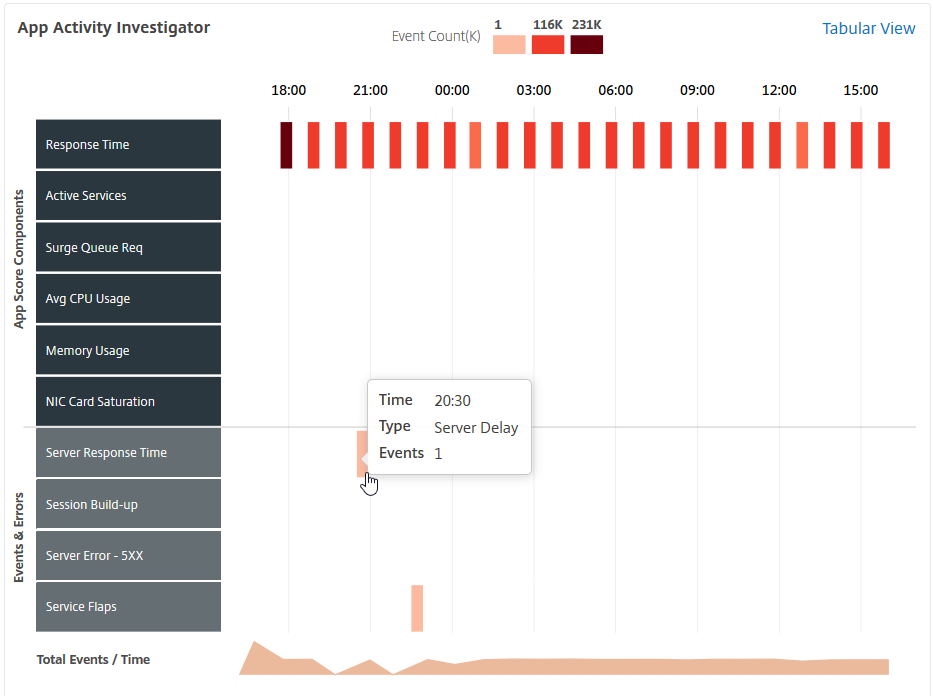
In the App Activity Investigator, click the event legend plotted for Server Response Time on the graph.
You can hover your mouse pointer on the graph to view details such as error type, time, and the number of events aggregated for the selected graph. You can customize the time period to view anomalies by selecting the time from time-period list.

The Server Response Time page is displayed.
-
Click
 to expand for anomaly details.
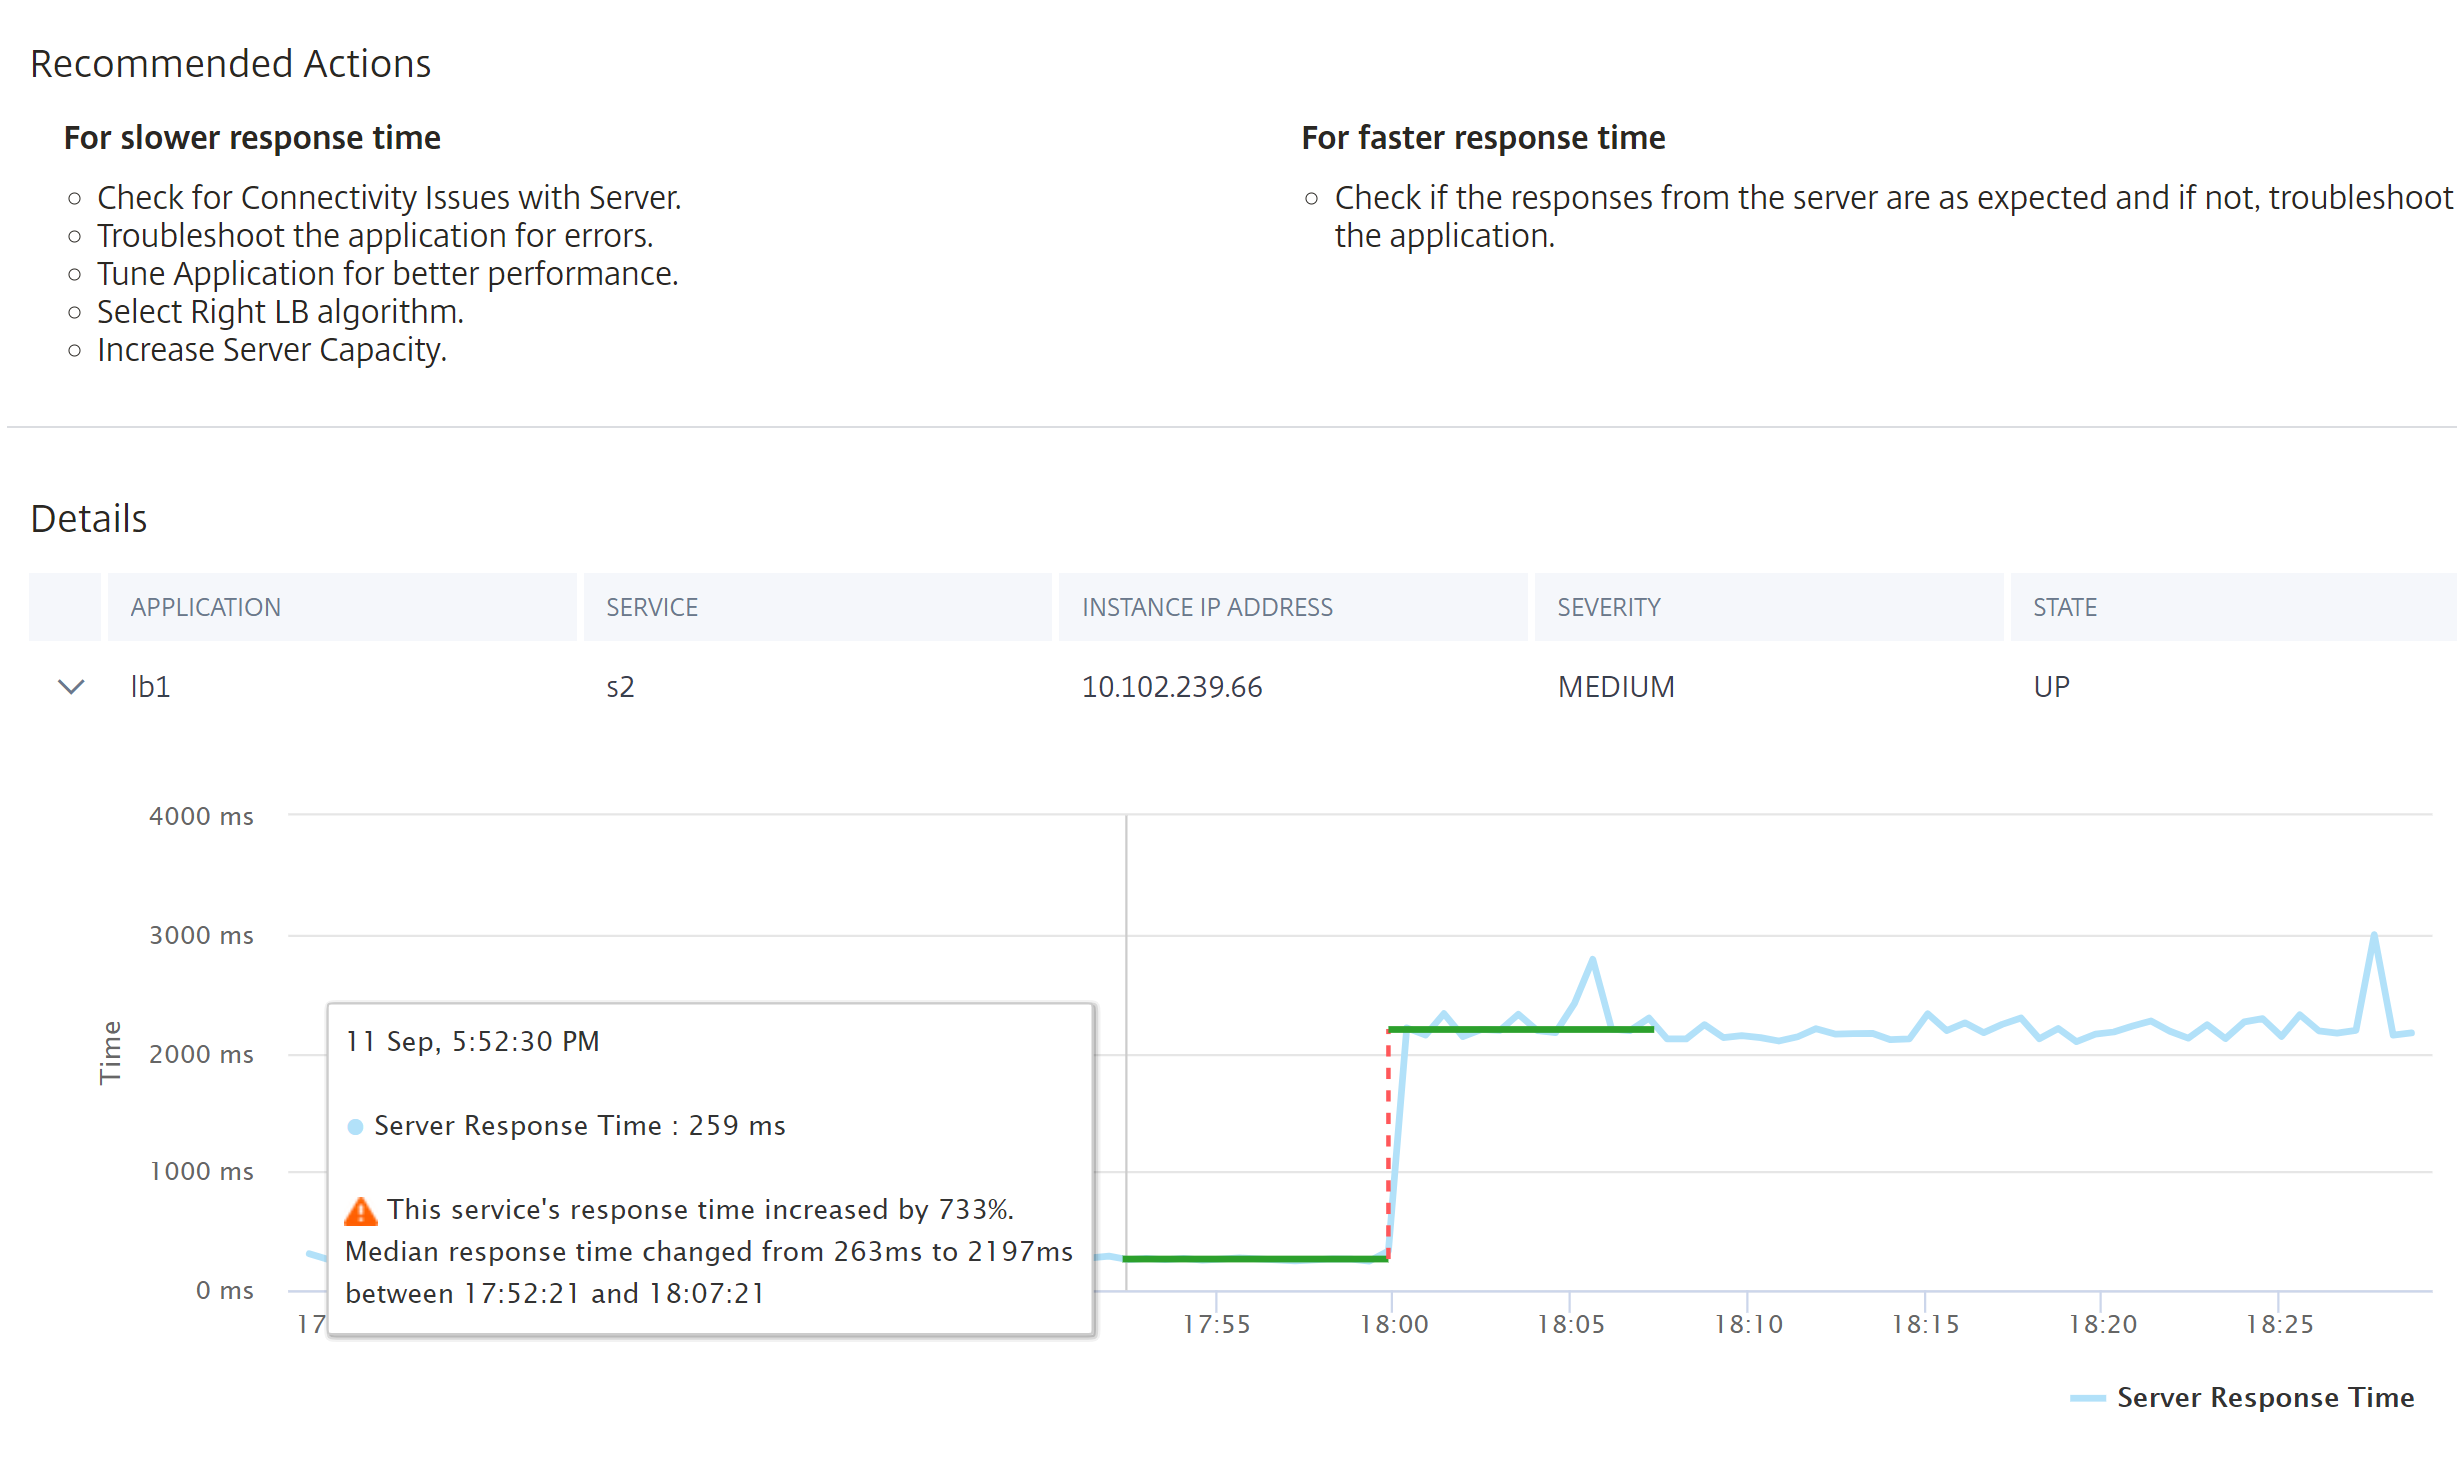
Under Details, you can view:
-
The application that has the anomaly
-
The service that is bound to the application
-
The NetScaler instance IP address
-
The severity type of the anomaly
-
The status of the application
-
The server response time graph for the selected time period
-
Rolling median graph based on the server response time
-
Anomaly details
NetScaler Console detects anomalies for abnormal high response time and for abnormal low response time.
-
Anomaly for abnormal high server response time

NetScaler Console compares the average server response time for a specific duration. According to the example shown in the image, NetScaler Console compares the average server response time between 17:50 and 18:20.
When the server response time begins to increase, NetScaler Console further monitors the server response time for another specific duration and then detects anomaly for the time when the server response time has started to increase.
According to the example shown in the image, you can see an anomaly was detected, mentioning that the server response time is increased by 733%, after comparing the average server response time between 17:52 and 18:07.
-
Anomaly for abnormal low server response time

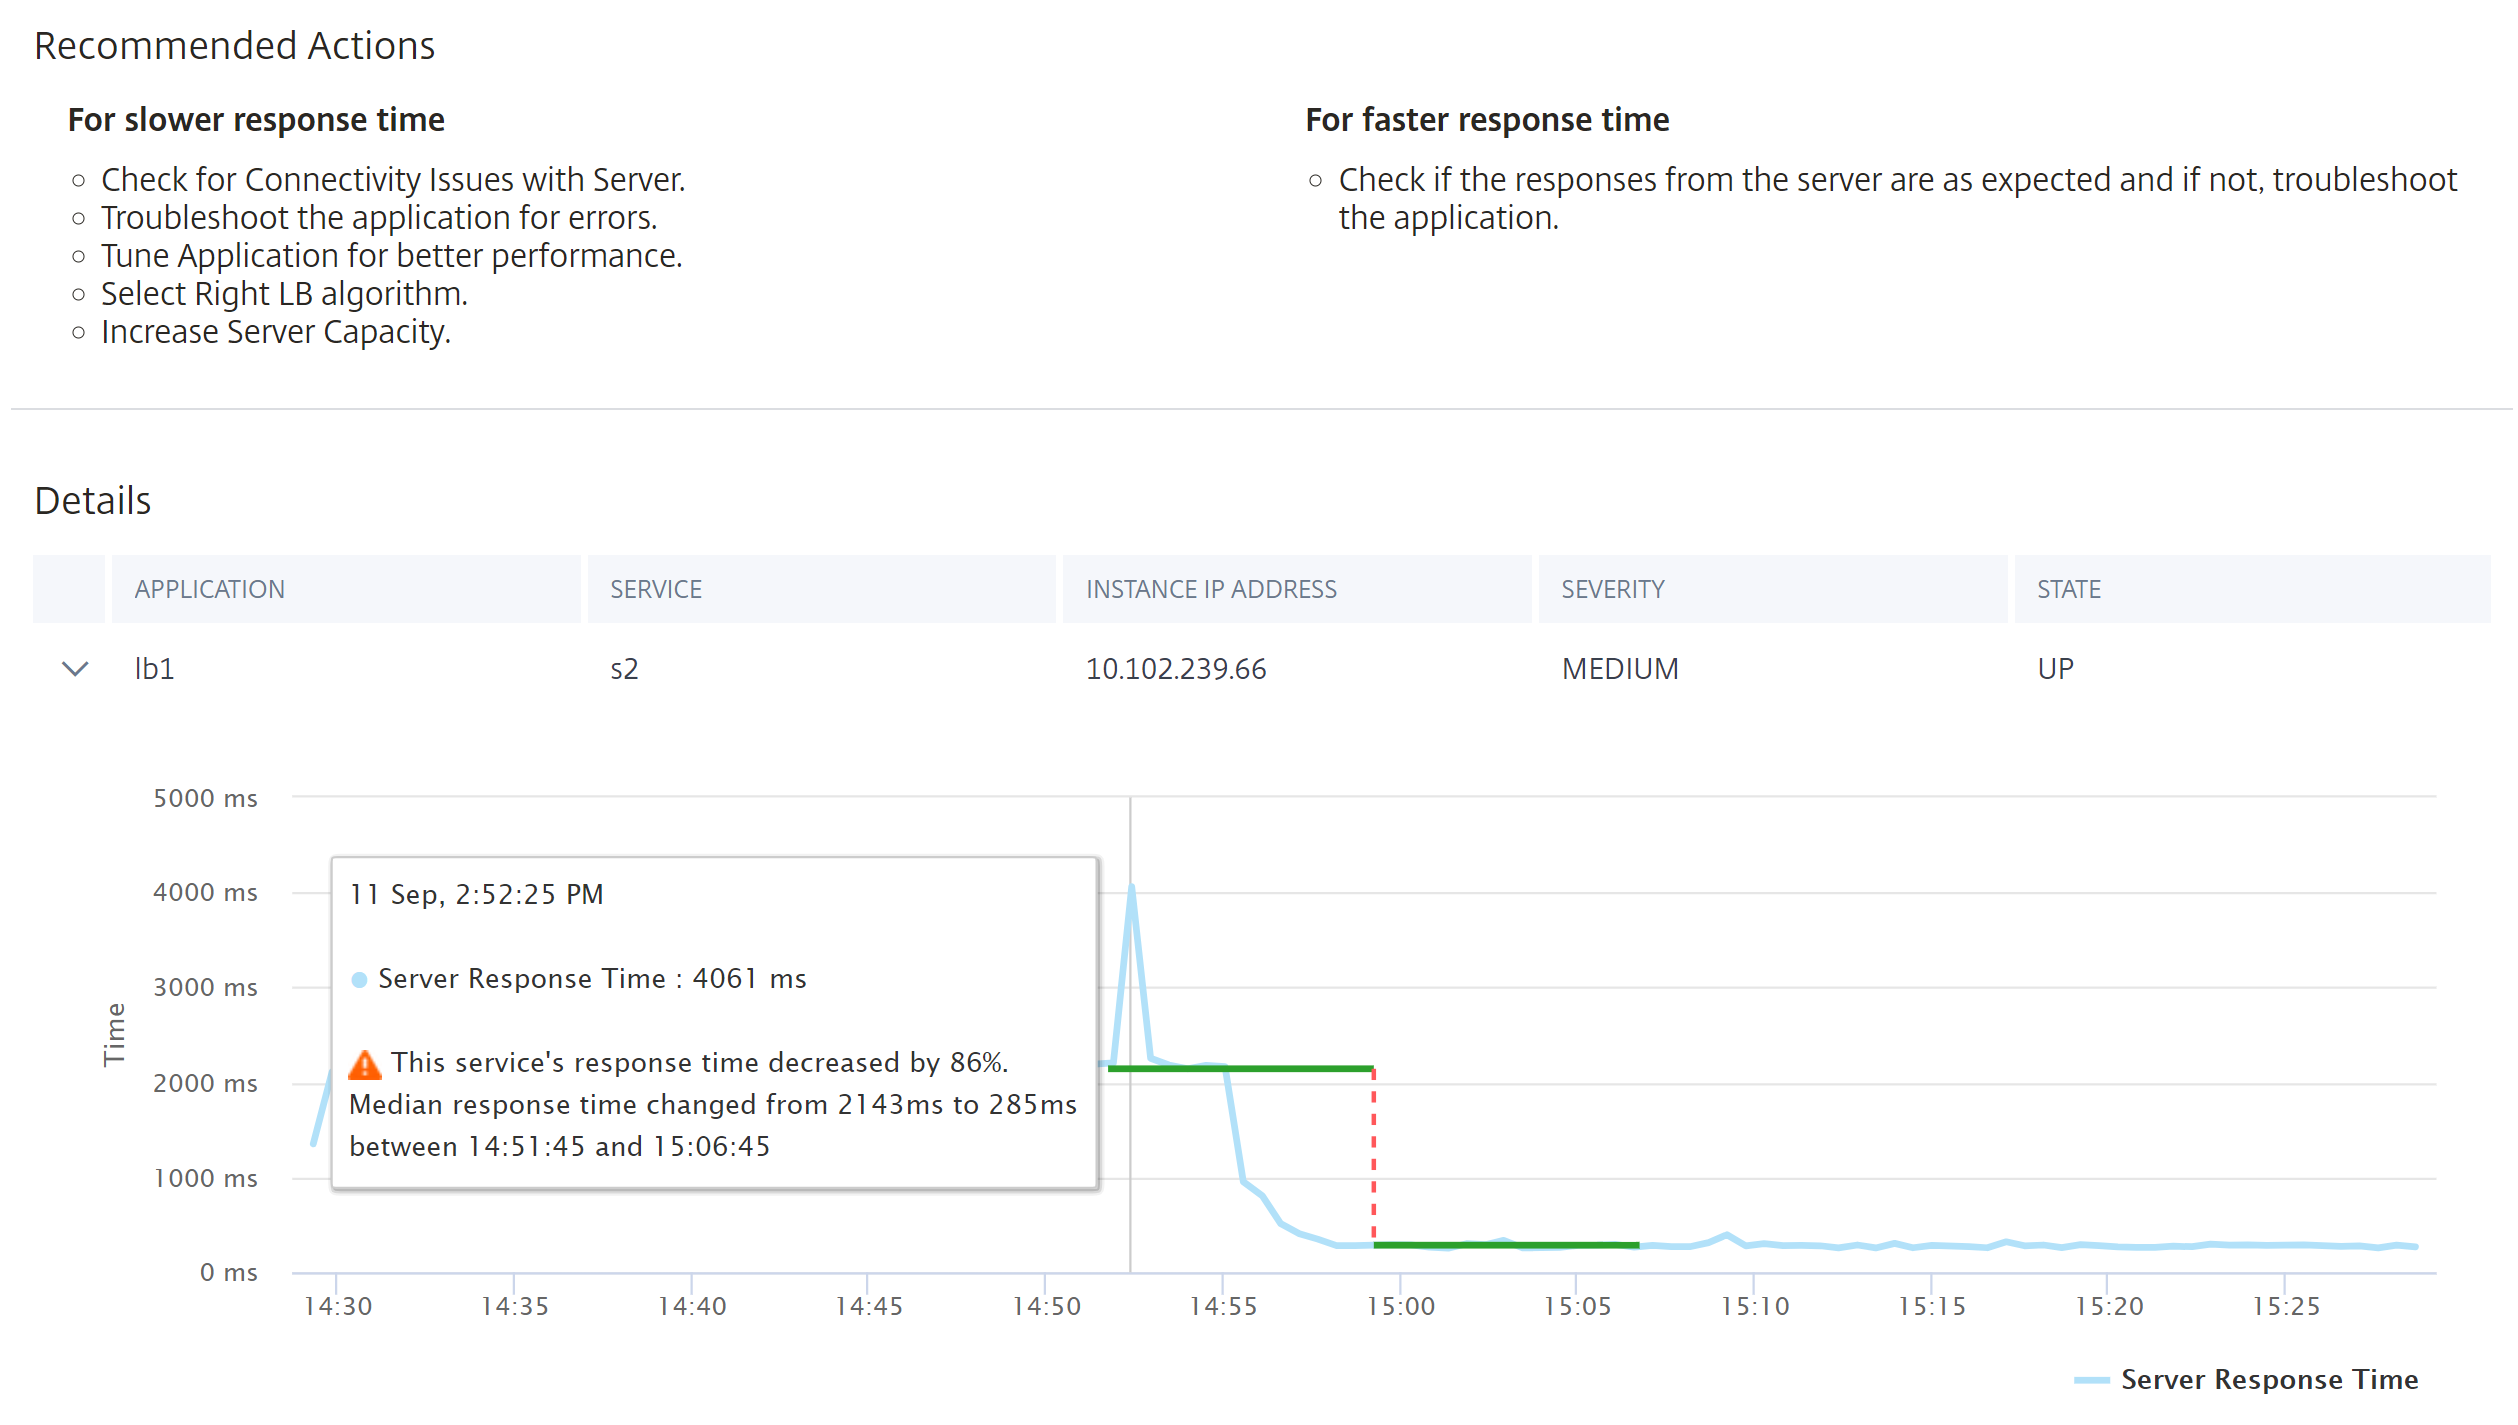
NetScaler Console compares the average server response time for a specific duration. According to the example shown in the image, NetScaler Console compares the average server response time between 14:51 and 15:06.
When the server response time begins to decrease, NetScaler Console further monitors the server response time for another specific duration and then detects anomaly for the time when the server response time has started to decrease.
According to the example shown in the image, you can see an anomaly was detected, mentioning that the server response time is decreased by 86%, after comparing the average server response time between 14:51 and 15:06.
The Recommended Actions suggest you to troubleshoot these anomalies.
-