Application dashboard overview
The application dashboard displays the discrete applications under Others and the custom applications that are grouped under their respective categories.
Navigate to Applications > Dashboard to view the app dashboard.
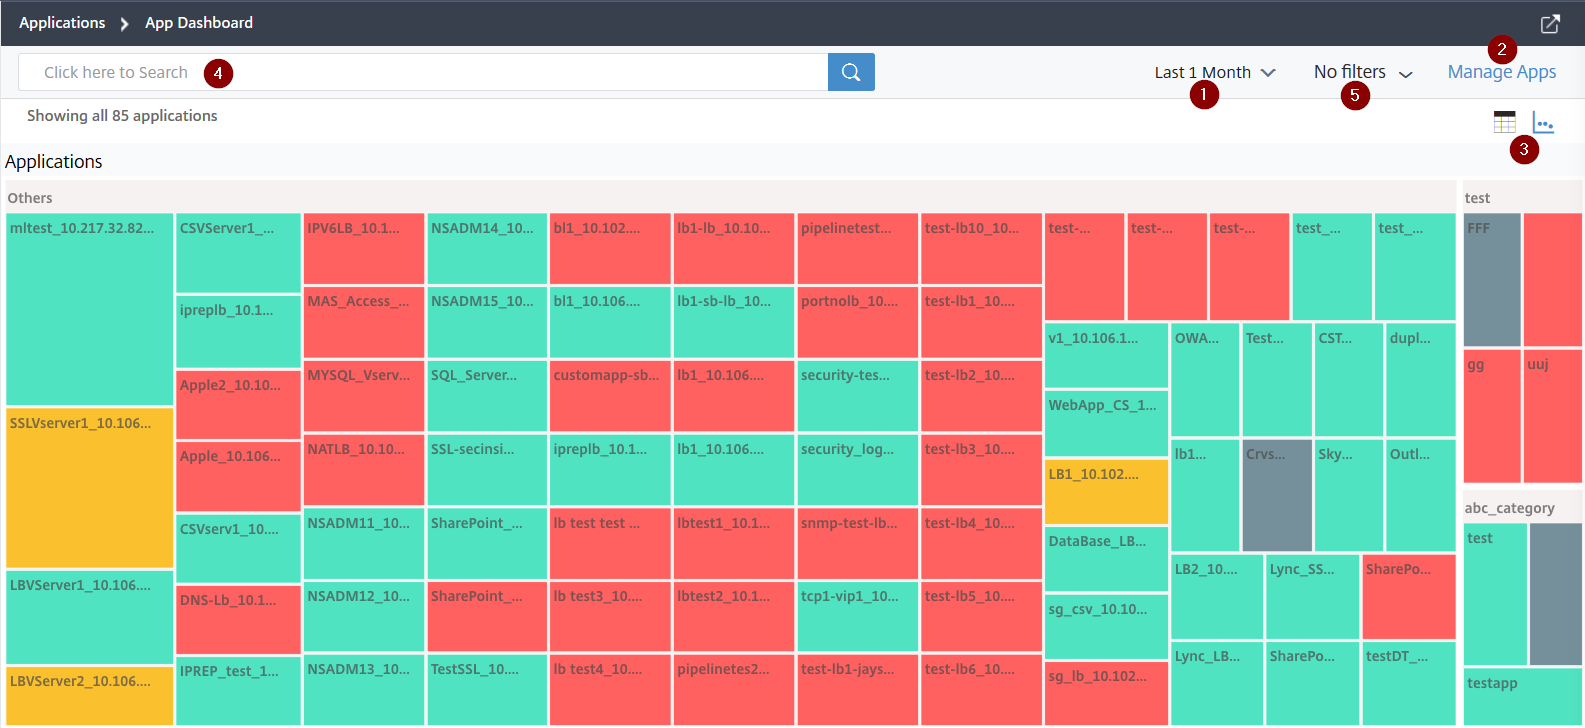
1 – Displays the application details for the selected time duration such as 1 hour, 1 day, 1 week, and 1 month.
2 – Enables you to manage applications and add new applications
3 – Enables you to view applications either in table view or in graph view
4 – Enables you to search an application using the search bar
5 – Enables you to apply filters to view applications. Click to view for details.

The carousel slider enables you an ease of access to all options.
You can:
-
Select to view applications based on the scores.
-
Critical – Application score is between 0 and < 40
-
Fair – Application score is between 40 and < 75
-
Good – Application score is greater than 75
-
Not Applicable – Either there are no virtual servers configured for the application or the virtual server type is not the load balancing or content switching.
The following table describes the differences between the earlier app score and the present app score.
Application score (Critical, Review, Good, Not Applicable) App score (earlier view with color legends) Score is calculated as 100 minus penalty score of all application current issues Score is calculated as 100 – (App server resource + NetScaler system resource) Applications are displayed in colors such Red (critical), Orange (review), Green (good), and Grey (Not Applicable) Applications are displayed in color legends. 
-
-
Select to view applications based on the application status such as Up, Down, and Out of Service
-
Select to view applications based on the application type such as Discrete or Custom
-
Select to view applications based on the categories grouped underneath
-
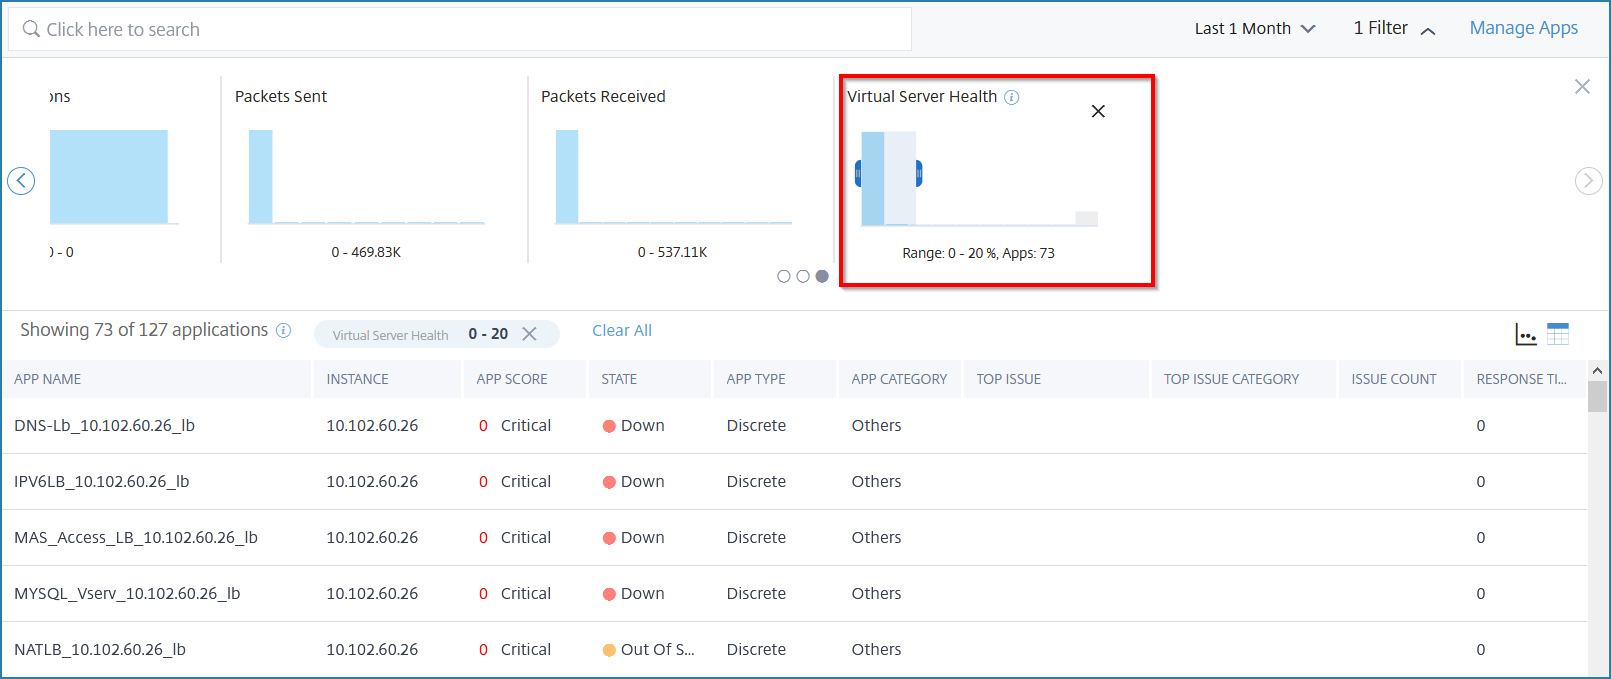
Drag the histogram to apply filters and view applications.
For example, if you want to view applications that have Virtual Server Health between 0 and 20, drag the Virtual Server Health histogram to filter the results.
Note:
You can also click the histogram to get the relevant applications displayed.
Click Clear All to clear the applied filter.

The following are the application summary for which you can apply filters:
-
Application score – Enables you to view applications based on Critical, Review, Good, and Not Applicable.
Note:
By default, you can view applications that are in Critical, Review, and Good status. To view applications that are in N/A status, you must select the Not Applicable option.
-
State – Enables you to view application based on the application status such as Up, Down, and Out of Service.
-
Current Issues – Enables you to get a list of applications impacted with a specific issue, by choosing the issue type such as Performance, Instance Health, Config, and System Resources.
-
App Type – Enables you to view applications based on the application type such as Custom, Discrete, and Kubernetes services.
-
App Category – Enables you to view the applications based on the category assigned.
-
Response Time – A histogram that displays the average response time received by the applications.
-
Total Requests – A histogram that displays the total number of requests received by the applications.
-
Throughput – A histogram that displays the total network throughput processed by the applications.
-
Data Volume – A histogram that displays the total data processed by the applications. Data volume is calculated by the total request bytes and response bytes for the applications.
-
Client Connections – A histogram that displays the average client connections established by the applications.
-
Server Connections – A histogram that displays the average server connections established by the applications.
-
Packets Sent – A histogram that displays the total packets sent by the applications.
-
Packets Received – A histogram that displays the total packets received by the applications.
-
Virtual Server Health – A histogram that displays the total applications between the score range 0% to 100%. A virtual server health is (%) of active services associated with the application. For example, if a virtual server is configured with 2 services and if one of them is down, the score is 50%.
-
Search and filter results using the search bar
You can place the mouse pointer on the search bar and select the category to refine the search.

Save filter
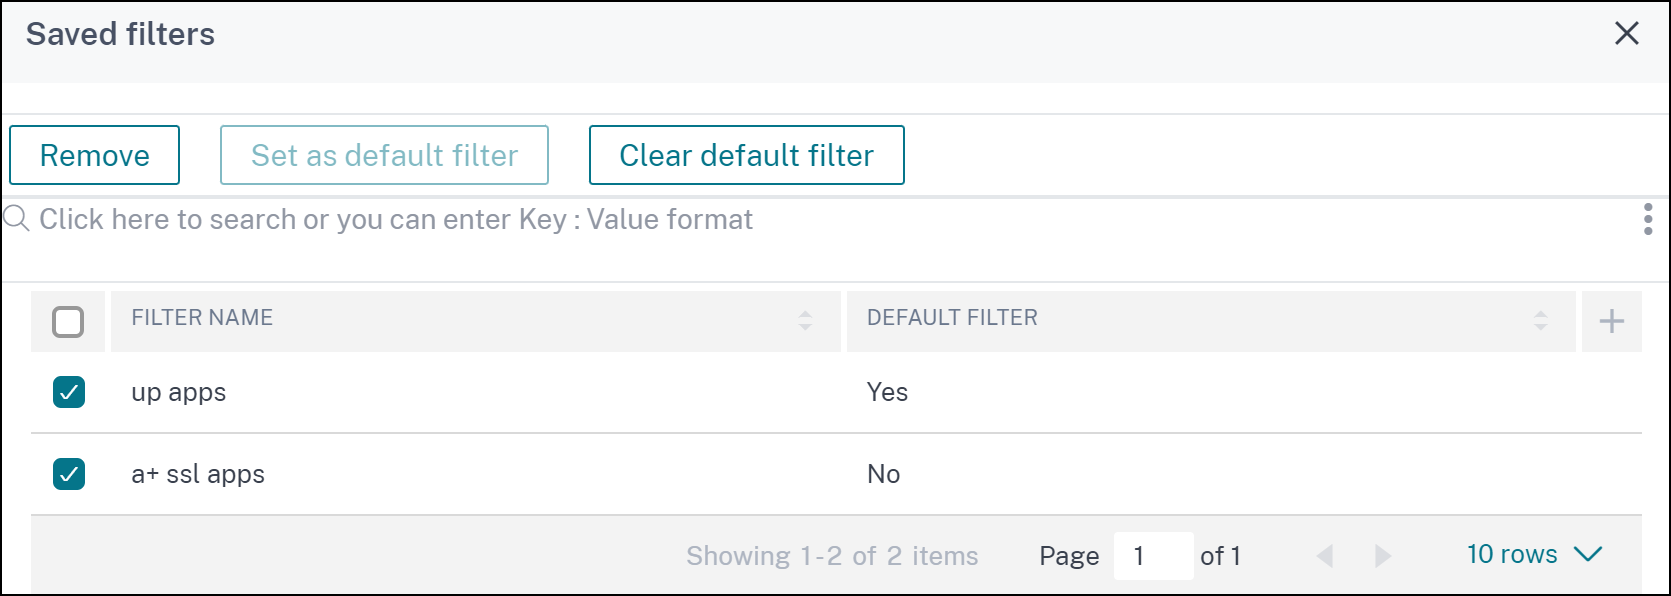
You can apply filters in the app dashboard and save filters. You can then select the filter name from the list and view the customized dashboard whenever required.
Consider that you wanted to create a filter for applications that are in the Up status. In App Dashboard, after you apply the filter, click Save Filter.

Provide a name of your choice and click Save.
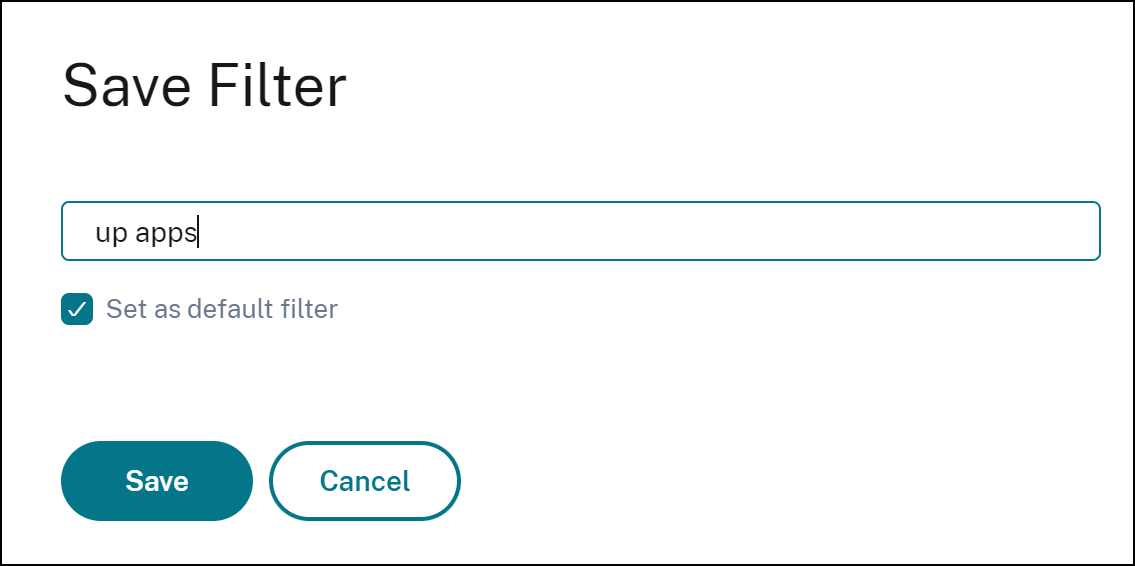
You can also select Set as default filter to have this filter as a default view in the app dashboard.
You can save multiple filters and select the filter name from the list to view the customized dashboard whenever required.
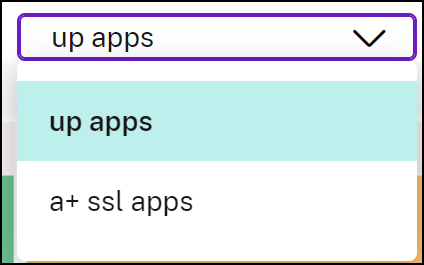
To remove the default filter or remove the filter, click the filter icon next to the filter list.
Create and apply tags to applications
If you have a large number of applications, you can create and apply tags to applications. These tags improve the search functionality.
Example:
The following procedure lists the steps to create tags for the load balancing applications:
-
In App Dashboard, select the load balancing applications that you want to create tags and click Tags.

-
In the Update Tags:
-
Specify a name of your choice. For example: Type.
-
Specify the value that enables you to assign the tags. You can also enter multiple values. For example: Loadbalance.
-
Click Apply.
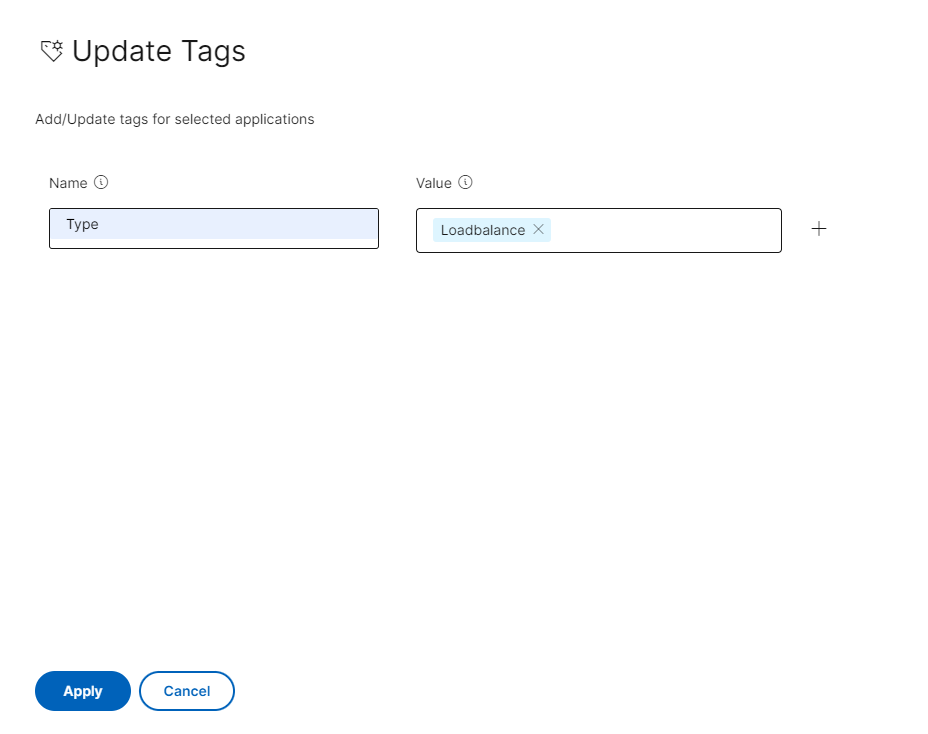
The tag is created.
-
To apply tags and retrieve the load balancing applications:
-
In the app dashboard search bar, click inside the textbox to view the created tag and select the tag name.
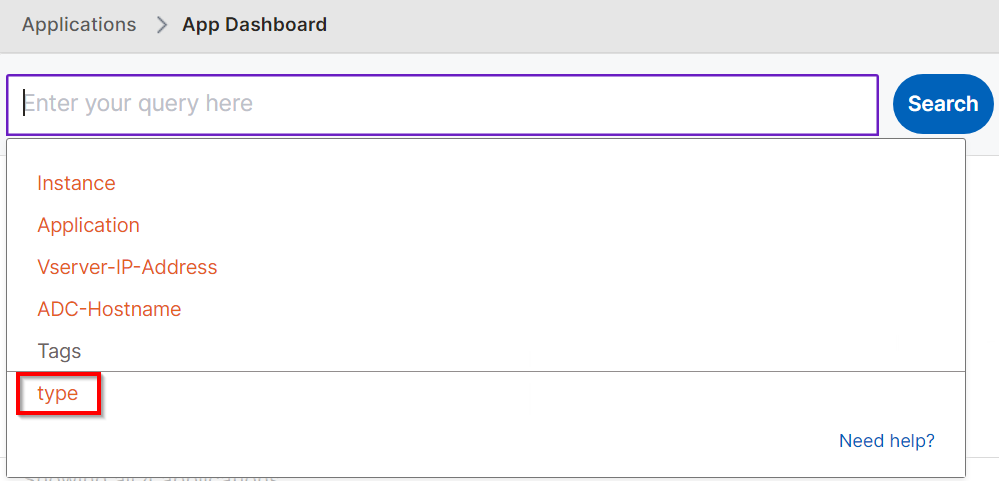
-
Select the operator (IN) and the value that is created, and then click Search.
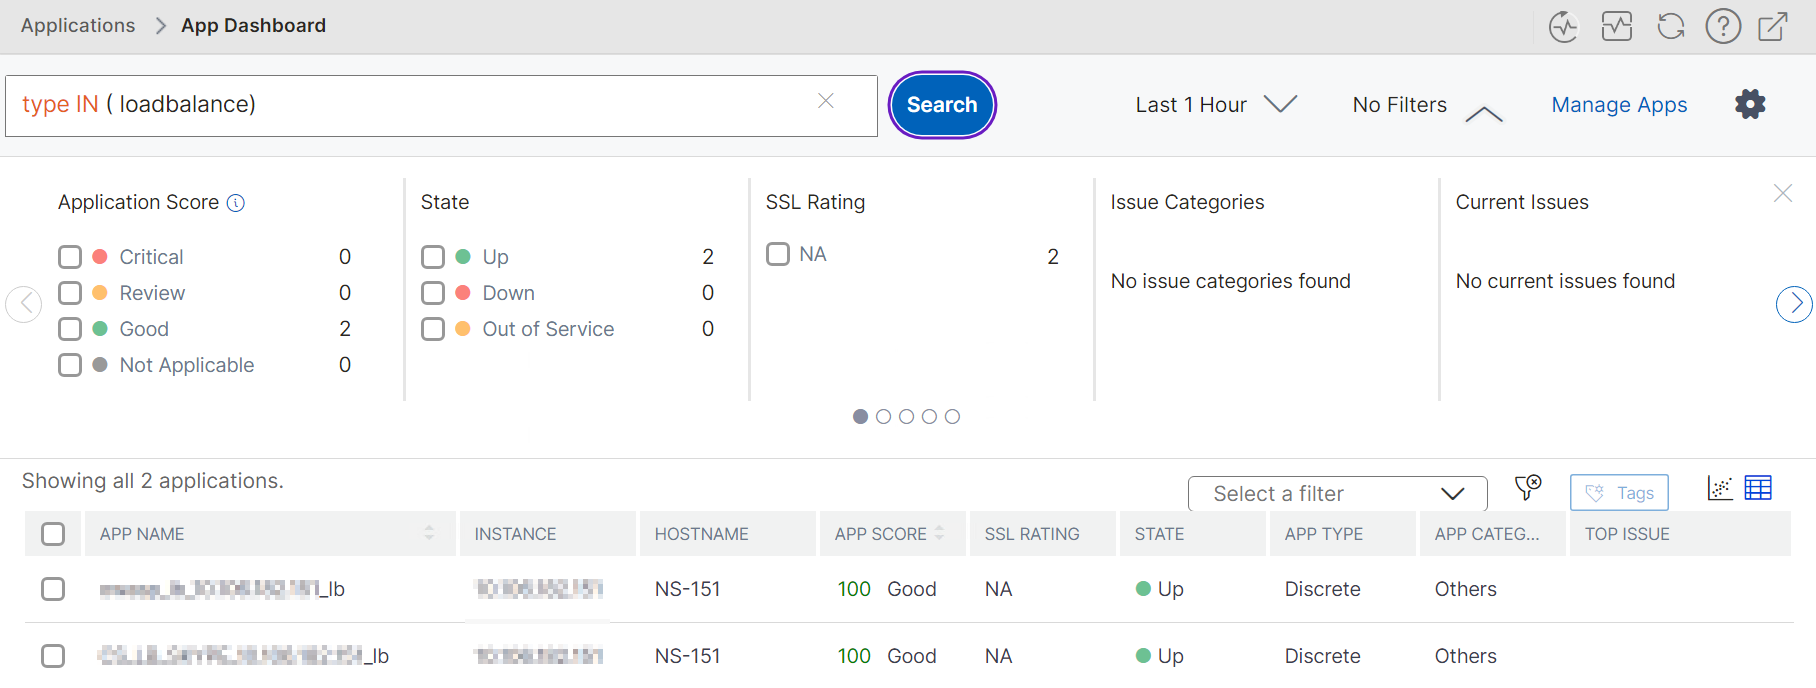
All the load balancing applications that are tagged under Loadbalance are listed. Similarly, you can create tags for other applications.