This content has been machine translated dynamically.
Dieser Inhalt ist eine maschinelle Übersetzung, die dynamisch erstellt wurde. (Haftungsausschluss)
Cet article a été traduit automatiquement de manière dynamique. (Clause de non responsabilité)
Este artículo lo ha traducido una máquina de forma dinámica. (Aviso legal)
此内容已经过机器动态翻译。 放弃
このコンテンツは動的に機械翻訳されています。免責事項
이 콘텐츠는 동적으로 기계 번역되었습니다. 책임 부인
Este texto foi traduzido automaticamente. (Aviso legal)
Questo contenuto è stato tradotto dinamicamente con traduzione automatica.(Esclusione di responsabilità))
This article has been machine translated.
Dieser Artikel wurde maschinell übersetzt. (Haftungsausschluss)
Ce article a été traduit automatiquement. (Clause de non responsabilité)
Este artículo ha sido traducido automáticamente. (Aviso legal)
この記事は機械翻訳されています.免責事項
이 기사는 기계 번역되었습니다.책임 부인
Este artigo foi traduzido automaticamente.(Aviso legal)
这篇文章已经过机器翻译.放弃
Questo articolo è stato tradotto automaticamente.(Esclusione di responsabilità))
Translation failed!
統計
Citrix SD-WAN™ Centerによって収集された統計をグラフとして表示できます。これらのグラフは、タイムラインと使用状況を比較してプロットされており、さまざまなネットワークオブジェクトプロパティの使用傾向を把握できます。ネットワーク全体のアプリケーション統計のグラフを表示できます。SD-WANネットワーク内のすべてのサイトについて、以下のネットワークパラメータのグラフを表示できます。
- 帯域幅
- QoS
- 仮想パス
- インターネットサービス
- イントラネットサービス
- パススルーサービス
- WANリンク
- イーサネットインターフェイス
- GREトンネル
- IPsecトンネル
- アプリケーション
- アプリケーションファミリ
ヒント
要件に応じてビューを作成し、保存して既存のビューを開くことができます。
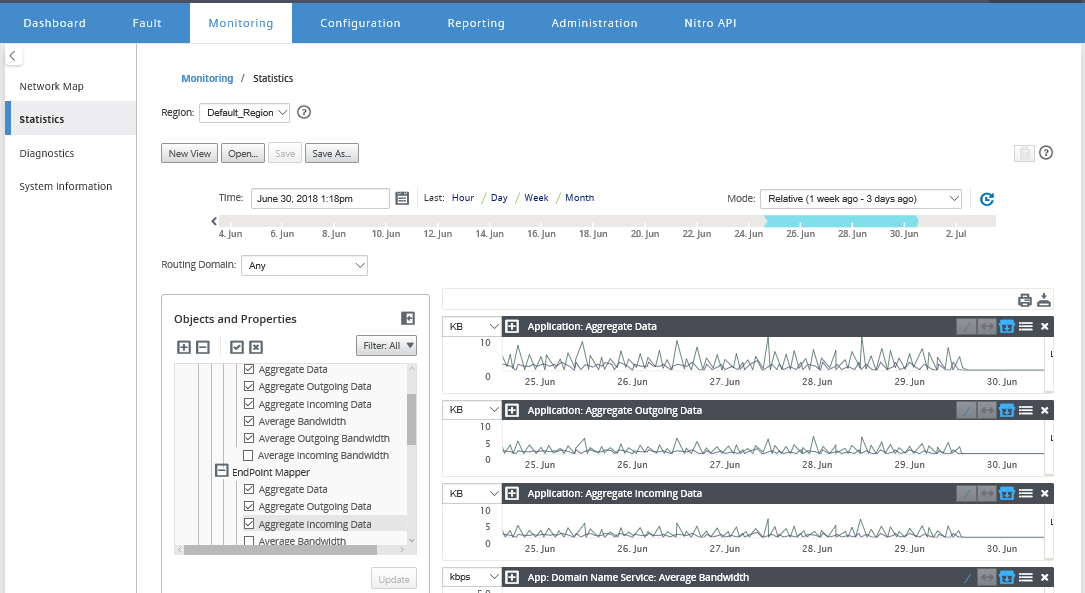
統計グラフを表示するには:
-
Citrix SD-WAN Center Web UIで、監視 > 統計 に移動します。
-
リージョンとルーティングドメインを選択します。
-
オブジェクトとプロパティ 階層ツリーから、目的のプロパティを見つけて選択します。
ヒント
フィルター ドロップダウンメニューと プリセットメニュー を使用して、プロパティの検索と選択プロセスを簡素化することもできます。
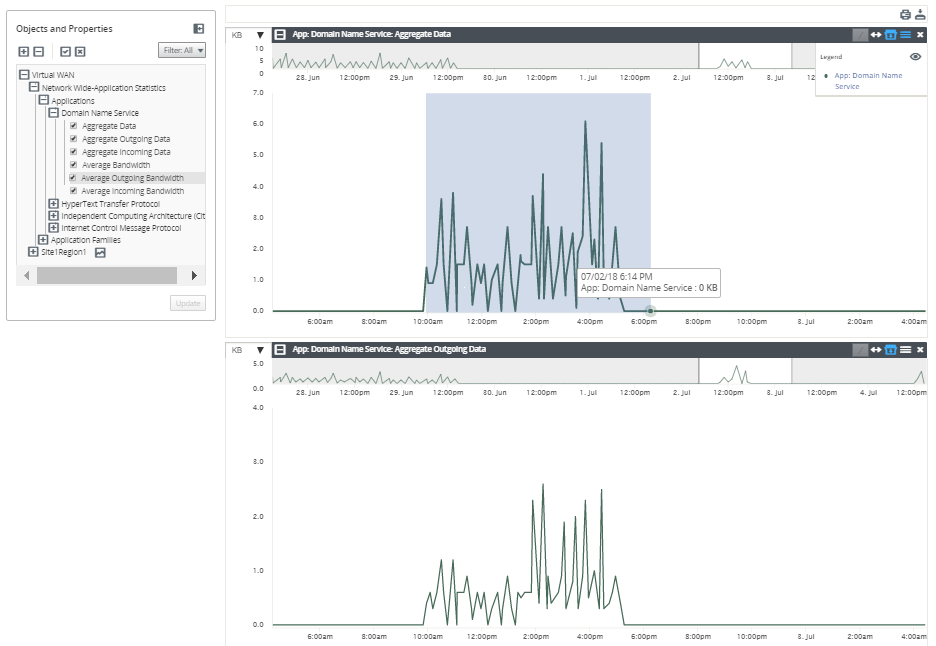
-
選択したプロパティのグラフを表示するには、更新 をクリックします。
ヒント
プロパティの選択を解除し、更新 をクリックすると、そのプロパティのグラフがグラフ表示エリアから削除されます。
-
現在のビューの期間を選択します。詳細については、「タイムラインコントロール」を参照してください。
グラフは、選択したプロパティに基づいて表示されます。
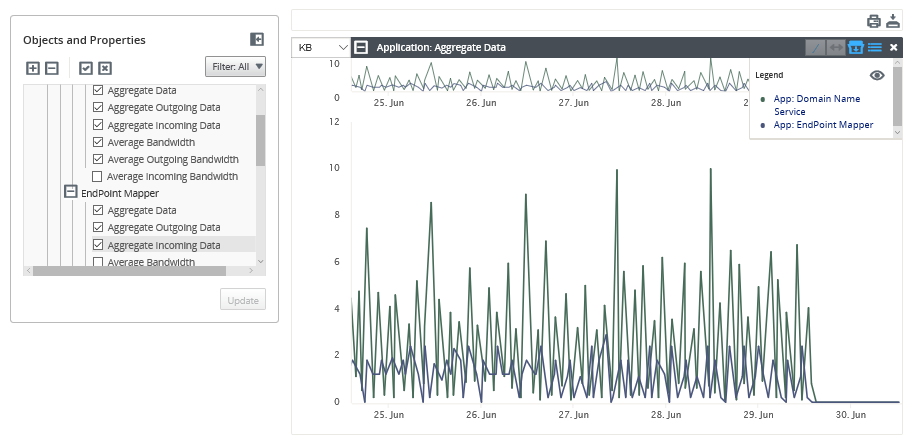
ヒント
複数のプロパティを選択すると、垂直方向のスペースを節約するために、グラフが トレンドビュー モードで表示されます。グラフの見出しをクリックすると、完全に展開されたグラフの表示/非表示を切り替えることができます。また、グラフ上のトレンドビューと凡例の表示/非表示を切り替えることもできます。
ヒント
グラフをズームするには、グラフのプロットエリアをクリックしてドラッグします。1つのグラフをズームすると、選択した時間にすべてのグラフがズームされ、一貫したビューが維持されます。リセットアイコン (↔) をクリックしてズームをリセットします。
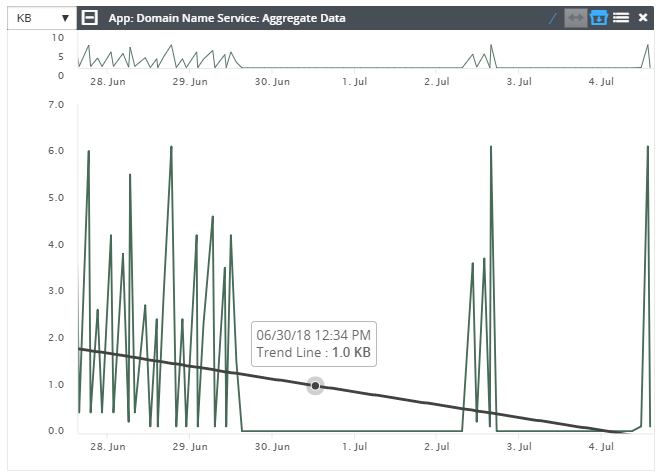
ヒント
(/) アイコンをクリックすると、トレンドラインの表示/非表示を切り替えることができます。
注
グラフを印刷したり、グラフセットをCSVファイルとしてダウンロードしたりできます。
共有
共有
This Preview product documentation is Cloud Software Group Confidential.
You agree to hold this documentation confidential pursuant to the terms of your Cloud Software Group Beta/Tech Preview Agreement.
The development, release and timing of any features or functionality described in the Preview documentation remains at our sole discretion and are subject to change without notice or consultation.
The documentation is for informational purposes only and is not a commitment, promise or legal obligation to deliver any material, code or functionality and should not be relied upon in making Cloud Software Group product purchase decisions.
If you do not agree, select I DO NOT AGREE to exit.