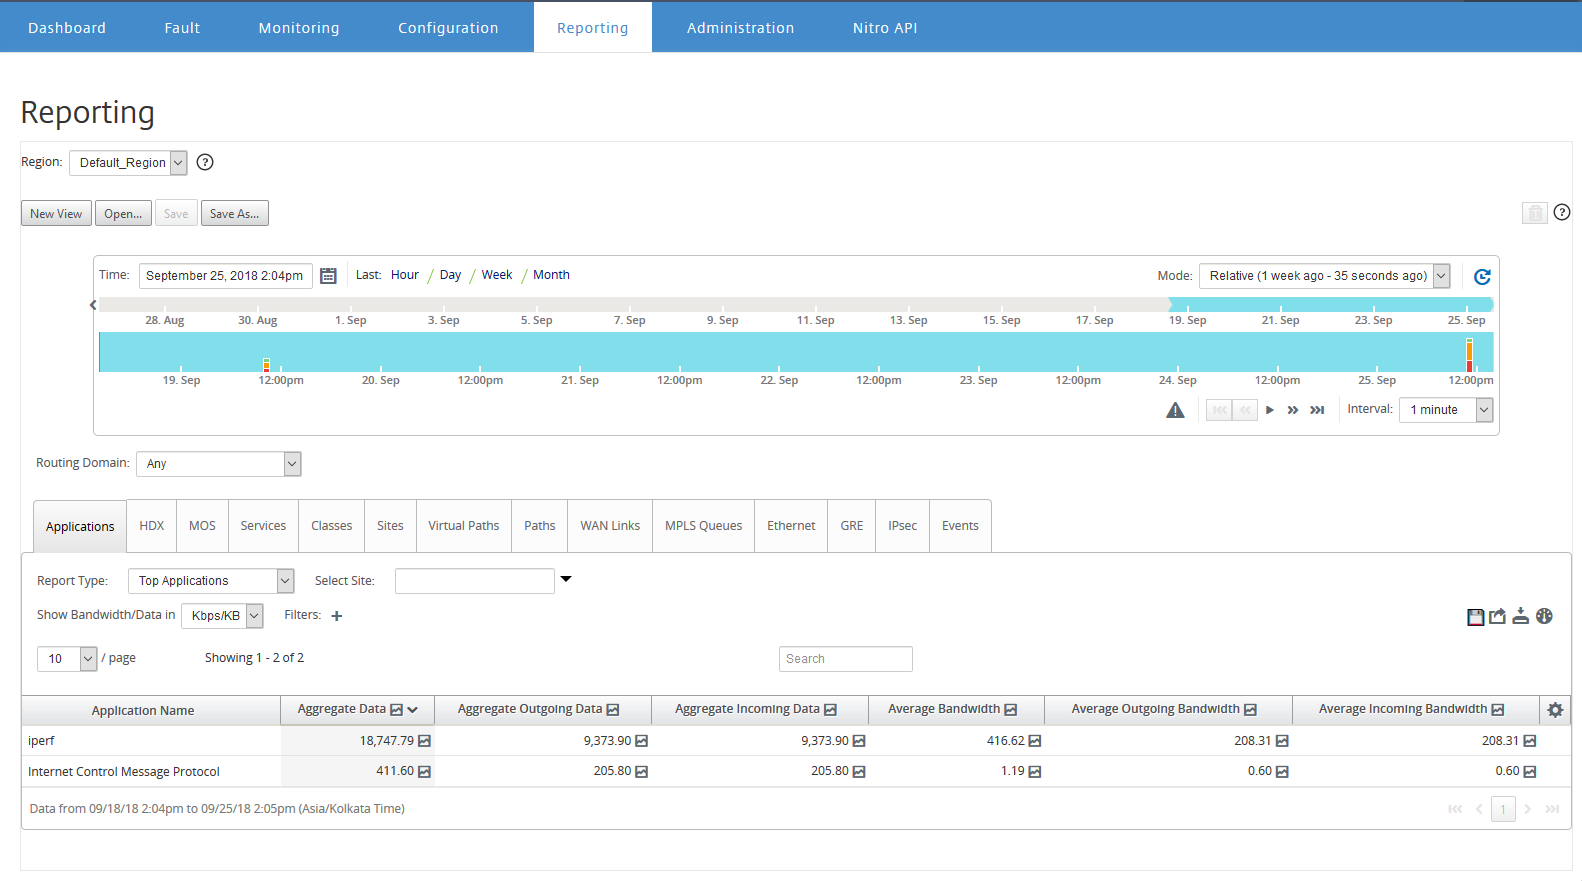
Application report
Deep packet inspection (DPI) enables the SD-WAN appliance to parse the traffic passing through it and identify the application and application family types. Citrix SD-WAN™ appliance records the number of bytes and bandwidth of incoming and outgoing traffic of every application. SD-WAN Center polls the SD-WAN appliance at the defined polling interval, obtains this data, and displays it on the dashboard and as reports.
You can view top applications, top sites, and top application family reports. These reports provide details about the total, incoming, and outgoing data and bandwidth.
To view application reports in Citrix SD-WAN Center:
-
In Citrix SD-WAN Center web UI, navigate to Reporting > Applications.
-
In the time-line control, select the time interval. For more information, see Timeline controls.
-
Select the unit to display the data. You can choose to view report data in units of Kbps, Mbps, or Gbps.
-
From the Report Type drop-down list, select one of the following report types:
- Top Applications: The top applications used in the network for the selected time interval. You can filter top application by site name. By default, the top applications for all the sites are displayed.
- Top Application Families: Top application families used in the network. You can filter top application families by site name. By default, the top application families for all the sites is displayed.
-
Top Sites: Traffic at the top sites for the selected time interval. You can filter top sites by application or application family name.

For each report type, you can view the following data:
- Aggregated Incoming Data: Application data coming into the site from the WAN.
- Aggregated Outgoing Data: Application data sent from the site to the WAN.
- Aggregated Data: Sum of incoming and outgoing traffic.
- Average Incoming Bandwidth: Bandwidth of incoming application traffic.
- Average Outgoing Bandwidth: Bandwidth of outgoing application traffic.
- Average Bandwidth: Total bandwidth consumed by incoming and outgoing application traffic.
Tip
For every value, you can hover the mouse cursor over the graph icon to view a mini-graph, or click to open graph view in another window. For more information, see Statistics.