View analytics for Web transactions
Web transaction analytics enables you to view detailed transactions for:
-
Response time > 500 ms
-
5xx errors
Note:
You can view only a few sample 2xx transactions for the selected application.
Prerequisites:
To view the web transaction analytics, you must:
-
Enable analytics.
-
Change the Web Transaction Settings to get the 2xx displayed. Navigate to Settings > Analytics Settings, select Enable Features for Analytics, and select All.
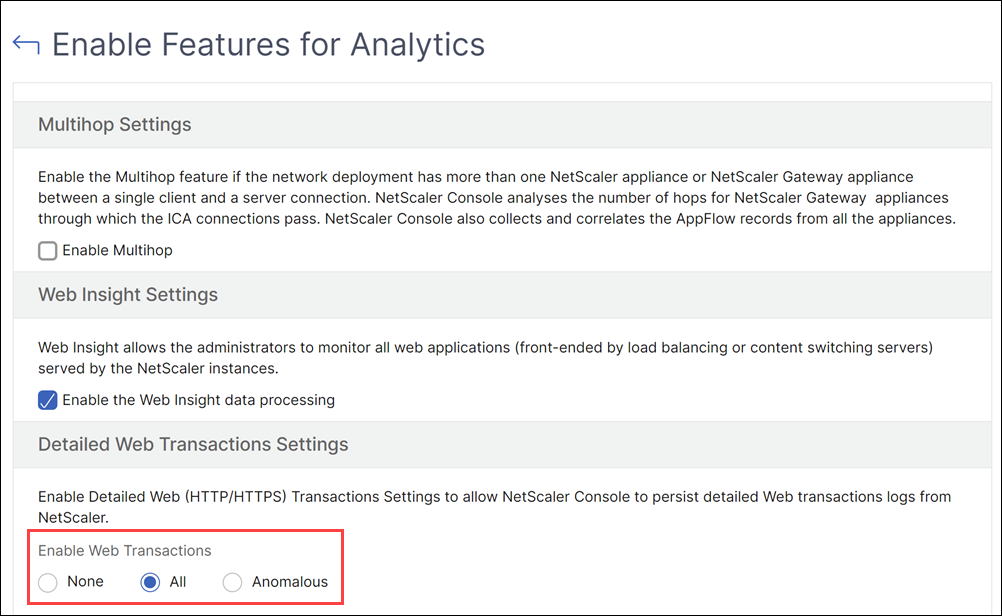
Detailed web transactions
This feature not only enables you to look into the detailed transactions, but also understand the response time metric split across the client, NetScaler, and server visually.
Note
In some scenarios, NetScaler might not be able to calculate the RTT values for some transactions. For such transactions, NetScaler Console displays the RTT values as
- NA – Displays when the NetScaler instance cannot calculate the RTT.
- < 1ms – Displays when the NetScaler instance calculates the RTT in decimals between 0 ms and 1 ms. For example, 0.22 ms.
You can access the Transaction Summary for:
-
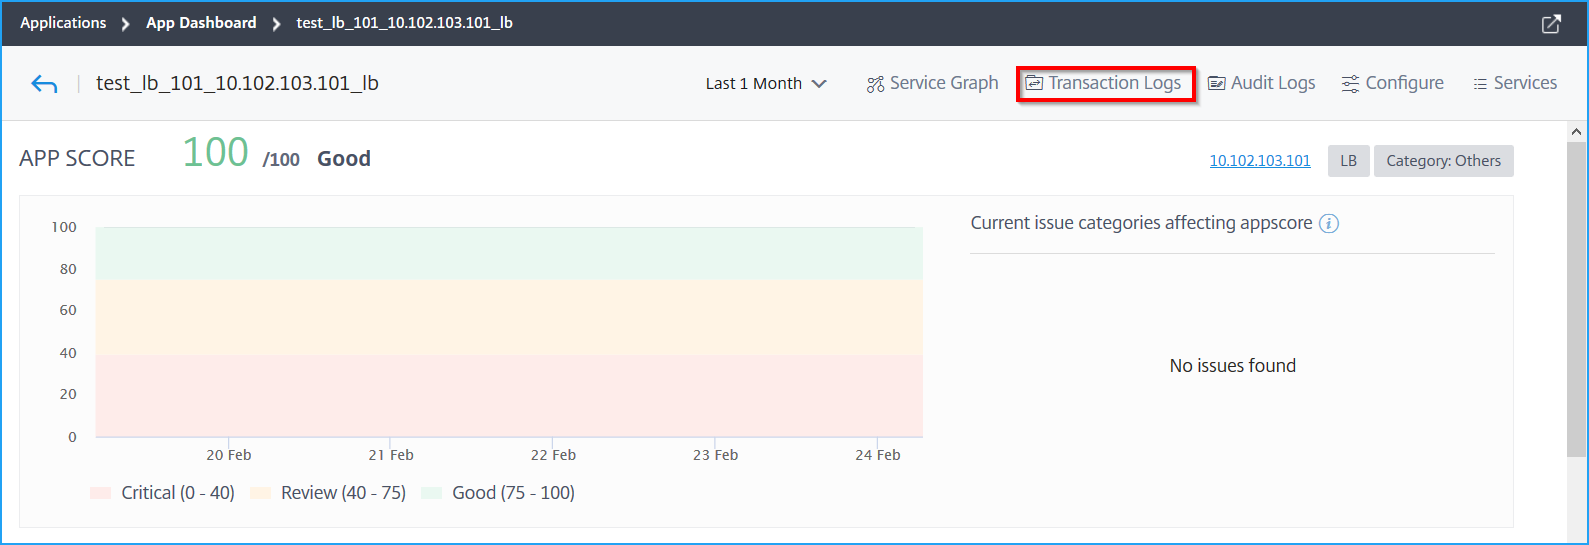
Applications - Navigate to Applications > Dashboard, select an application, and Click Transaction Log.
-
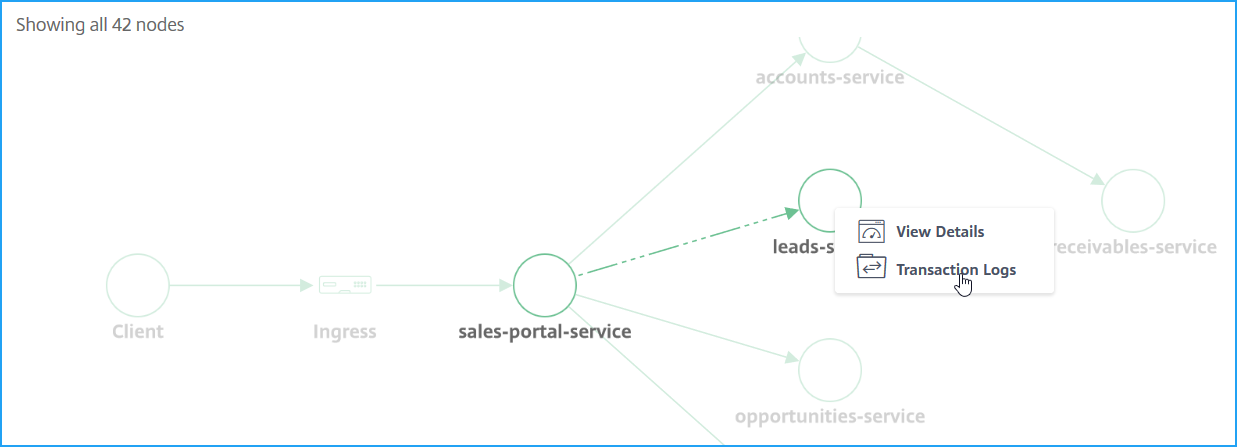
Kubernetes apps - Navigate to Applications > Service Graph, and click a service and select Transaction Logs.
The Transaction Summary page is displayed for the selected application.
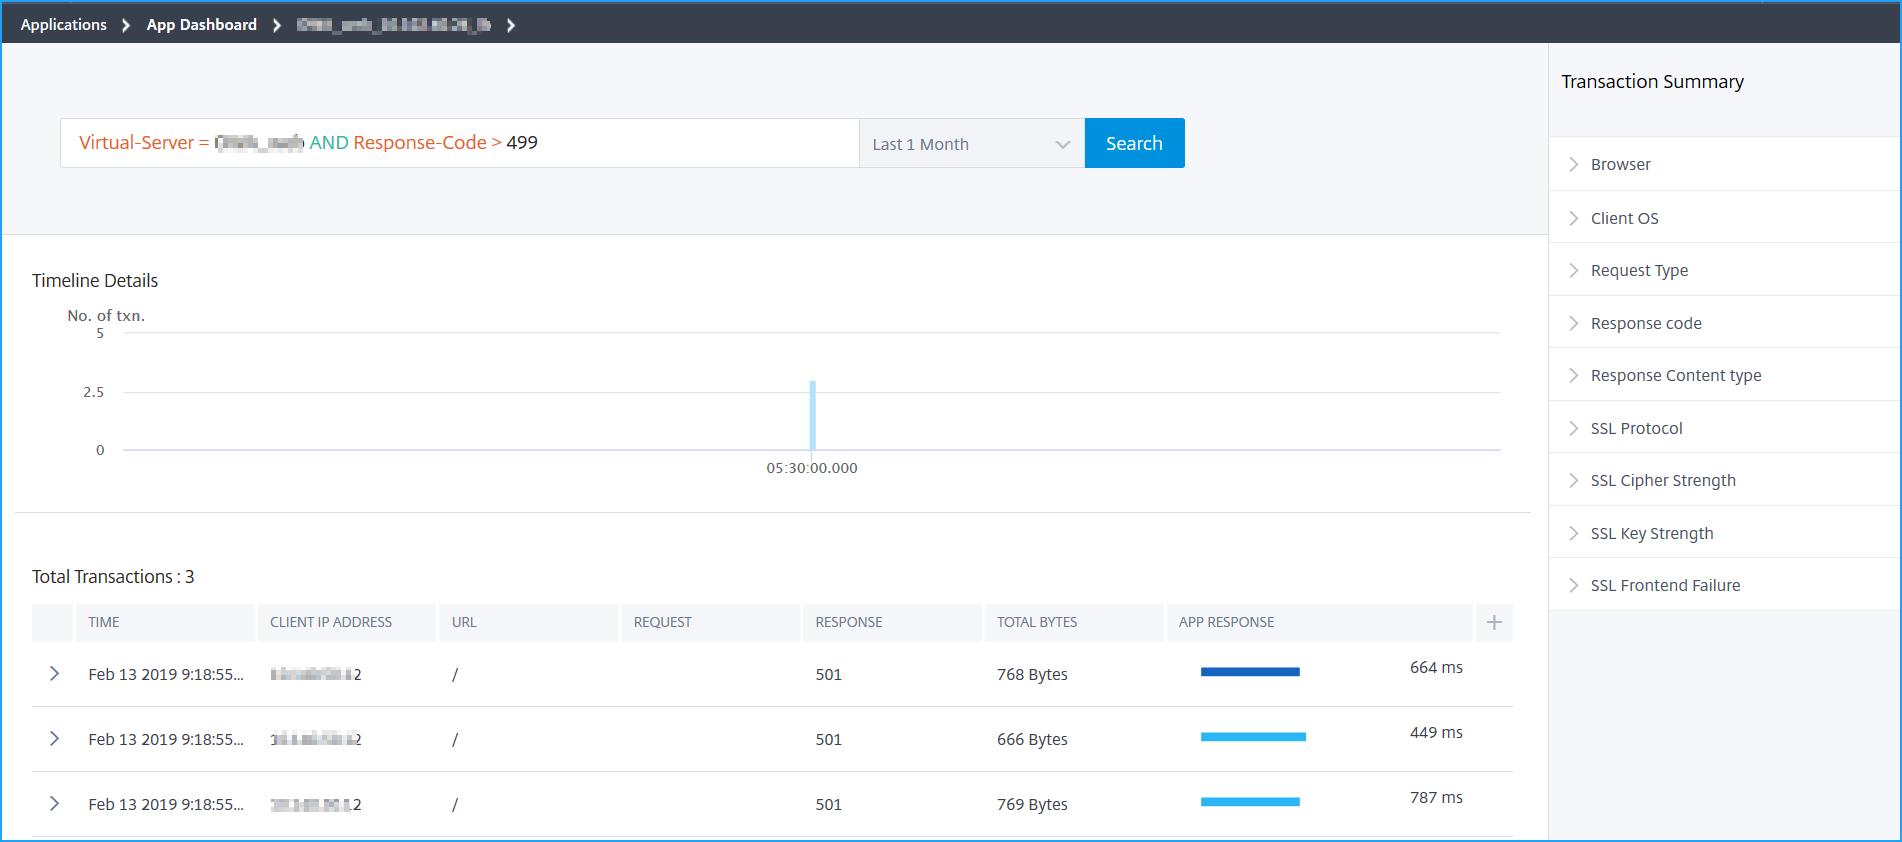
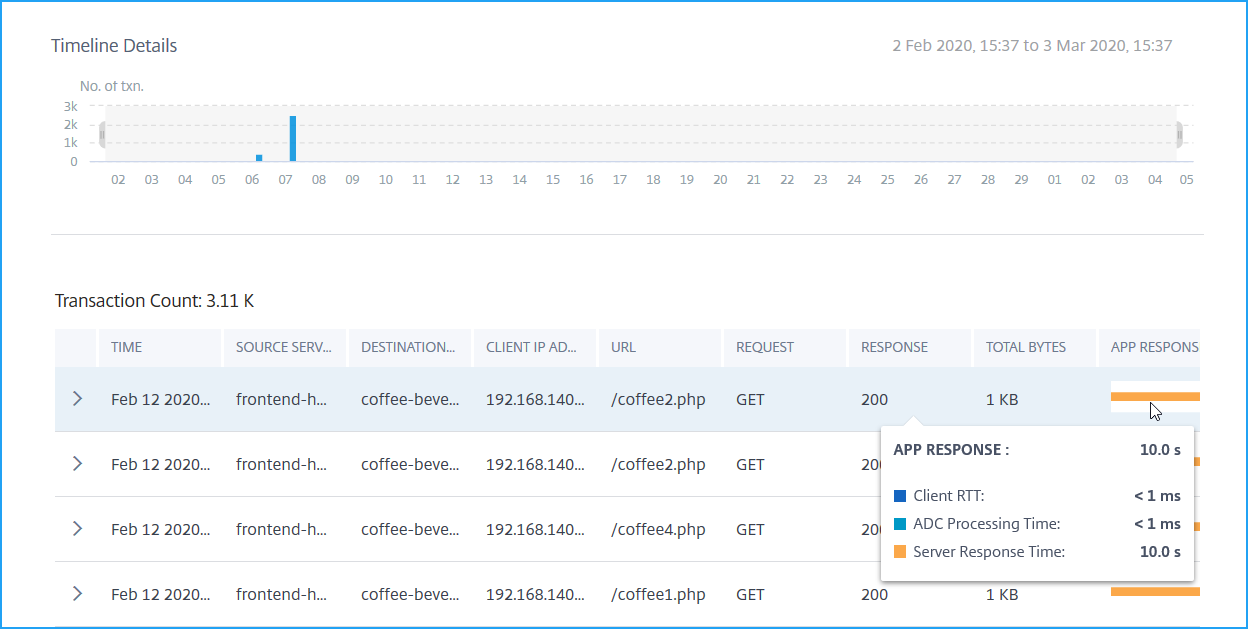
Hover the mouse pointer in App Response to view details such as RTT and processing time from NetScaler instance and the server.
The following example helps you analyze that the issue is from the server. The server response time indicates 10 seconds.
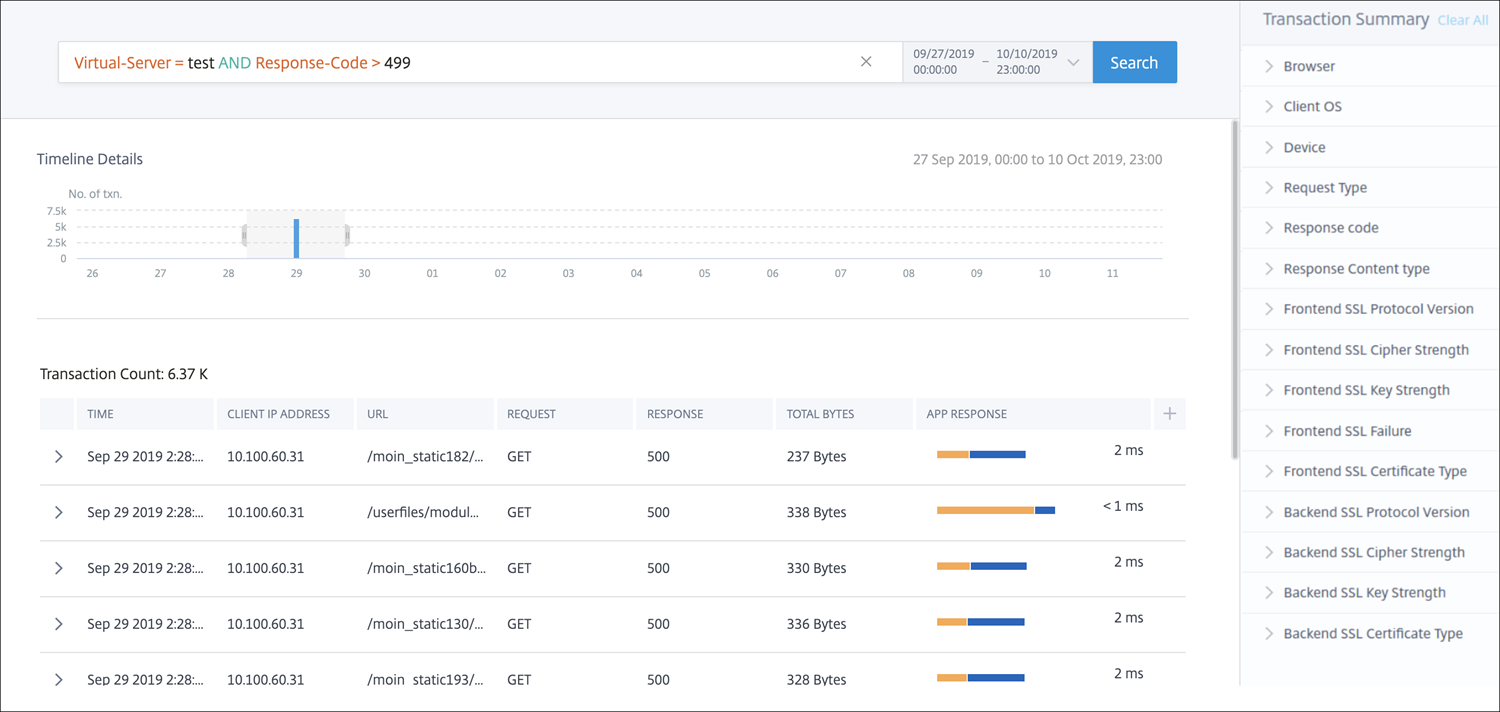
You can also drag and select to view the transactions for a specific duration.
View events
You can view the detailed information about a particular event. On the Transaction Summary panel, you can filter results by selecting the options from each metric.
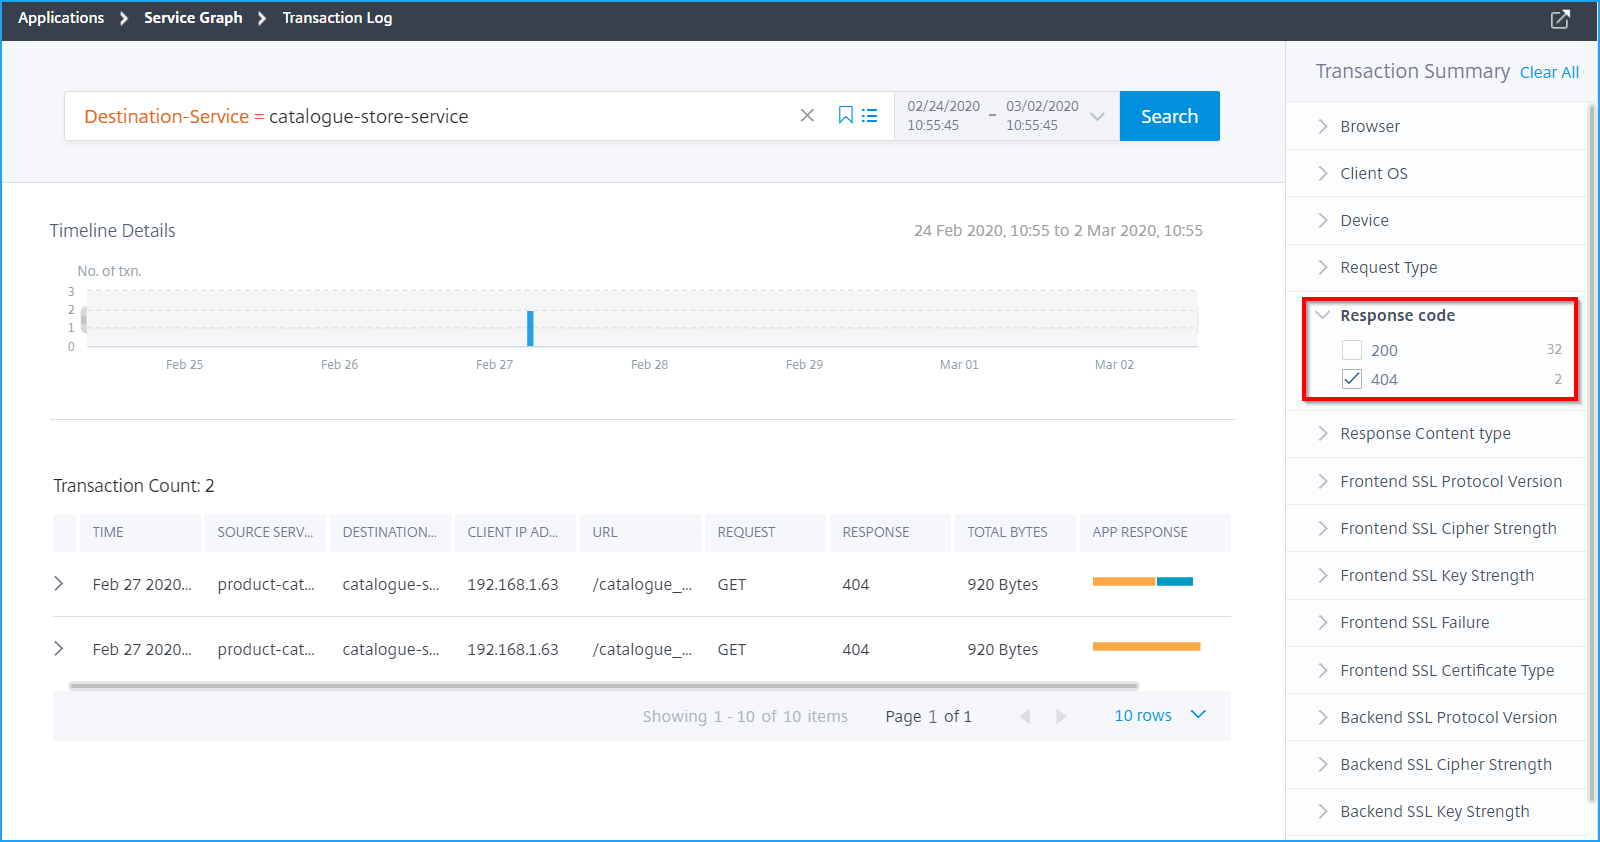
For example, consider that you want to view 4xx transactions.
On the Transaction Summary panel, click Response code, and select 404 to view the result.
Click a transaction to view the details that display the metrics information from client to server.
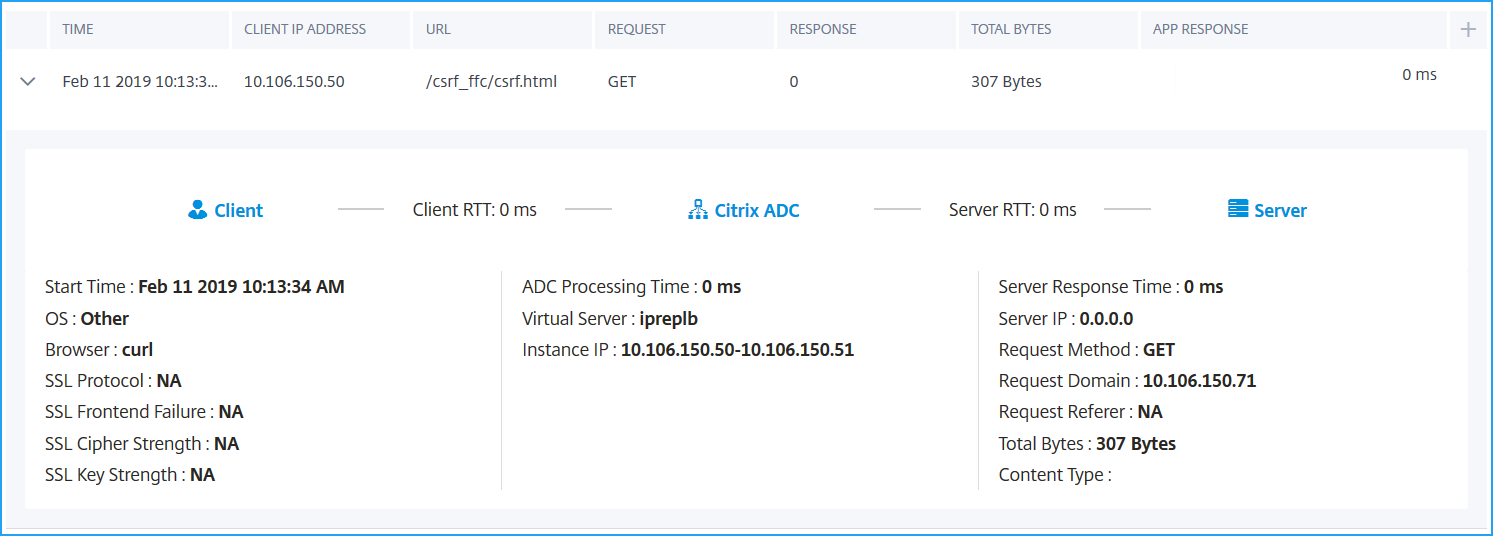
For transactions that have SSL errors, the details are displayed for both client and server. The following SSL metrics are displayed:
-
SSL Protocol Version
-
SSL Front-end Failure
-
SSL Cipher Strength
-
SSL Key Strength
-
SSL Certificate Type
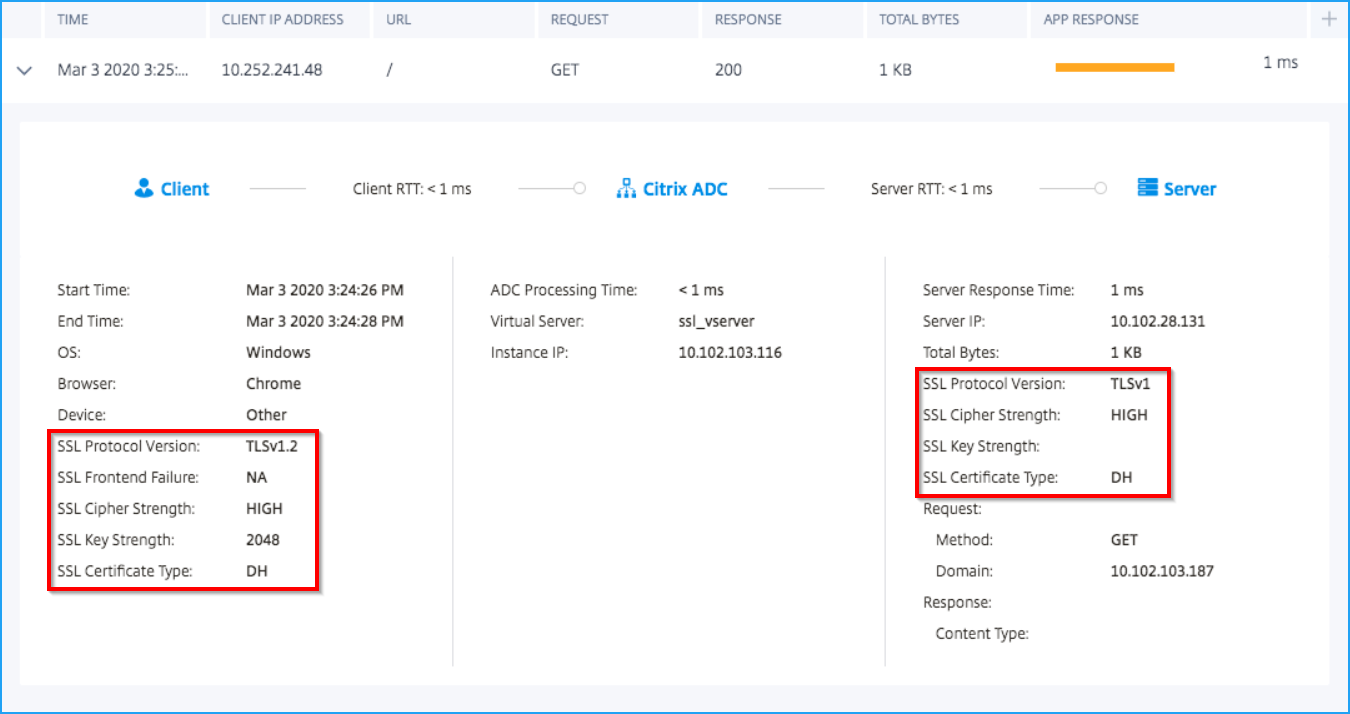
You can also click the SSL Frontend and SSL Backend metrics from the Transaction Summary panel to filter the results.
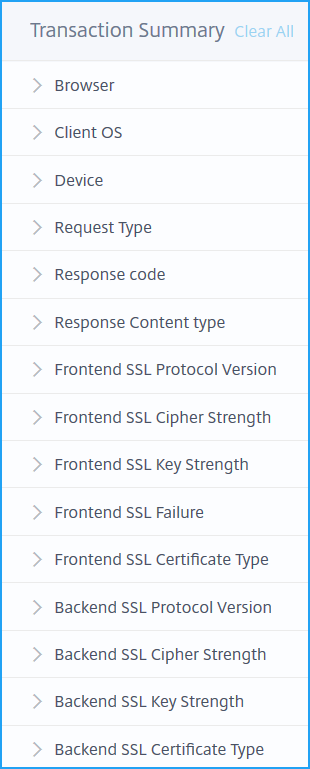
To filter the results, select the options available under Transaction Summary.
-
Browser: The browsers types used by the clients. For example: Chrome, Firefox.
-
Client OS: The client OS based on the User Agent details from the browser. For example: Windows
-
Device: The devices based on the User Agent details from the browser. For example: Tablet, Mobile.
-
Request Type: The transaction request type. For example: GET.
-
Response code: The response code received from the server. For example: 501, 404, 200.
-
Response content type: The transaction content type. If the client request is for text/html, then the response from the server must be text/html.
-
Frontend SSL Protocol Version: The SSL protocol version used by the clients. For example: SSLv3.
-
Frontend SSL Cipher Strength: The cipher strength based on the SSL certificate key size such as high, medium, and low.
-
Frontend SSL Key Strength: The SSL cipher strength is calculated from the SSL certificate key size. The key length defines the SSL algorithm security. For example: 2048
-
Frontend SSL Failure: The front-end SSL handshake error message. For example: SSL CLIENTAUTH FAILURE
-
Frontend SSL Certificate Type: The certificate type used by the client. For example: RSA, DSA, ECDSA, DH.
-
Backend SSL Protocol Version: The SSL protocols used by the server. For example: SSLv3
-
Backend SSL Cipher Strength: The cipher strength based on the SSL certificate key size such as high, medium, and low.
-
Backend SSL Key Strength: The SSL cipher strength is calculated from the SSL certificate key size. The key length defines the SSL algorithm security. For example: 2048
-
Backend SSL Certificate Type: The certificate type used by the server. For example: RSA, DSA, ECDSA, DH.
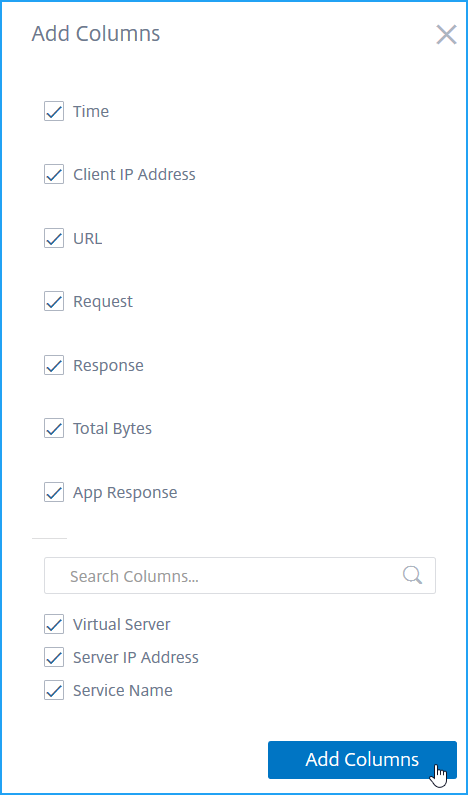
Add columns in the event list
You can click the  button to choose the list of options and click Add Columns to get the details displayed.
Advanced search
The Transaction Summary also has a search text box and time duration list, where you can view the events as per your requirement. When you place the cursor in the search box, the search box gives you a list of search suggestions. You can also use operators in your search queries to narrow the focus of your search.
The following are the operators you can use for your search queries:
| Operators | Description | Example | Output |
|---|---|---|---|
| = | Equals to some value | Virtual-Server = test | Displays the event for virtual server with the name “test”. |
|
|
Greater than some value | App-Response-Time > 500 | Displays the events for the applications that have the app response with more than 500 ms |
| < | Lesser than some value | App-Response-Time < 300 | Displays the events for the applications that have the app response time with less than 300 ms |
|
Greater or equal to some value | Total-Bytes >= 1024 | Displays the events for the transactions with greater or equal to 1 kb |
| <= | Less or equal to some value | Total-Bytes <= 1024 | Displays the events for the transactions with lesser or equal to 1 kb |
| != | Not equal to some value | Response-code != 200 | Displays the events with all transactions, except the failed transactions. |
| ~ | Contains some value | Virtual-Server ~ mas | Displays the events for the virtual servers that have the name mas. |
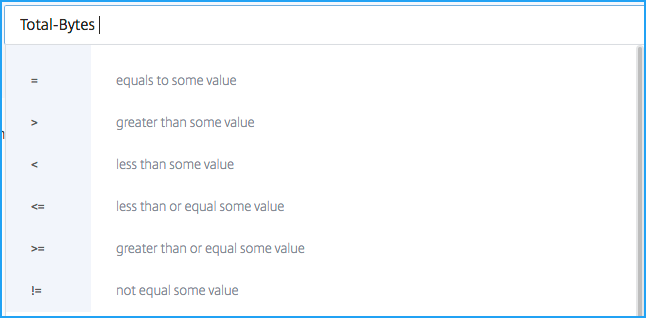
For example, let us consider a scenario that you wanted to generate events for total bytes that are lesser than 300 bytes. You must specify the search queries as follows:
-
Specify the required word in the search box to get the related suggestions.

-
Select Total-Bytes and click again on the search text box, and select <.
-
Type the value 300.

-
Select the time period and click Search to view the events based on your search query.
The search result is displayed.

Save search
After you use the suggestions and operators, you can save the search query. You can then use it later from the list, instead of using the suggestions and operators again.
-
To save a search query, click the bookmark icon, specify a name of your choice, and then click Save.

-
To use the search query from the list, click the icon and select the search query from the list to display the results.

-
To remove the search query, click the icon, hover the mouse pointer on the saved search query, click Remove.

You can also click the bookmark icon and click Remove.

Export data
You can export the web transaction analytics data for the selected duration by clicking the Export icon. You can export in PDF, PNG, JPEG, and CSV formats. The Export option enables you to do one of the following:
-
Select Export Now to view and export the report in PDF, JPEG, PNG, or CSV format.
-
Select Schedule Export tab to schedule the report daily, weekly, or monthly and send the report over an email or a Slack message.