Monitoring and Managing the Real-Time Status of Entities Configured on an SDX Appliance
The NetScaler SDX appliance can monitor and manage the states of virtual servers, services, service groups, and servers across the virtual appliances hosted on the SDX appliance. You can monitor values, such as the health of a virtual server and the time elapsed since the last state change of a service or service group. This gives you visibility into the real-time status of the entities and makes management of these entities easy when you have a large number of entities configured on your Citrix ADC instances.
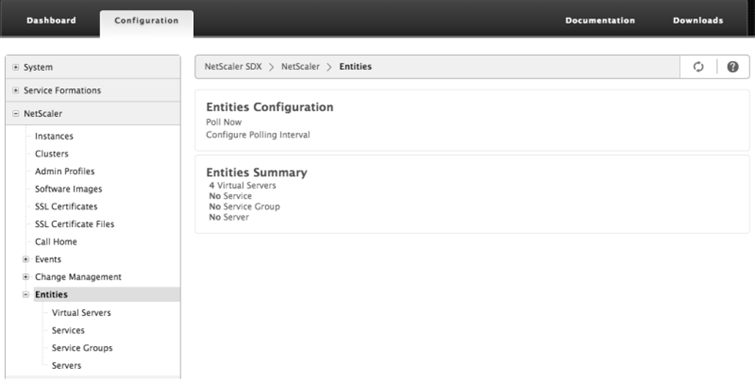
Viewing the Status of Virtual Servers
You can monitor the real-time values of the state and health of a virtual server. You can also view the attributes of a virtual server, such as name, IP address, and type of virtual server.
-
To view the status of a virtual server
- On the Configuration tab, in the navigation pane, click Citrix ADC > Entities > Virtual Servers.
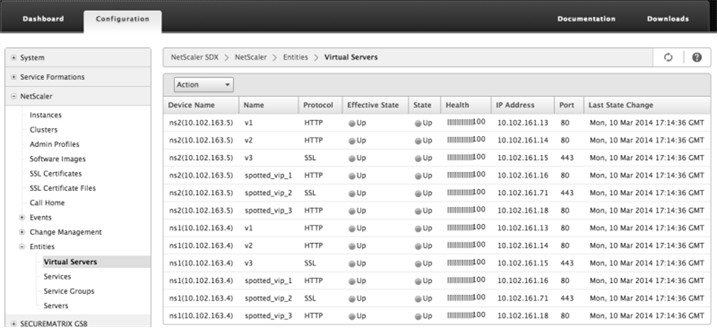
- In the right pane, under Virtual Servers, view the following statistics:
- Device Name—Name of the VPX on which the virtual server is configured.
- Name—Name of the virtual server.
- Protocol—Service type of the virtual server. For example, HTTP, TCP, and SSL.
- Effective State—Effective state of the virtual server, based on the state of the backup vservers. For example, UP, DOWN, or OUT OF SERVICE.
- State—Current state of the virtual server. For example, UP, DOWN, or OUT OF SERVICE.
- Health—Percentage of services that are in the UP state and are bound to the virtual server. The following formula is used to calculate the health percentage: (Number of bound UP services * 100) / Total bound services
- IP Address—IP address of the virtual server. Clients send connection requests to this IP address.
- Port—ort on which the virtual server listens for client conections.
- Last State Change—Elapsed time (in days, hours, minutes, and seconds) since the last change in the state of the virtual server, that is, the duration of time for which the virtual server has been in the current state. This information is available only for virtual servers configured on NetScaler release 9.0 and later.
-
Viewing Services and Service Groups Bound to a Virtual Server
You can monitor the real-time status of the services and service groups bound to a virtual server. This lets you check the state of the services that might cause the health percentage of a virtual server to become low, so that you can take appropriate action.
To view the services and service groups bound to a virtual server
- On the Configuration tab, in the left pane, click Citrix ADC > Entities > Virtual Servers.
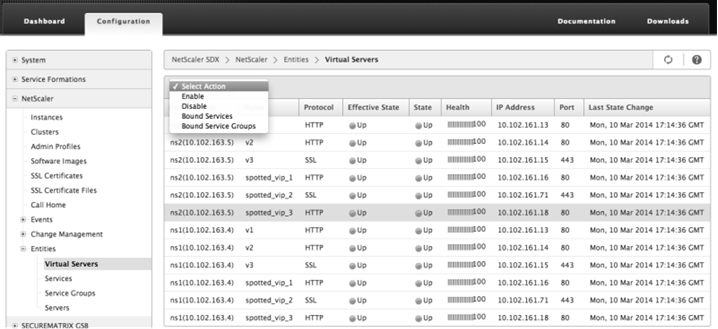
- In the details pane, under Virtual Servers, click the name of the virtual server for which you want to display the bound services and service groups, and under Actions, click Bound Services or Bound Services Groups. Alternatively, right-click the name of the virtual server, and then click Bound Services or Bound Services Groups.
Viewing the Status of Services
You can monitor the real-time values of the state of a service and the duration for which the service has been in the current state.
To view the status of virtual servers
- On the Configuration tab, in the navigation pane, click Citrix ADC > Entities > Service.
- In the details pane, under Services, view the following statistics:
- Device Name—Name of the device on which the service is configured.
- Name—Name of the service.
- Protocol—Service type, which determines the behavior of the service. For example, HTTP, TCP, UDP, or SSL.
- State—Current state of the service. For example, UP, DOWN, or OUT OF SERVICE.
- IP Address—IP address of the service.
- Port—Port on which the service listens.
- Last State Change—Elapsed time (in days, hours, minutes, and seconds) since the last change in the state of the service, that is, the duration of time for which the service has been in the current state.
-
Viewing the Virtual Servers to which a Service is Bound
You can view the virtual servers to which a service is bound and monitor the real-time status of the virtual servers.
To view the virtual servers to which a service is bound
-
On the Conifguration tab, in the navigation pane, click Citrix ADC > Entities > Service.
-
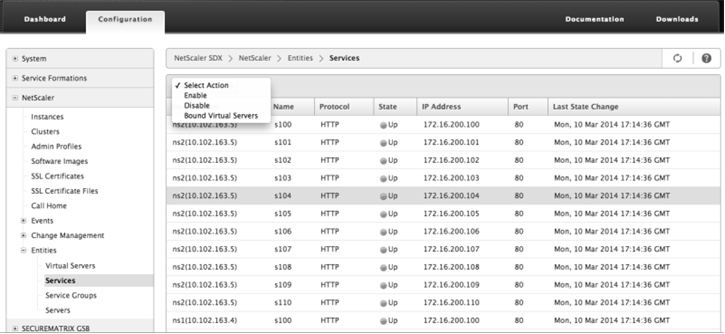
In the details pane, under Services, click the name of the service for which you want to view the bound virtual servers. Then from the Action menu, select Bound Virtual Servers. Alternatively, right-click the service, and then click Bound Virtual Servers.
-
Viewing the Status of Service Groups
You can monitor the real-time state of a service group member from the SDX interface.
To view the status of service groups
- On the Configuration tab, in the navigation pane, click Citrix ADC > Entities > Service Groups.
- In the details pane, under Service Groups, view the following statistics:
- Device Name—Name of the device on which the service group is configured.
- Name—Name of the service group.
- IP Address—IP address of each service that is a member of the service group.
- Port—Ports on which the service group members listen .
- Protocol—Service type, which determines the behavior of the service group. For example, HTTP, TCP, UDP, or SSL.
- Effective State—Effective state of the virtual server group, based on the state of the backup virtual servers. For example, UP, DOWN, or OUT OF SERVICE
- State—Effective state of the service group, which is based on the state of the member of the service group. For example, UP, DOWN, or OUT OF SERVICE.
- Last State Change—Elapsed time (in days, hours, minutes, and seconds) since the last change in the state of the service group member, that is, the duration of time for which the service group member has been in the current state. This information is available only for service group members configured on NetScaler release 9.0 and later.
-
Viewing the Virtual Servers to which a Service is Bound
You can view the virtual servers to which a service is bound and monitor the real-time status of the virtual servers.
To view the virtual servers to which the service is bound
- On the Configuration tab, in the left pane, click Citrix ADC > Entities > Servers.
- In the right pane, under Servers, select the server from the list, and under Actions menu, click Bound Virtual Services. Alternately, right-click the service and click Bound Virtual Servers.
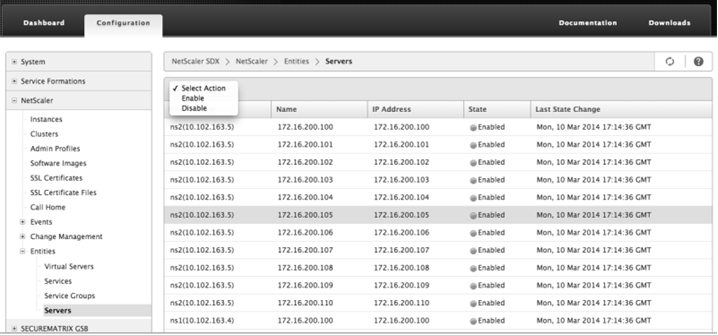
Viewing the Status of Servers
You can monitor and manage the states of servers across the Citrix® ADC instances. This gives you visibility into the real-time status of the servers and makes management of these servers easy when you have a large number of servers.
To view the status of servers
- On the Configuration tab, in the navigation pane, click Citrix ADC > Entities > Servers.
- In the details pane, under Servers, view the following statistics:
-
Device Name: Specifies the name of the device on which the server is configured.
-
Name: Specifies the name of the server.
-
IP Address: Specifies the IP address of the server. Clients send connection requests to this IP address.
-
State: Specifies the current state of the server. For example, UP, DOWN, and OUT OF SERVICE.
-
Last State Change: Specifies the time elapsed (in days, hours, minutes, and seconds) since the last change in the state of the server, that is, the duration of time for which the server is in the current state.
-
Configuring the Polling Interval
You can set the time interval for which you want the SDX appliance to poll the real-time values of the virtual servers, services, service groups, and servers. By default, the appliance polls the values every 30 minutes.
-
To configure the polling interval for virtual servers, services, service groups, and Servers.
- On the Configuration tab, click Citrix ADC > Entities, and in the right pane, click Configure Polling Interval.
- In the Configure Polling Interval dialog box, type the number of minutes you want to set as the time interval for which SDX must poll the entity value. Minimum value of the polling interval is 30 minutes. Click OK.