
-
Getting Started with NetScaler
-
Solutions for Telecom Service Providers
-
Load Balance Control-Plane Traffic that is based on Diameter, SIP, and SMPP Protocols
-
Provide Subscriber Load Distribution Using GSLB Across Core-Networks of a Telecom Service Provider
-
Authentication, authorization, and auditing application traffic
-
Basic components of authentication, authorization, and auditing configuration
-
Web Application Firewall protection for VPN virtual servers and authentication virtual servers
-
On-premises NetScaler Gateway as an identity provider to Citrix Cloud™
-
Authentication, authorization, and auditing configuration for commonly used protocols
-
Troubleshoot authentication and authorization related issues
-
Troubleshoot authentication, authorization and auditing issues
-
Configure EULA as an authentication factor in NetScaler nFactor system
-
Configure periodic Endpoint Analysis scan as a factor in nFactor authentication
-
Configure post-authentication Endpoint Analysis scan as a factor in NetScaler nFactor authentication
-
Configure pre-authentication Endpoint Analysis scan as a factor in nFactor authentication
-
Configure pre-auth and post-auth EPA scan as a factor in nFactor authentication
-
Configure prefill user name from certificate in NetScaler nFactor authentication
-
Localize error messages generated by NetScaler nFactor system
-
Configure NetScaler Gateway preauthentication EPA scan for the domain check
-
-
-
-
Cluster setup and usage scenarios
-
Common interfaces for client and server and dedicated interfaces for backplane
-
Common switch for client and server and dedicated switch for backplane
-
Monitoring services in a cluster using path monitoring
-
-
-
Persistence and persistent connections
-
Advanced load balancing settings
-
Gradually stepping up the load on a new service with virtual server–level slow start
-
Protect applications on protected servers against traffic surges
-
Retrieve location details from user IP address using geolocation database
-
Use source IP address of the client when connecting to the server
-
Use client source IP address for backend communication in a v4-v6 load balancing configuration
-
Set a limit on number of requests per connection to the server
-
Configure automatic state transition based on percentage health of bound services
-
-
Use case 2: Configure rule based persistence based on a name-value pair in a TCP byte stream
-
Use case 3: Configure load balancing in direct server return mode
-
Use case 6: Configure load balancing in DSR mode for IPv6 networks by using the TOS field
-
Use case 7: Configure load balancing in DSR mode by using IP Over IP
-
Use case 10: Load balancing of intrusion detection system servers
-
Use case 11: Isolating network traffic using listen policies
-
Use case 12: Configure Citrix Virtual Desktops for load balancing
-
Use case 13: Configure Citrix Virtual Apps and Desktops for load balancing
-
Use case 14: ShareFile wizard for load balancing Citrix ShareFile
-
Use case 15: Configure layer 4 load balancing on the NetScaler appliance
-
-
-
-
Create a certificate signing request and use SSL certificates on a NetScaler appliance
-
Configure SSL acceleration with HTTP on the front end and SSL on the back end
-
Export certificates used on a NetScaler appliance as PFX file
-
Configure SSL monitoring when client authentication is enabled on the back-end service
-
Configure SSL action to forward client traffic if a cipher is not supported on the ADC
-
Configure synchronization of files in a high availability setup
-
-
-
Authentication and authorization for System Users
-
-
Configuring a CloudBridge Connector Tunnel between two Datacenters
-
Configuring CloudBridge Connector between Datacenter and AWS Cloud
-
Configuring a CloudBridge Connector Tunnel Between a Datacenter and Azure Cloud
-
Configuring CloudBridge Connector Tunnel between Datacenter and SoftLayer Enterprise Cloud
-
Configuring a CloudBridge Connector Tunnel Between a NetScaler Appliance and Cisco IOS Device
-
CloudBridge Connector Tunnel Diagnostics and Troubleshooting
This content has been machine translated dynamically.
Dieser Inhalt ist eine maschinelle Übersetzung, die dynamisch erstellt wurde. (Haftungsausschluss)
Cet article a été traduit automatiquement de manière dynamique. (Clause de non responsabilité)
Este artículo lo ha traducido una máquina de forma dinámica. (Aviso legal)
此内容已经过机器动态翻译。 放弃
このコンテンツは動的に機械翻訳されています。免責事項
이 콘텐츠는 동적으로 기계 번역되었습니다. 책임 부인
Este texto foi traduzido automaticamente. (Aviso legal)
Questo contenuto è stato tradotto dinamicamente con traduzione automatica.(Esclusione di responsabilità))
This article has been machine translated.
Dieser Artikel wurde maschinell übersetzt. (Haftungsausschluss)
Ce article a été traduit automatiquement. (Clause de non responsabilité)
Este artículo ha sido traducido automáticamente. (Aviso legal)
この記事は機械翻訳されています.免責事項
이 기사는 기계 번역되었습니다.책임 부인
Este artigo foi traduzido automaticamente.(Aviso legal)
这篇文章已经过机器翻译.放弃
Questo articolo è stato tradotto automaticamente.(Esclusione di responsabilità))
Translation failed!
Monitoring services in a cluster using path monitoring
In a cluster setup, ownership for monitoring services is distributed among the nodes. Therefore, different nodes monitor different services. The node that monitors a service is called the service owner. Only the service owner probes the server to monitor the status of the services assigned to it. It further communicates the status of the services to all other nodes within the cluster. The drawback with distributed monitoring is that the network connectivity and link state between all nodes and the server is not determined. To overcome this drawback, you can use path monitoring.
Note
You cannot select a node to monitor a service. The selection of nodes to monitor a service is done through an internal mechanism. You can see the owner node to monitor services by using the
show service <service name>andshow serviceGroup <service group name>command.
Path monitoring checks the network connectivity and link state between a node and the service provided by the server. A node sends ICMP pings to verify whether the server is reachable or not.
How path monitoring works
Consider an example of a NetScaler cluster consisting of three nodes N1, N2, and N3. N2 is the service owner that monitors the state of HTTP services (S1). It advertises the service state to other nodes in the cluster. Path monitoring is enabled on all nodes in the cluster, for all the services. Each node sends only an ICMP ping to the server. The service owner sends both the HTTP service request and an ICMP ping. Each node reports its path monitoring state to the service owner.
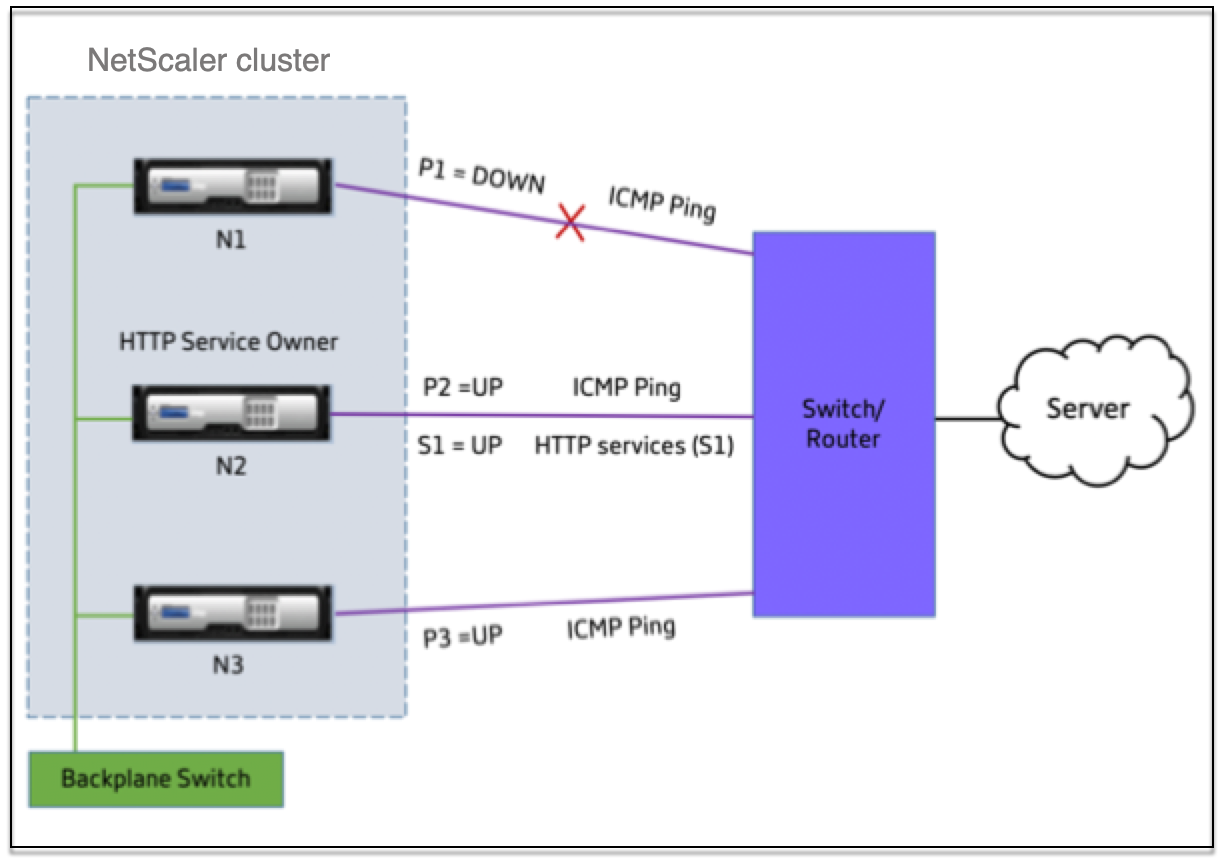
The following two parameters determine the service state of a node:
- S = service state advertised by the service owner
- P = path monitoring state of each node
Whether a node can reach a server or not, determines the path monitoring state for that node.
The following table shows the service state set based on the path monitoring state, when the pathMonitorIndv parameter is enabled or disabled.
| Parameter | Path monitoring state | Service state |
|---|---|---|
| pathMonitorIndv = NO; Is the default configuration. | P1 = DOWN | S1 = DOWN |
| P2 = UP | S1 = DOWN | |
| P3 = UP | S1 = DOWN | |
| pathMonitorIndv = YES | P1 = DOWN | S1 = DOWN |
| P2 = UP | S1 = UP | |
| P3 = UP | S1 = UP |
In this example, the service owner decides the service state for all the nodes based on the node whose path monitoring state is set to DOWN. If the path monitoring state for any of the nodes is DOWN, then the service owner sets the service state for all the nodes as DOWN. The service state for all the nodes is set to UP only if the path monitoring state for each of the node is UP.
You can use path monitoring for individual nodes by enabling the pathMonitorIndv parameter. This parameter enables the service owner to set the service state for each node based on the path monitoring state of that respective node.
Note
If the pathMonitorIndv parameter is set, some features like persistence might break.
Configuring path monitoring
Path monitoring is applicable for all the services and service groups. Path monitoring parameter is disabled by default.
To enable path monitoring for services/service groups by using the CLI
At the command prompt, type:
add service <service name> <IP address> <service type> <port> [-pathMonitor <YES | NO>] [-pathMonitorIndv <YES | NO>]
add servicegroup <servicegroup name> <service type> [-pathMonitor <YES | NO>] [-pathMonitorIndv <YES | NO>]
<!--NeedCopy-->
Example:
add service s1 1.1.1.1 HTTP 80 -pathMonitor YES
add servicegroup sg_1 HTTP -pathMonitor YES
add service s1 1.1.1.1 HTTP 80 -pathMonitor YES -pathMonitorIndv YES
add servicegroup sg_1 HTTP -pathMonitor YES -pathMonitorIndv YES
<!--NeedCopy-->
You can also set the path monitoring parameter from the set command, as follows:
set service <service name> [-pathMonitor <YES | NO>] [-pathMonitorIndv <YES | NO>]
set servicegroup <servicegroup name> [-pathMonitor <YES | NO>] [-pathMonitorIndv <YES | NO>]
<!--NeedCopy-->
Example:
set service s1 -pathMonitor YES
set servicegroup sg_1 -pathMonitor YES
set service s1 -pathMonitorIndv YES
set servicegroup sg_1 -pathMonitorIndv NO
<!--NeedCopy-->
To enable path monitoring for services/service groups by using the GUI
-
Navigate to Traffic Management > Load Balancing > Services.
For service groups, navigate to Traffic Management > Load Balancing > Service Groups.
- In the Services/Service Groups pane, select a service/service group from the list, and then double-click to open it.
- On the Service Settings tab, click Edit.
- Select Path Monitoring.
- Select Individual Path Monitoring, if you want to apply it, and then click OK.
Note
You can enable Individual Path Monitoring only if you enable Path Monitoring.
Share
Share
This Preview product documentation is Cloud Software Group Confidential.
You agree to hold this documentation confidential pursuant to the terms of your Cloud Software Group Beta/Tech Preview Agreement.
The development, release and timing of any features or functionality described in the Preview documentation remains at our sole discretion and are subject to change without notice or consultation.
The documentation is for informational purposes only and is not a commitment, promise or legal obligation to deliver any material, code or functionality and should not be relied upon in making Cloud Software Group product purchase decisions.
If you do not agree, select I DO NOT AGREE to exit.