Link performance report
Citrix SD-WAN™ Center can show performance statistics at the site, service, virtual path, or WAN-link level.
Consider a network in which organization ABC has four branch offices. Brownouts have been reported at SITE3. That is, the employees are sometimes unable to view the intranet pages. You suspect that it’s because of the performance of the underlying links.
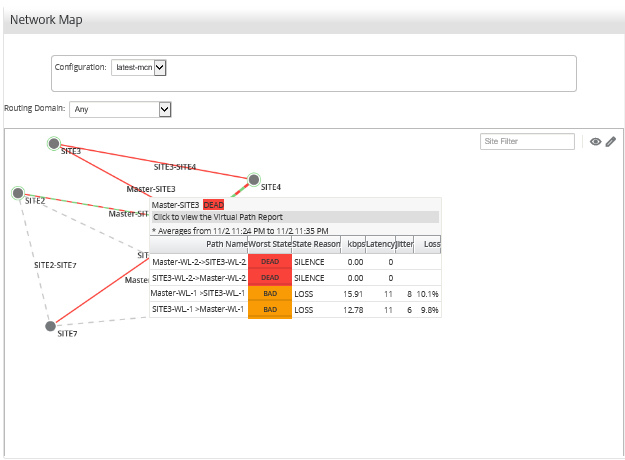
You can get a high-level view of the link statistics by hovering your mouse cursor over the path between a site and the data center on the Network Map on the Dashboard.

The above screen shot shows that there are two WAN links (WL-1 and WL-2) between SITE 3 and the Master Controller Node (MCN), and displays statistics for the most recent 10 minutes.
The virtual paths Master-WL2->SITE3-WL2 and SITE3-WL2 ->Master-WL2 are not functioning, and alternative paths Master-WL1->SITE3-WL1 and SITE3-WL1 ->Master-WL1 are in poor condition, losing a significant percentage of the transmitted data. That is the probable cause of the brown-out issue at SITE3.
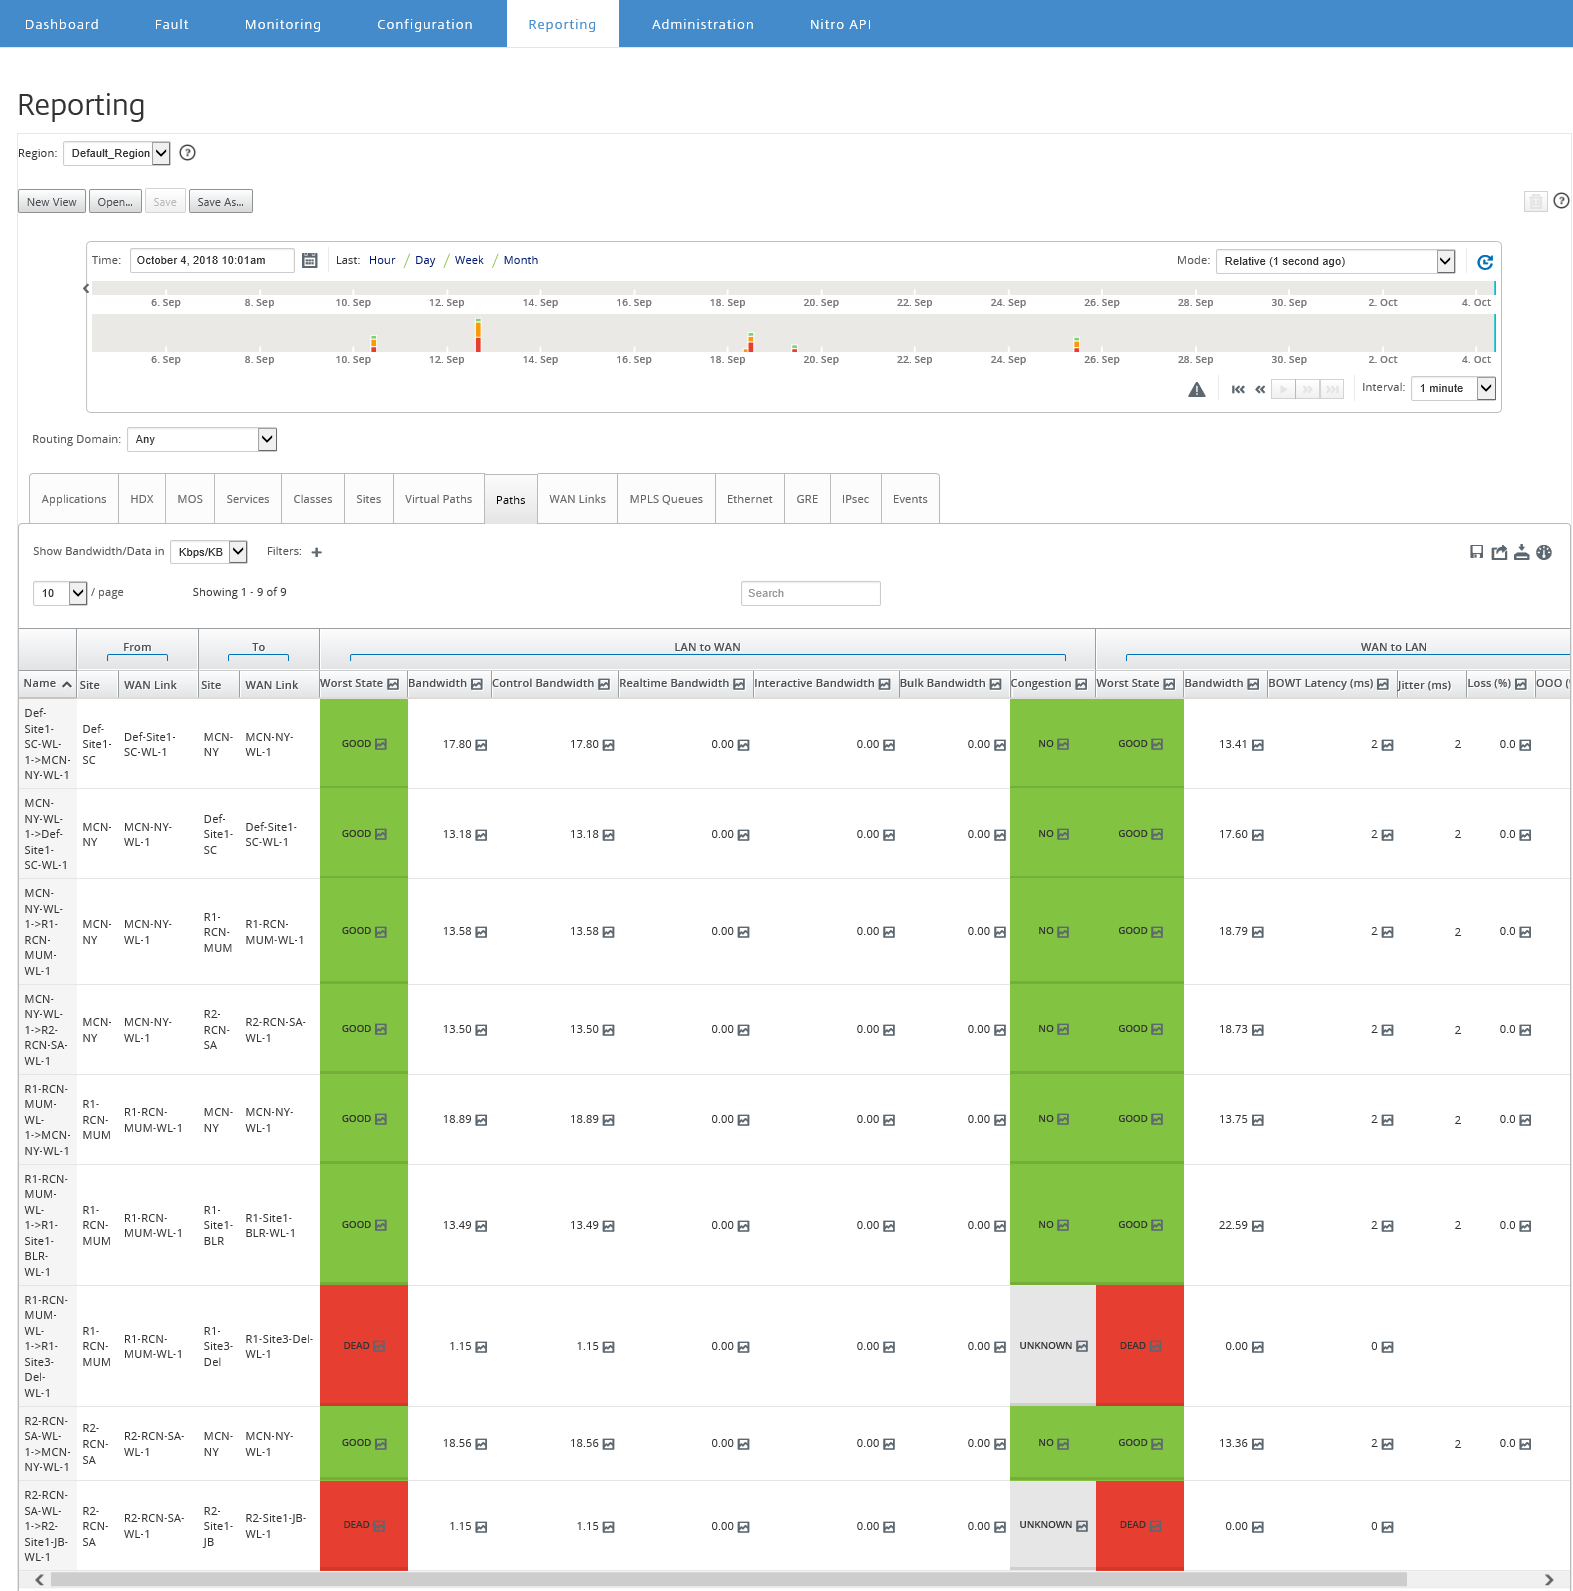
Alternatively, you can view the link statistics by navigating to Reporting >Paths.
In the timeline control select a time period.
You can select and view reports of a particular time frame by using the timeline controls. For more information, see, Timeline controls.
You can also create, save and open report views. For more information, see, Manage views.

You can view the following metrics:
- Name: The path name.
- From (Site and WAN Link): The source site and WAN link.
- To (Site and WAN Link): The destination site and WAN link.
-
LAN to WAN
- Work State:
- Bandwidth: Total bandwidth consumed by all packet types. Bandwidth= Control Bandwidth + Real-time Bandwidth + Interactive Bandwidth + Bulk Bandwidth.
- Control Bandwidth: Bandwidth used to transfer control packets that contain routing, scheduling, and link statistics information.
- Real-time Bandwidth: Bandwidth consumed by applications that belong to the real-time class type in the SD-WAN configuration. The performance of such applications depends on a great extent upon network latency. A delayed packet is worse than a lost packet (for example, VoIP, Skype for Business).
- Interactive Bandwidth: Bandwidth consumed by applications that belong to the interactive class type in the SD-WAN configuration. The performance of such applications depends on a great extent upon network latency, and packet loss (for example, XenDesktop®, XenApp).
- Bulk Bandwidth: Bandwidth consumed by applications that belong to the bulk class type in the SD-WAN configuration. These applications involve very little human intervention and are mostly handled by the systems themselves (for example, FTP, backup operations).
- Congestion: Congestion due to increased traffic or unexpected delay in packet flow in the WAN.
-
WAN to LAN:
- Worst State: The worst WAN to LAN state observed during the time period.
- Bandwidth:
- BOWT Latency(ms): Best one-way time (BOWT) taken for a packet to move from one point to another, in milliseconds.
- Jitter (ms): Variation in the delay of received packets, in milliseconds.
- Loss (%): Percentage of packets lost.
- OOO (%): Percentage of packets that are not in the right order or out of order (OOO).
- Congestion: Congestion due to increased traffic or unexpected delay in packet flow in the WAN.
Click on Settings icon and select the parameters that you wants to view on reports.