Use events dashboard
As a network administrator, you can view details such as configuration changes, login conditions, hardware failures, threshold violations, and entity state changes on your NetScaler instances, along with events and their severity on specific instances. You can use the NetScaler Console’s events dashboard to view reports generated for critical event severity details on all your NetScaler instances.
To view the details on the events dashboard:
Navigate to Infrastructure > Events > Reports.
The Top 10 Devices graph on the dashboard displays a report of the top 10 instances by the number of events generated on them. You can click an instance on the graph to view further details of the event’s severity.
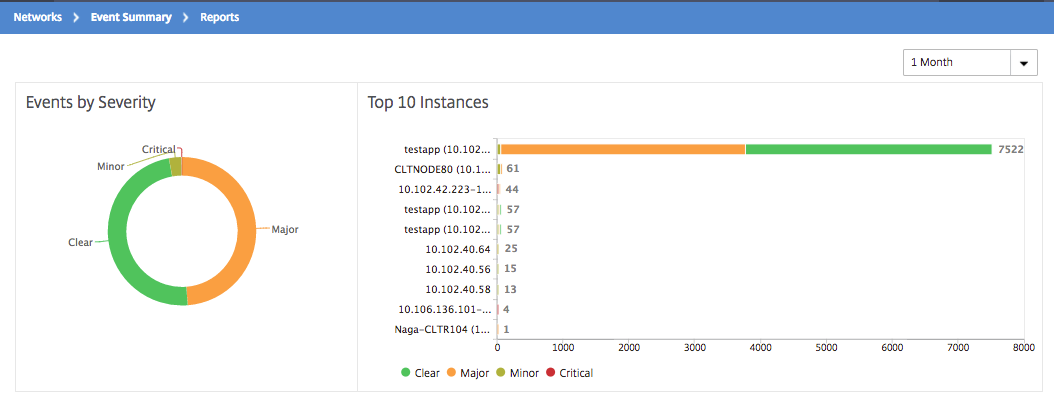
You can view more details by navigating to the NetScaler instance type (Infrastructure > Events > Reports \> NetScaler/ NetScaler SDX) to view the following:
-
Top 10 devices by hardware failure
-
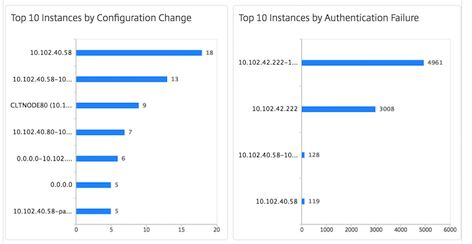
Top 10 devices by configuration change
-
Top 10 devices by authentication failure
-
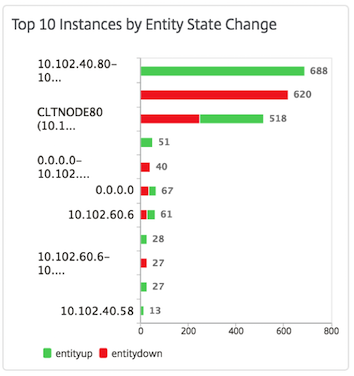
Top 10 devices by entity state changes
-
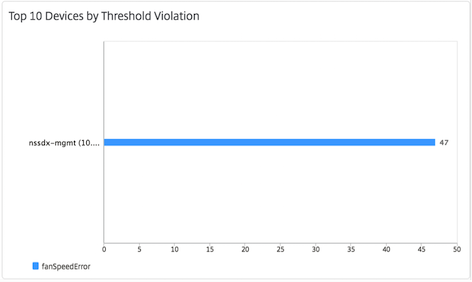
Top 10 devices by threshold violation