
Enhanced Infrastructure Analytics with new indicators
Using the NetScaler Console Infrastructure Analytics, you can:
-
View a new set of operational issues that occur in NetScaler instances.
-
View error messages and check recommendations to troubleshoot the issues.
As an administrator, you can quickly identify the root cause analysis of issues.
Note
Rule indicators are not supported for:
-
NetScaler instances configured in a cluster mode.
-
NetScaler instances configured with admin partitions.
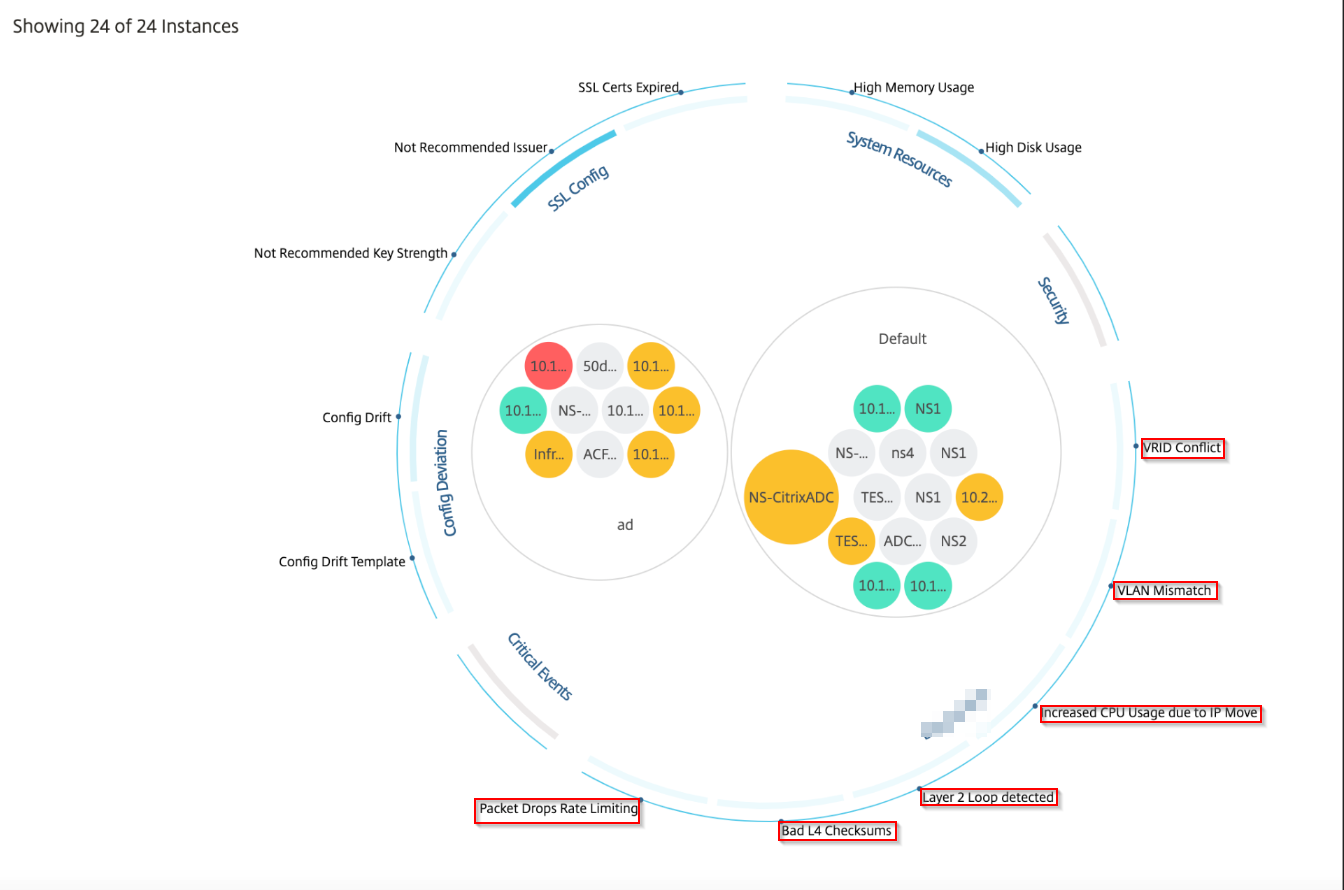
In NetScaler Console, navigate to Infrastructure > Infrastructure Analytics to view indicators for:
| Indicator name in Infrastructure Analytics | Description |
|---|---|
| Port allocation failure | Detects when NetScaler uses SNIP to communicate with a new server connection and total ports available on that SNIP are exhausted. The recommended action is to add another SNIP in the same subnet. |
| No default route configuration | Detects when the traffic gets dropped because of non-availability of routes. |
| IP conflict | Detects if a same IP address is configured or applied on two or more instances in a network. |
| VRID conflict | Detects when intermittent access problems occur for the specified VRID. |
| VLAN mismatch | Detects if any errors occur during VLAN configuration bound to IP subnets. |
| TCP small window attack | Detects when there is a possible small window attack in progress. This alert is just for informational, because NetScaler already mitigates this attack. |
| Rate control threshold | Detects when packets are dropped based on the configured rate control threshold. |
| Persistence Limit | Detects when maximum hits are imposed on the NetScaler memory. |
| GSLB site name mismatch | Detects when GSLB configuration synchronization failures occur because of site name mismatch. |
| Malformed IP header | Detects when sanity checks on IPv4 packets are failed. |
| Bad L4 checksums | Detects when checksum validation for TCP packets is failed. |
| Increased CPU usage due to IP move | Detects if a large number of macs need to be updated. |
| Excessive packet steering | Detects high levels of software packet steering due to the usage of asymmetric rss key type. |
| Layer 2 loop | Detects the presence of layer 2 loops in the network. |
| Tagged VLAN mismatch | Detects when tagged VLAN packets are received on an untagged interface. |
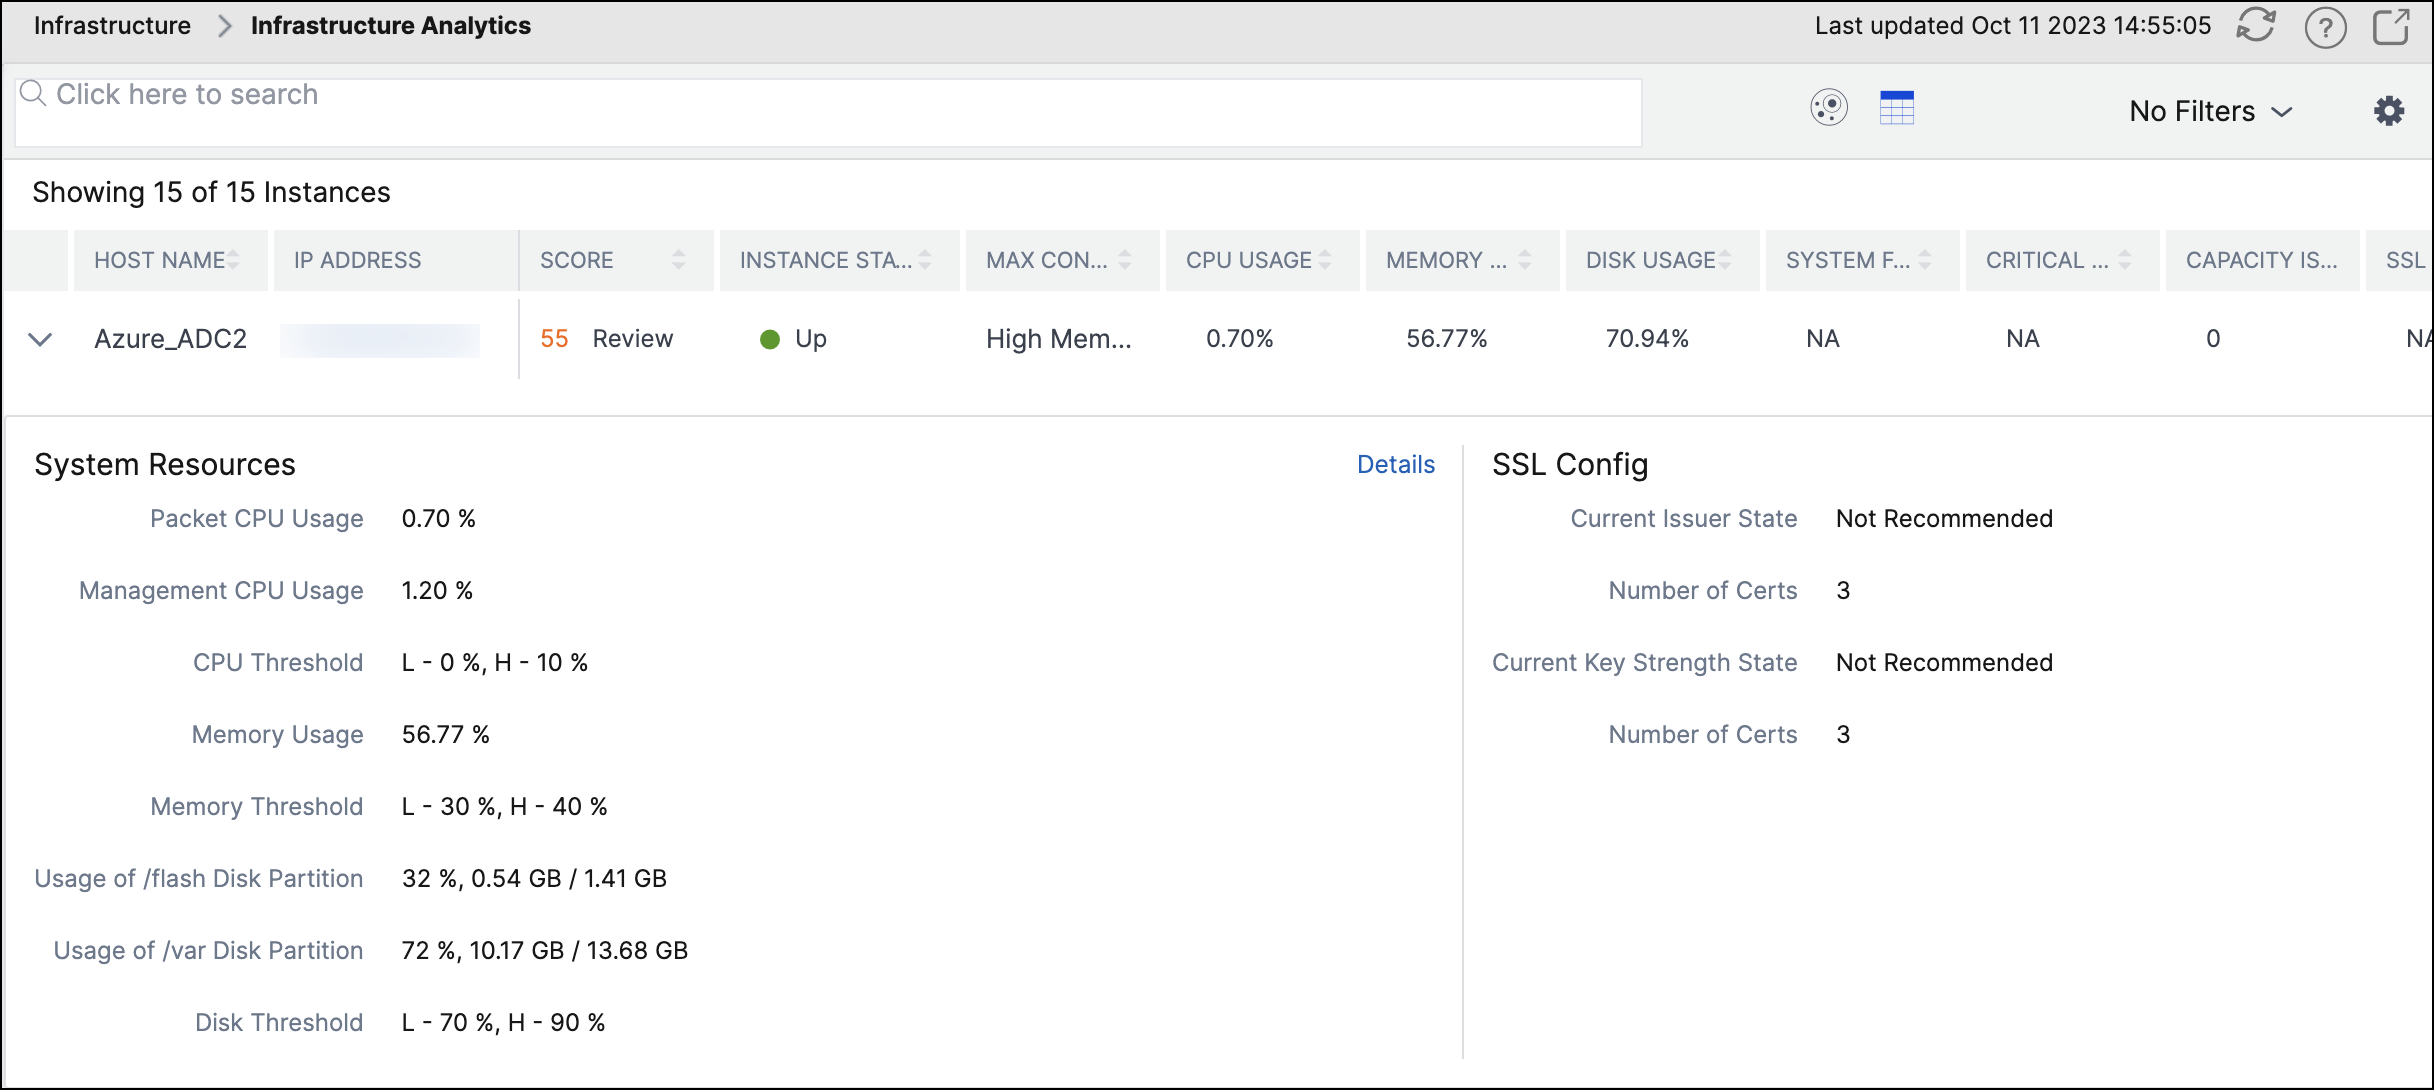
Tabular view
You can also view anomalies using the tabular view option in Infrastructure Analytics. Navigate to Infrastructure > Infrastructure Analytics and then click  to display all managed instances. Click
  to expand for details.
to display all managed instances. Click to expand for details.
View details of an anomaly
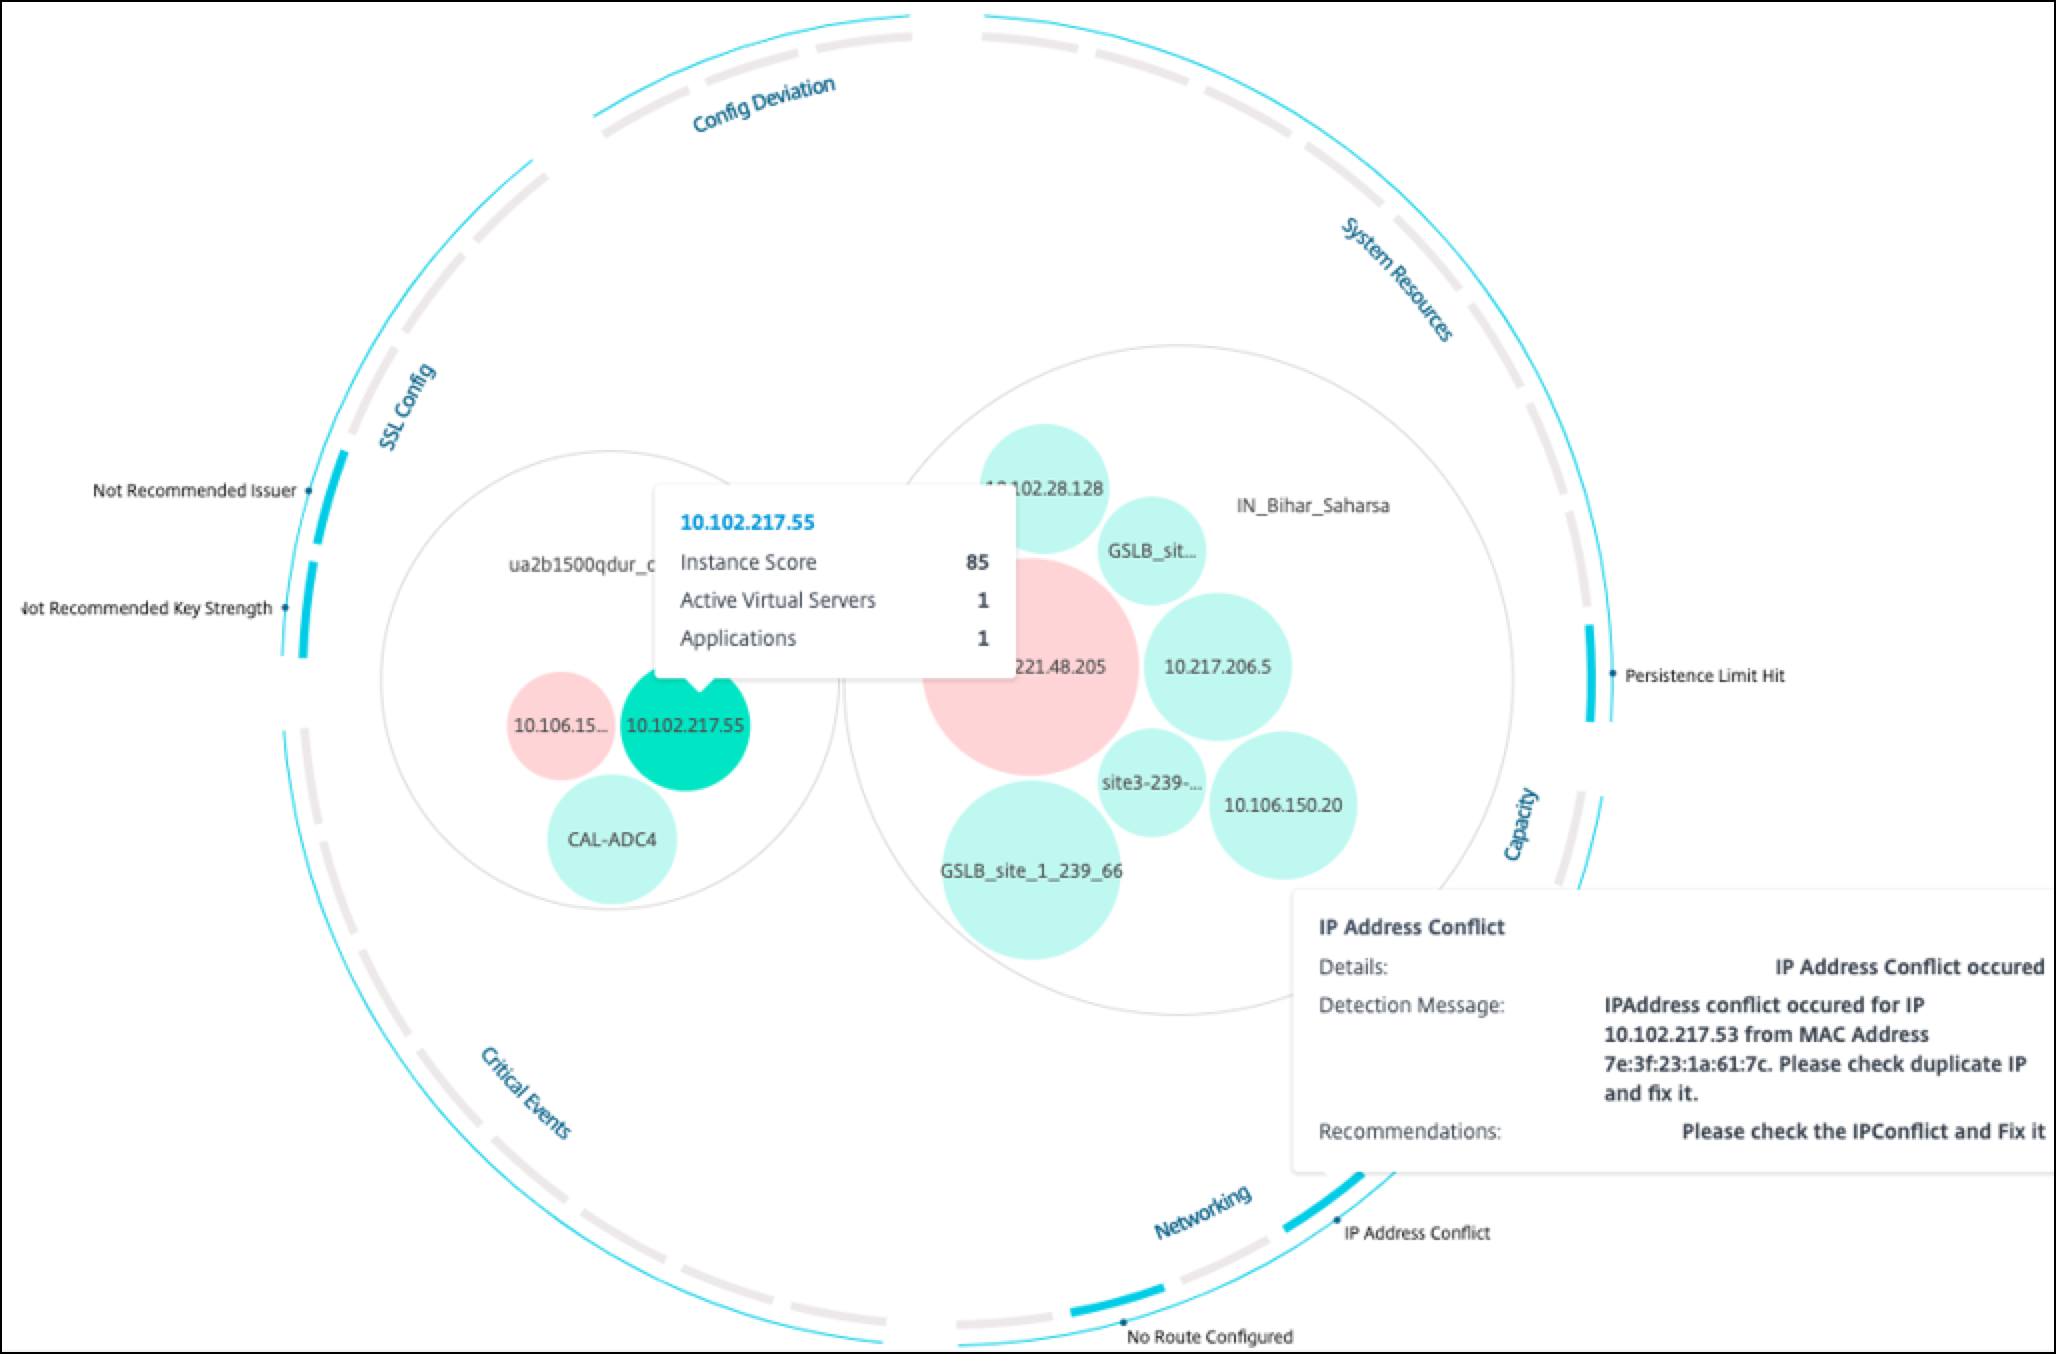
For example, if you want to view details for IP address conflict in the network, click the anomaly that is displayed for IP address conflict to view the details.
-
Details - Indicates what anomaly is detected
-
Detection Message - Indicates the MAC address for which the IP address has the conflict
-
Recommendations - Indicates the action item to resolve this IP address conflict