Monitor CPU, memory, and disk usage
You can use the information maintained in logs and statistics. This information is also displayed in reports that helps you to configure and maintain NetScaler Console.
To monitor CPU, memory, and disk usage,
-
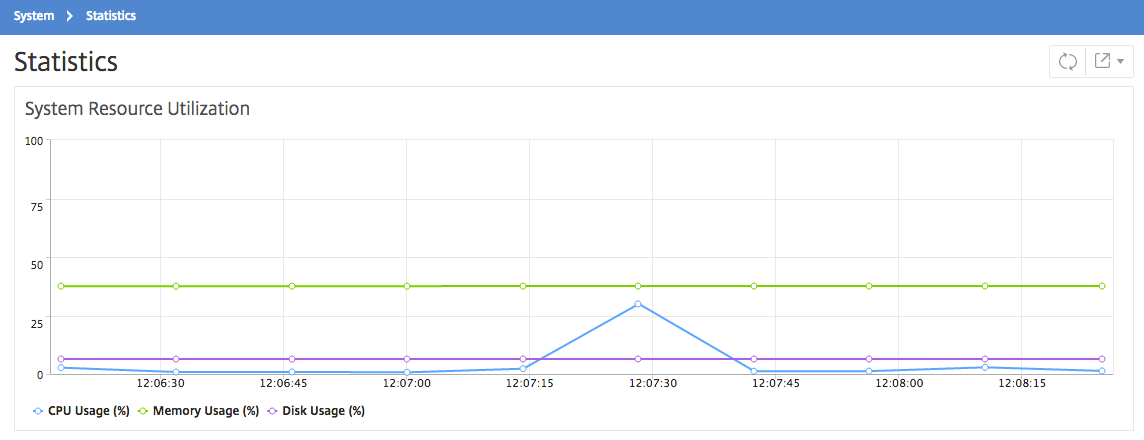
Standalone deployment. Navigate to System \> Statistics. You can view real-time CPU, memory, and disk utilization charts.
-
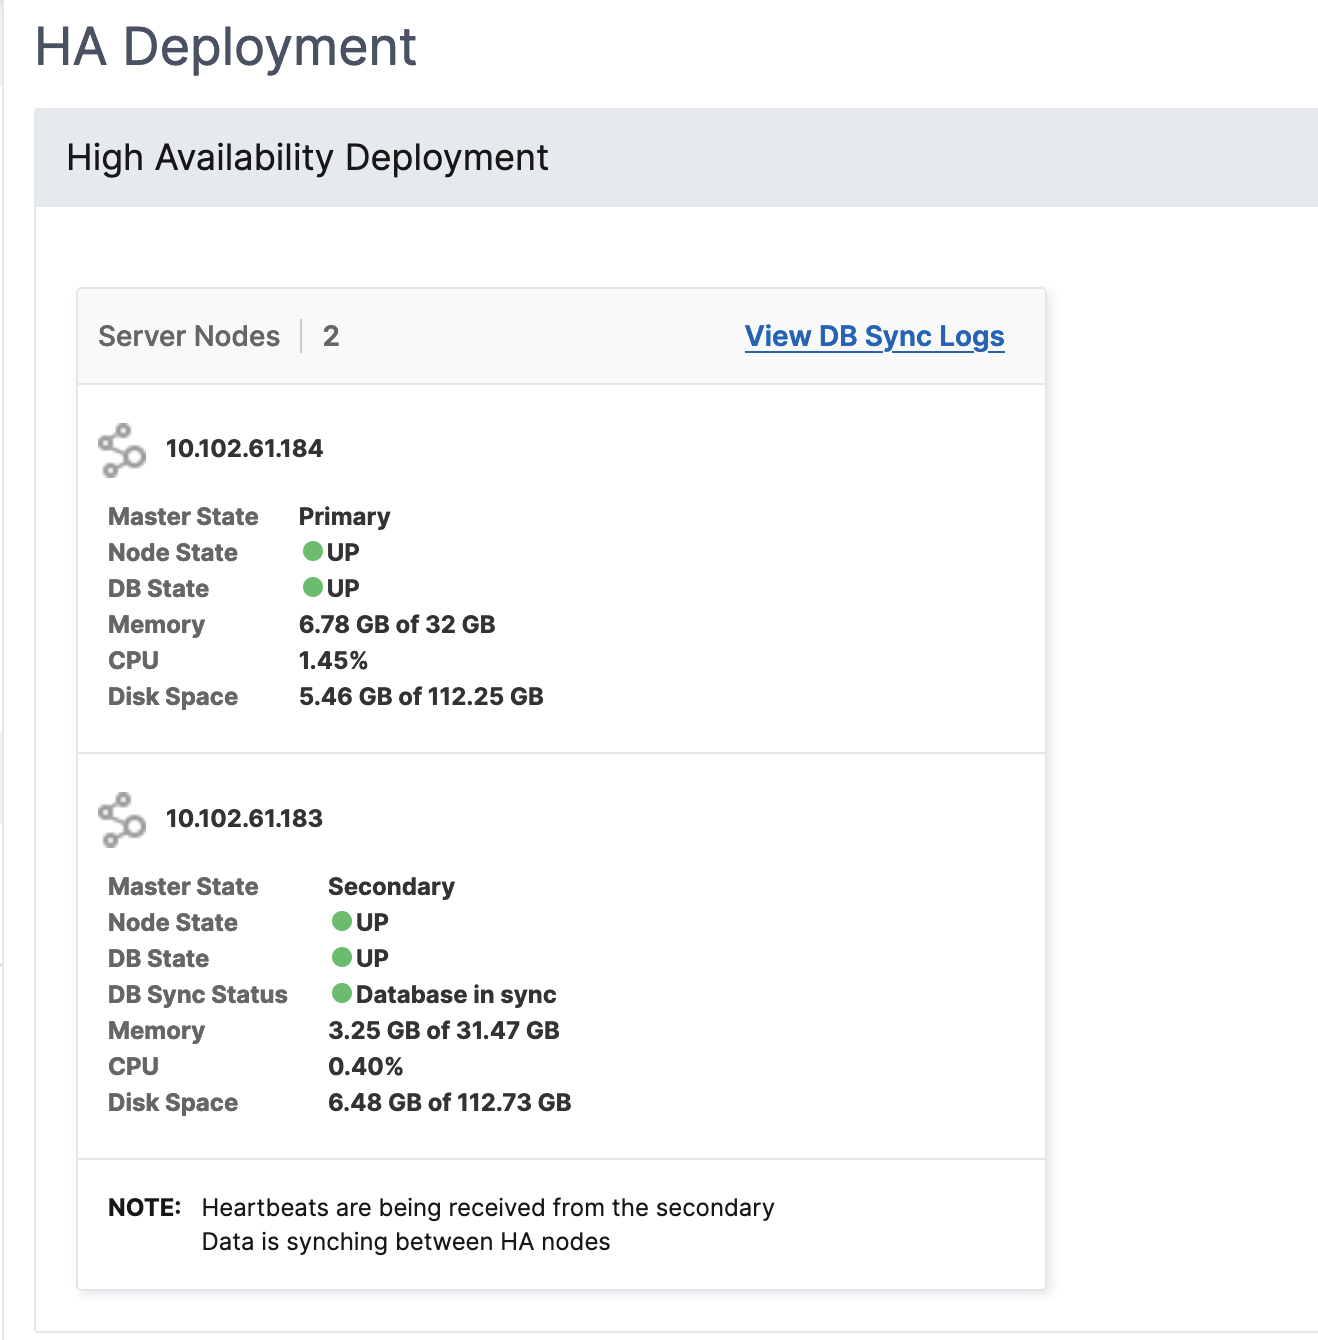
High availability deployment. Navigate to Settings > Deployment. The statistics for memory, CPU, disk space, and managed instances are displayed numerically as shown in the following figure: