All Violations
The All Violations page displays the application security violation details based on the Network, WAF, and Bot categories.
Violation categories
NetScaler Console enables you to view the following violations. Under Violation Details, you can click each violation tab to view the violation details.
| Network | WAF | Bot |
|---|---|---|
| HTTP Slow Loris | CSRF Form Tagging | Marketing |
| DNS Slow Loris | Deny URL | Scraper |
| HTTP Slow Post | Form Field Consistency | Screenshot Creator |
| NXDomain Flood Attack | Field Formats | Search Engine |
| HTTP desync attack | Cookie Hijack | Feed Fetcher |
| Bleichenbacher Attack | Infer Content Type XML | Link Checker |
| Segment smack Attack | Buffer Overflow | Service Agent |
| SYN Flood Attack | Content Type | Site Monitor |
| Small Window Attack | Cookie Consistency | Speed Tester |
| Safe Object | Tool | |
| HTML SQL Inject | Uncategorized | |
| Start URL | Virus Scanner | |
| Cross-site scripting | Vulnerability Scanner | |
| XML DoS | DeviceFP Wait Exceeded | |
| XML Format | Invalid DeviceFP | |
| XML WSI | Invalid Captcha Response | |
| XML SSL | Captcha Attempts Exceeded | |
| XML Attachment | Valid Captcha Response | |
| XML SOAP Fault | Captcha Client Muted | |
| XML Validation | Captcha Wait Time Exceeded | |
| Others | Request Size Limit Exceeded | |
| IP Reputation | Rate Limit Exceeded | |
| HTTP DOS | Block list (IP, subnet, policy expression) | |
| TCP Small Window | Allow list (IP, subnet, policy expression) | |
| Signature Violation | Zero Pixel Request | |
| File Upload Type | Source IP | |
| JSON cross-site scripting | Host | |
| JSON SQL | Geo Location | |
| JSON DOS | URL | |
| Command Injection | Crawler | |
| Maximum Uploads | ||
| Referrer Header | ||
| Safe Commerce |
Security violations dashboard
In the security violations dashboard, you can view:
-
Total violations occurred across all NetScaler instances and applications. The total violations are displayed based on the selected time duration.
-
Total violations.
-
Total NetScaler instances affected, total applications affected, and top violations based on the total occurrences and the affected applications.
Violation details
For each violation, NetScaler Console monitors the behavior for a specific time duration and detects violations for unusual behaviors. Click each tab to view the violation details. You can view details such as:
-
The total occurrences, last occurred, and total applications affected.
-
Under event details, you can view:
-
The affected application. You can also select the application from the list if two or more applications are affected with violations.
-
The graph indicating violations.Drag and select on the graph that lists the violations to narrow down the violation search.
Drag and select on graph Search result 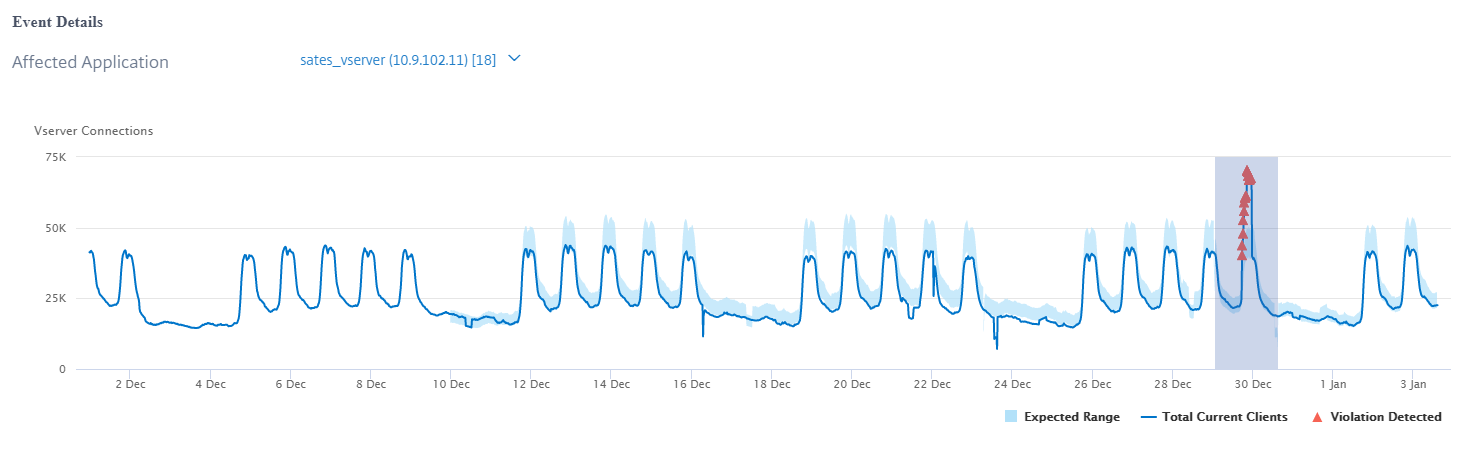
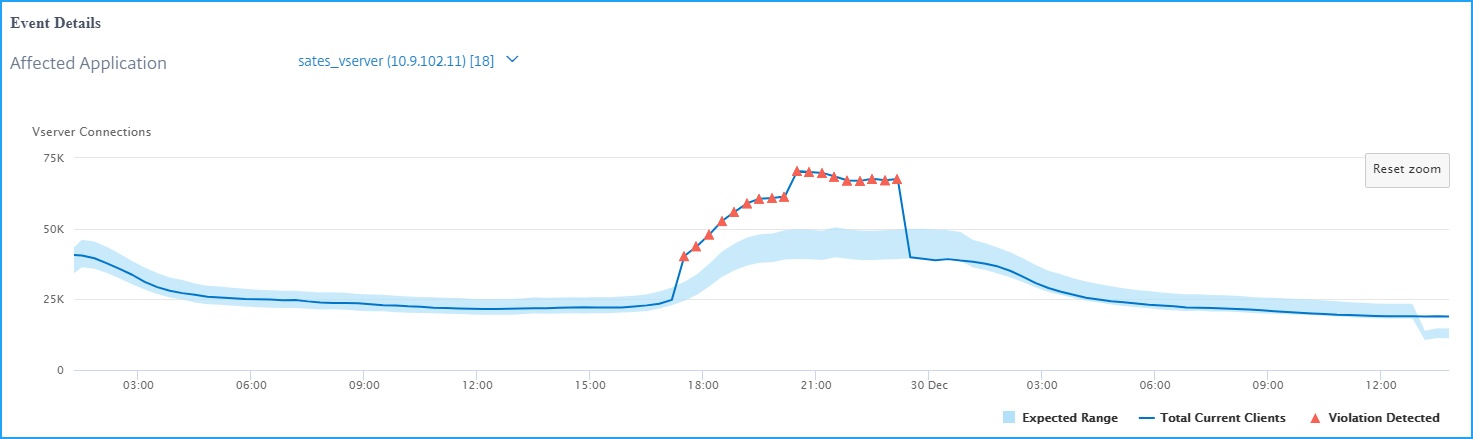 Click Reset Zoom to reset the zoom result.
 -
Recommended Actions that suggest you troubleshoot the issue.
-
Other violation details such as violence occurrence time and detection message.
-