-
-
Advanced policy expressions: Working with dates, times, and numbers
-
Advanced policy expressions: Parsing HTTP, TCP, and UDP data
-
Advanced policy expressions: IP and MAC Addresses, Throughput, VLAN IDs
-
-
This content has been machine translated dynamically.
Dieser Inhalt ist eine maschinelle Übersetzung, die dynamisch erstellt wurde. (Haftungsausschluss)
Cet article a été traduit automatiquement de manière dynamique. (Clause de non responsabilité)
Este artículo lo ha traducido una máquina de forma dinámica. (Aviso legal)
此内容已经过机器动态翻译。 放弃
このコンテンツは動的に機械翻訳されています。免責事項
이 콘텐츠는 동적으로 기계 번역되었습니다. 책임 부인
Este texto foi traduzido automaticamente. (Aviso legal)
Questo contenuto è stato tradotto dinamicamente con traduzione automatica.(Esclusione di responsabilità))
This article has been machine translated.
Dieser Artikel wurde maschinell übersetzt. (Haftungsausschluss)
Ce article a été traduit automatiquement. (Clause de non responsabilité)
Este artículo ha sido traducido automáticamente. (Aviso legal)
この記事は機械翻訳されています.免責事項
이 기사는 기계 번역되었습니다.책임 부인
Este artigo foi traduzido automaticamente.(Aviso legal)
这篇文章已经过机器翻译.放弃
Questo articolo è stato tradotto automaticamente.(Esclusione di responsabilità))
Translation failed!
Policy tracing
The policy tracing feature allows you to monitor and troubleshoot policies in real time. It helps you see which policies are checked during a transaction and what actions are taken based on those checks. This feature enables you to get a better understanding of how policies work and find ways to boost your application’s performance.
Some of the benefits of this feature are as follows:
- Troubleshooting issues: When you experience issues with application behavior, policy tracing helps pinpoint which policies were applied or skipped.
- Validation of policy configurations: Before deploying changes, tracing can validate that new policies operate as expected within the existing workflows.
- Performance monitoring: Tracking which policies are frequently evaluated can help optimize performance by identifying redundant or conflicting policies.
Policy tracing using the CLI
The following commands enable you to manage the policy tracing process.
To start policy tracing, use the following command:
start policy tracing -filterExpr <expr> [-protocolType <protocolType>] [-captureSSLHandshakePolicies <yes/no>]
<!--NeedCopy-->
-
<expr>: This filter expression specifies the conditions under which tracing data is collected. Data is collected only when the expression evaluates to True, and it also clears any previously stored tracing data. By default, data collection occurs only for the HTTP protocol. If users want to collect data for other protocols, they must select the appropriate protocol type. -
[-protocolType <protocolType>]: (Optional) Specify the protocol type if other than HTTP. It should match the virtual server type on NetScaler to which the client is connecting. -
[-captureSSLHandshakePolicies <yes/no>]: (Optional) Set this option only if you want to capture SSL policies evaluated during the SSL handshake or client hello request.
Example:
start policy tracing -filterExpr "client.ip.src.eq(10.102.102.222)"

start policy tracing -filterExpr "client.ip.src.eq(10.102.102.222)" -protocolType SSL

start policy tracing -filterExpr "client.ip.src.eq(10.102.102.222)" -protocolType SSL -captureSSLHandshakePolicies yes
<!--NeedCopy-->
Note:
This tool collects only the first 10 records for each PE.
To stop policy tracing, use the following command:
stop policy tracing
<!--NeedCopy-->
To display policy tracing data, use the following command:
show policy tracing [-httpTransactionId <string>] [-detail (brief | all)]
<!--NeedCopy-->
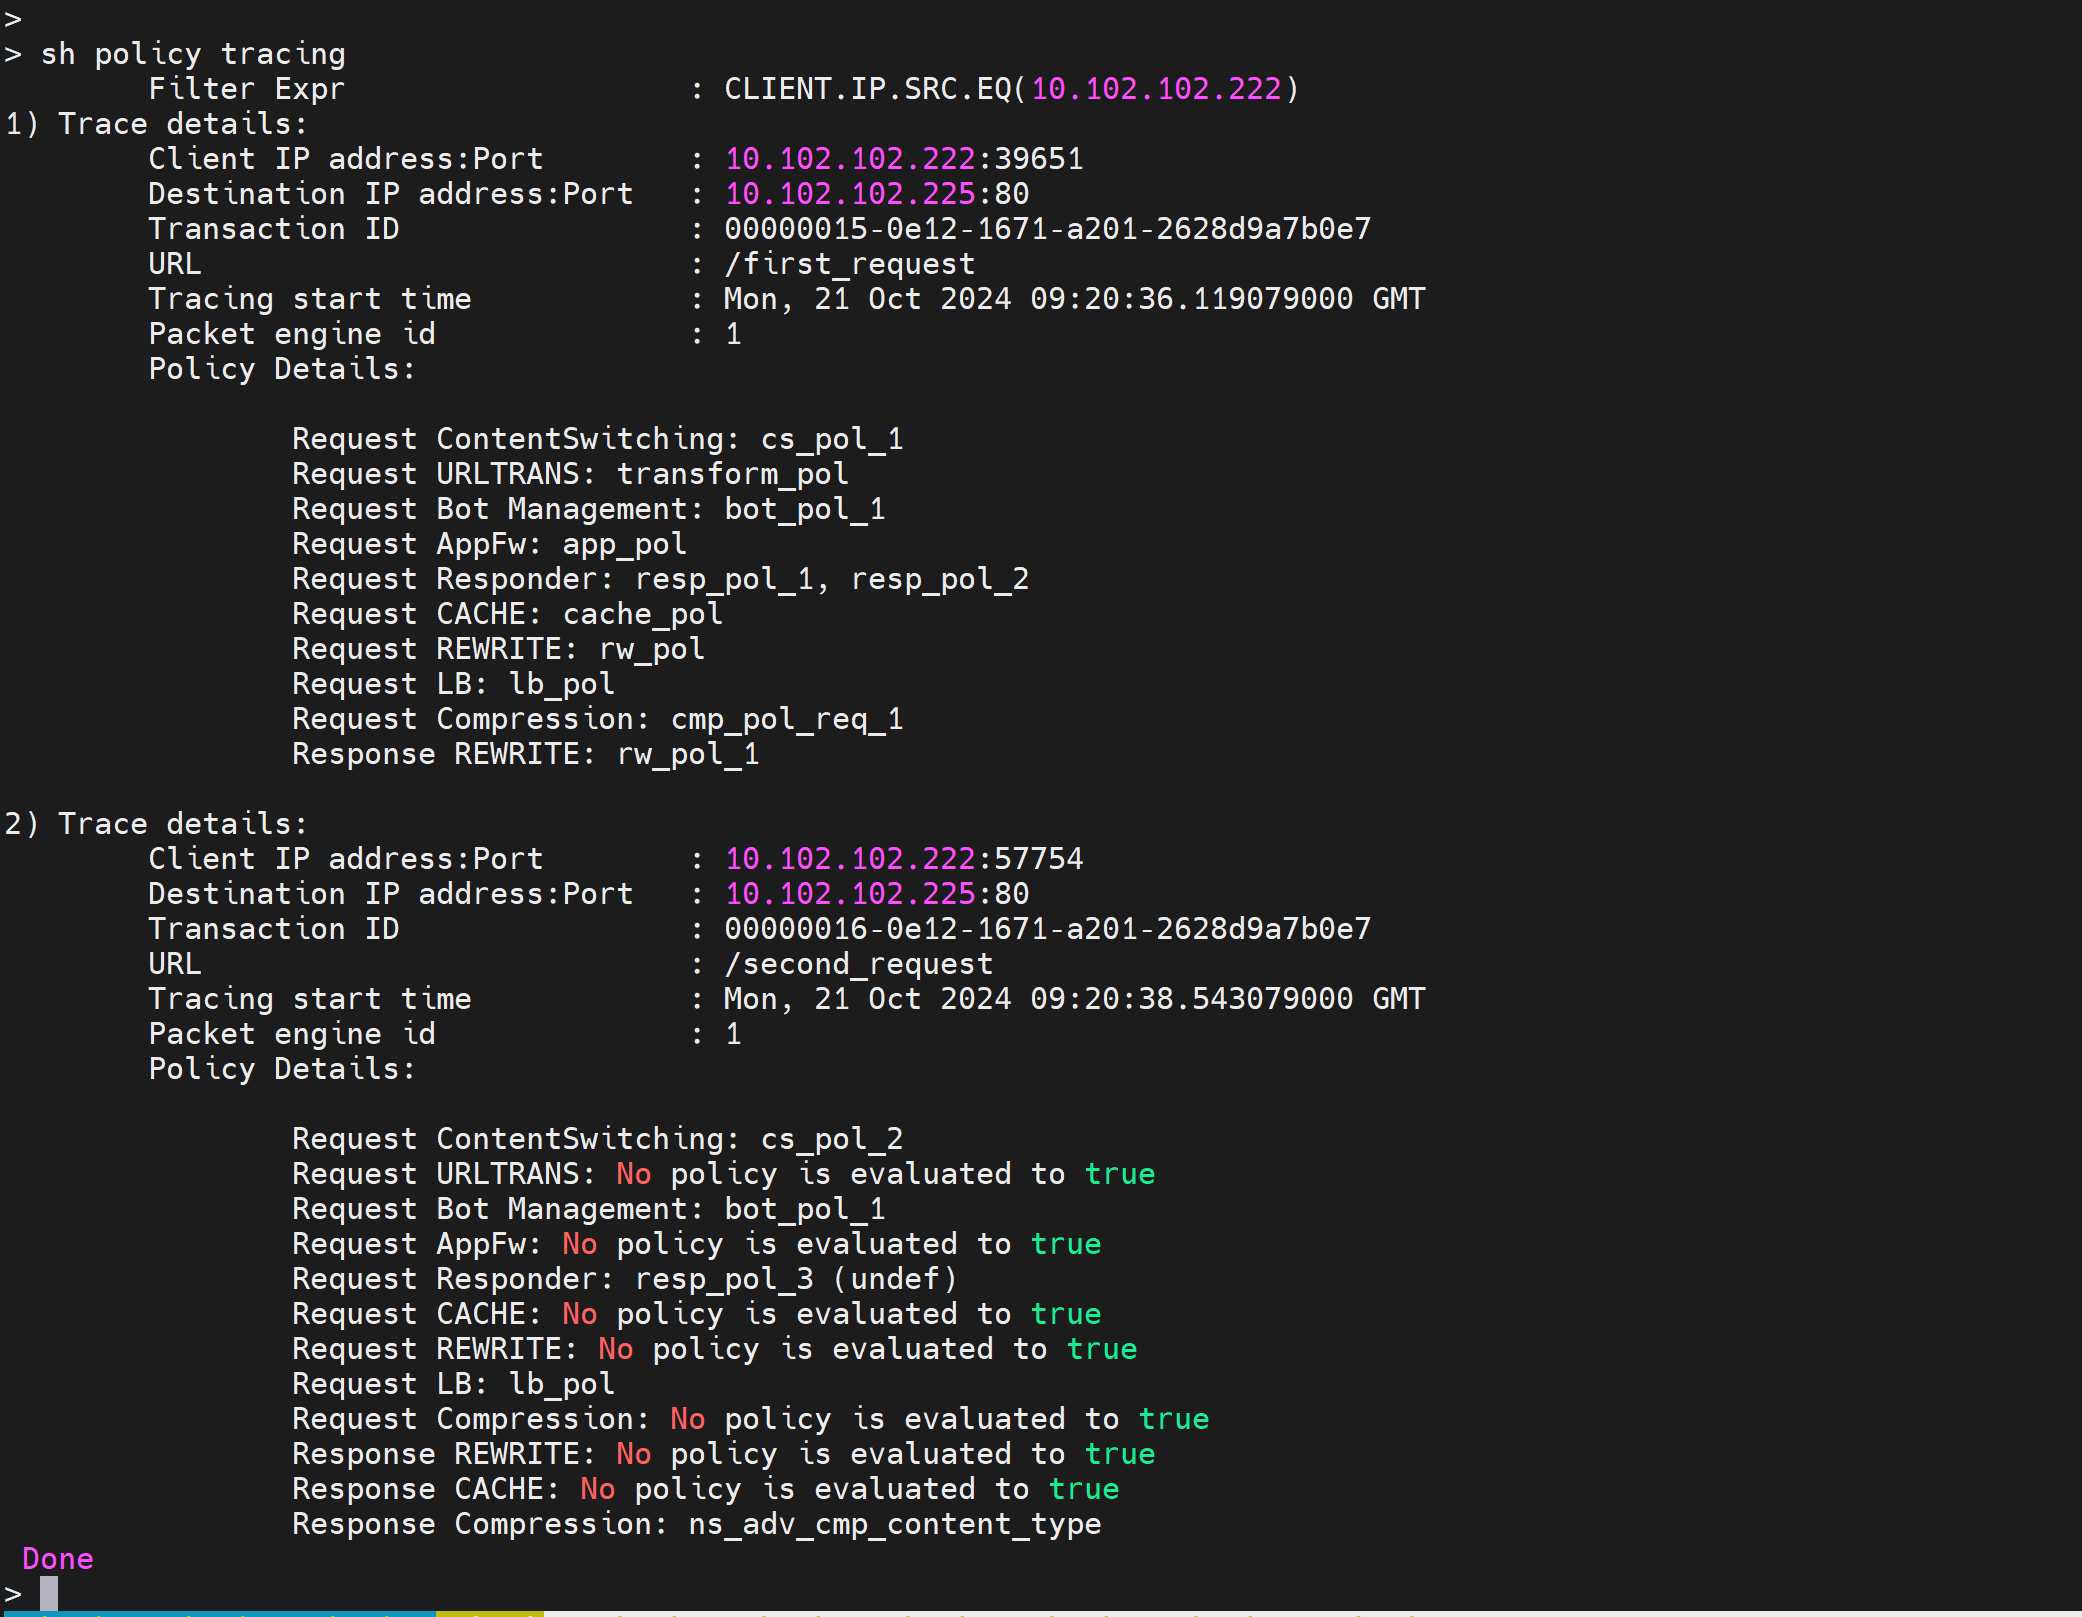
This command displays the data collected from each PE and node. If no parameters are specified, all available data is fetched. When an httpTransactionId is provided, only the data related to that specific ID is displayed. If you set the detail level to “brief,” only high-level metadata is shown. This output includes the client and destination IP addresses, and a unique transaction ID generated internally for identification.

In the example tracing record, policies and features are listed in the order they’re evaluated. For example, in trace record #1, the features are evaluated in the following order on the request side:
- Content Switching
- URL Transform
- BOT Management
- Application Firewall (AppFW)
- Responder
- Caching
- Rewrite
- Load Balancing
- Compression
In the example, outputs indicate the following:
-
“Request Responder: resp_pol_1, resp_pol_2”:
- For the Responder feature, actions are taken for two policies: resp_pol_1 and resp_pol_2.
- resp_pol_1 is evaluated first, followed by resp_pol_2.
-
“Request Rewrite”:
- The rewrite feature is evaluated on the request side that is when the packet goes from the client to NetScaler.
- Conversely, “Response Rewrite” means that the rewrite feature is evaluated on the response side that is when the packet goes from NetScaler to the client.
-
“Request AppFw: No policy is evaluated to true”:
No Application Firewall (AppFw) policy is evaluated to true during the request.
-
“Request Responder: resp_pol_3 (undef)”:
- For the Responder feature, the resp_pol_3 policy raised an undefined (undef) status for the URL “/second_request”.
- No policy is applied and no action is taken for the responder feature.
To clear policy tracing data, use the following command:
clear policy tracing
<!--NeedCopy-->
This command frees up memory by removing collected tracing data. It makes sure that system resources aren’t wasted on storing outdated tracing data.
Share
Share
In this article
This Preview product documentation is Cloud Software Group Confidential.
You agree to hold this documentation confidential pursuant to the terms of your Cloud Software Group Beta/Tech Preview Agreement.
The development, release and timing of any features or functionality described in the Preview documentation remains at our sole discretion and are subject to change without notice or consultation.
The documentation is for informational purposes only and is not a commitment, promise or legal obligation to deliver any material, code or functionality and should not be relied upon in making Cloud Software Group product purchase decisions.
If you do not agree, select I DO NOT AGREE to exit.