Horizontal pod autoscaler for NetScaler CPX with custom metrics
While deploying workloads in a Kubernetes cluster for the first time, it is difficult to exactly predict the resource requirements and how those requirements might change in a production environment. Using Horizontal pod autoscaler (HPA), you can automatically scale the number of pods in your workload based on different metrics like actual resource usage. HPA is a resource provided by Kubernetes which scales Kubernetes based resources like deployments, replicasets, and replication controllers.
Traditionally, HPA gets the required metrics from a metrics server. It then periodically adjusts the number of replicas in a deployment to match the observed average metrics to the target you specify.
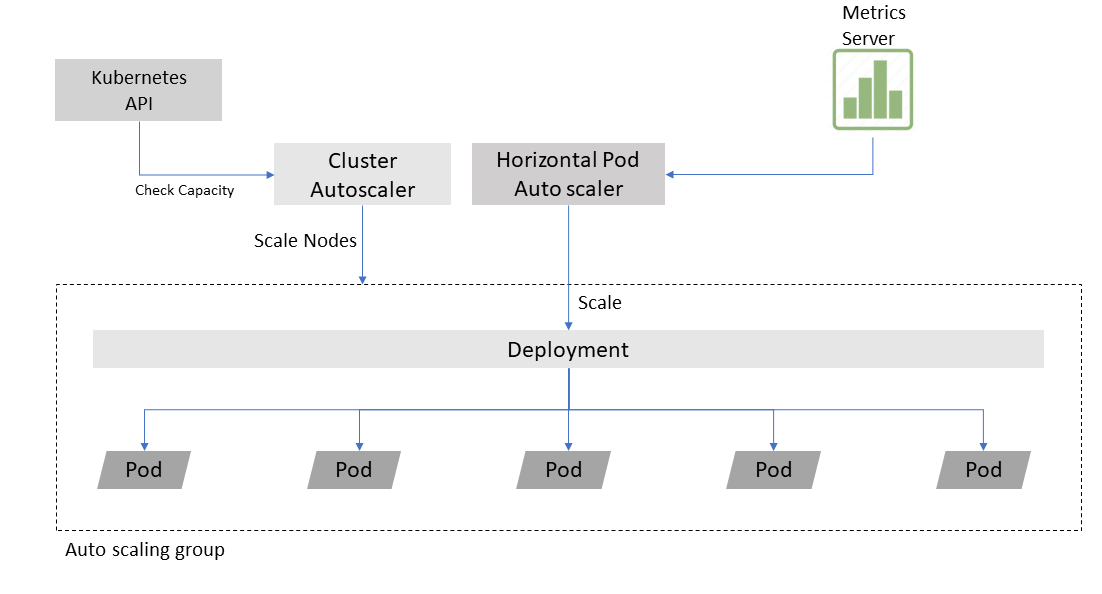
NetScaler provides a custom-metric based HPA solution for NetScaler CPX. By default, the metrics server only gives CPU and memory metrics for a pod. NetScaler provides a rich set of in-built metrics for analyzing application performance and based on these metrics you can take a better autoscaling judgment. A custom metric based HPA is a better solution like autoscaling based on HTTP request rate, SSL transactions, or ADC bandwidth.
NetScaler CPX HPA solution
NetScaler CPX HPA solution consists of the following components:
-
NetScaler VPX: NetScaler VPX or MPX is deployed at Tier-1 and load balances the client requests among the NetScaler CPX pods inside the cluster.
-
NetScaler CPX: NetScaler CPX deployed inside the cluster acts as a Tier-2 load balancer for the endpoint application pods. The NetScaler CPX pod is running along with the NetScaler Ingress Controller and NetScaler metric exporter as sidecars.
-
NetScaler Ingress Controller: The NetScaler Ingress Controller is an ingress controller which is built around the Kubernetes Ingress and automatically configures NetScaler based on the Ingress resource configuration. The NetScaler Ingress Controller deployed as a stand-alone pod configures the NetScaler VPX and other instances configures NetScaler CPXs.
-
NetScaler Metrics Exporter: The NetScaler Metrics Exporter exports the application performance metrics to the open-source monitoring system Prometheus. The NetScaler Metrics Exporter collects metrics from NetScaler CPX and exposes it in a format that Prometheus can understand.
-
Prometheus: Prometheus is an open-source systems monitoring and alerting toolkit. Prometheus is used to collect metrics from NetScaler CPXs and expose them using a Prometheus adapter which is queried by the HPA controller to keep a check on metrics.
-
Prometheus adapter: Prometheus adapter contains an implementation of the Kubernetes resource metrics API and custom metrics API. This adapter is suitable for use with the autoscaling/v2 HPA in Kubernetes version 1.6+. It can also replace the metrics server on clusters that already run Prometheus and collect the appropriate metrics.
The following diagram is a visual representation of how the NetScaler CPX HPA solution works.
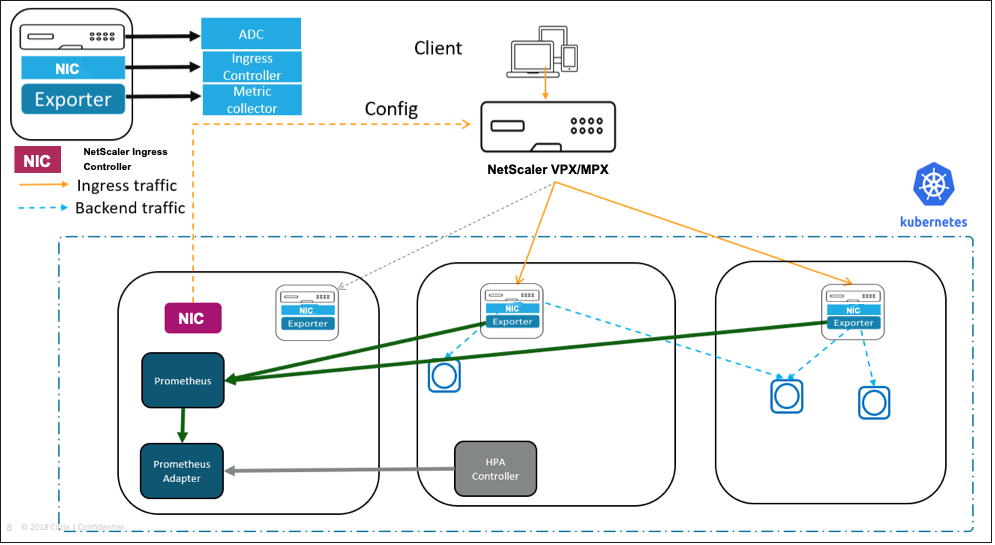
The Tier-1 NetScaler VPX load balances the NetScaler CPXs at Tier-2. NetScaler CPXs load balance applications. Other components like Prometheus, Prometheus-adapter, and an HPA controller is also deployed.
The HPA controller keeps polling the Prometheus-adapter for custom metrics like HTTP requests rate or bandwidth. Whenever the limit defined by the user in the HPA is reached, the HPA controller scales the NetScaler CPX deployment and creates another NetScaler CPX pod to handle the load.
Deploy NetScaler CPX HPA solution
Perform the following steps to deploy the NetScaler CPX HPA solution.
-
Clone the citrix-k8s-ingress-controller repository from GitHub using the following command.
git clone https://github.com/citrix/citrix-k8s-ingress-controller.gitAfter cloning, change your directory to the HPA folder with the following command.
cd citrix-k8s-ingress-controller/blob/master/docs/how-to/hpa -
From the HPA directory, open and edit the
values.shfile and set the following values for NetScaler VPX.-
VPX_IP: IP address of the NetScaler VPX -
VPX_PASSWORD: The password of thensrootuser on the NetScaler VPX -
VIRTUAL_IP_VPX: The IP address on which the sample guesbook application is accessed.
-
-
Create all the required resources by running the
create_all.shfile../create_all.shThis step creates the following resources:
- Prometheus and Grafana for monitoring
- NetScaler CPX with the NetScaler Ingress Controller and metrics exporter as sidecars
- NetScaler Ingress Controller as a stand-alone pod to configure NetScaler VPX
- A sample guestbook application
- HPA controller for monitoring the NetScaler CPX autoscale deployment
- Prometheus adapter for exposing the custom metrics
-
Add an entry in the
hostsfile. The route must be added in thehostsfile to route traffic for the guestbook application to the NetScaler VPX virtual IP address. For most Linux distros, thehostsfile is present in the/etcfolder. -
Send some generated traffic and verify the NetScaler CPX autoscale deployment.
The NetScaler CPX deployment HPA has been configured in such a way that when the average HTTP requests rate of the NetScaler CPX goes above 20 requests per second, it autoscales. You can use the following scripts provided in the HPA folder for sending traffic:
-
16_curl.sh- Send 16 HTTP requests per second (lesser than the threshold) -
30_curl.sh- Send 30 HTTP requests per second (greater than the threshold)
a. Run the
16_curl.shscript to send 16 HTTP requests per second to the NetScaler CPX../16_curl.shThe following diagram a Grafana dashboard which displays HTTP requests per second.
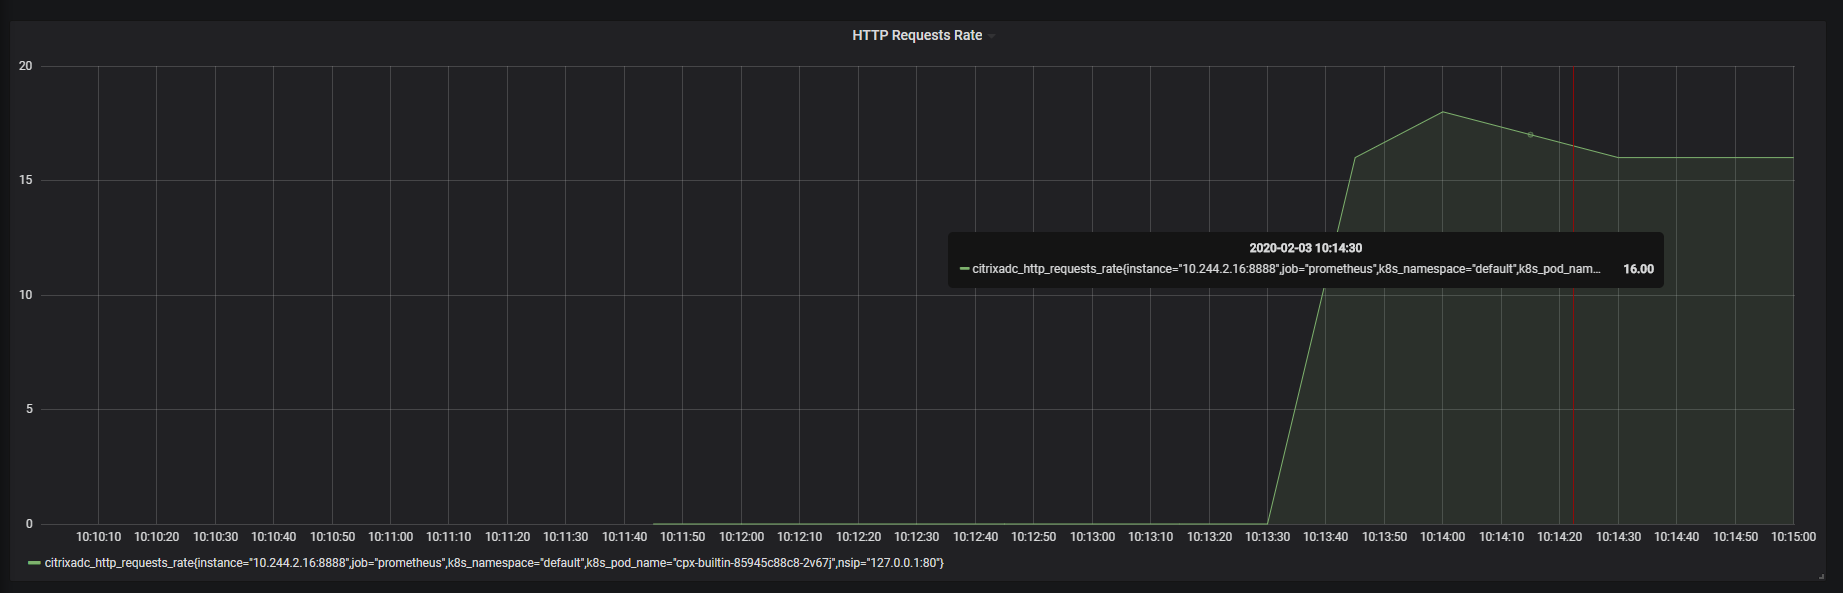
The following output shows the HPA state with 16 HTTP RPS.

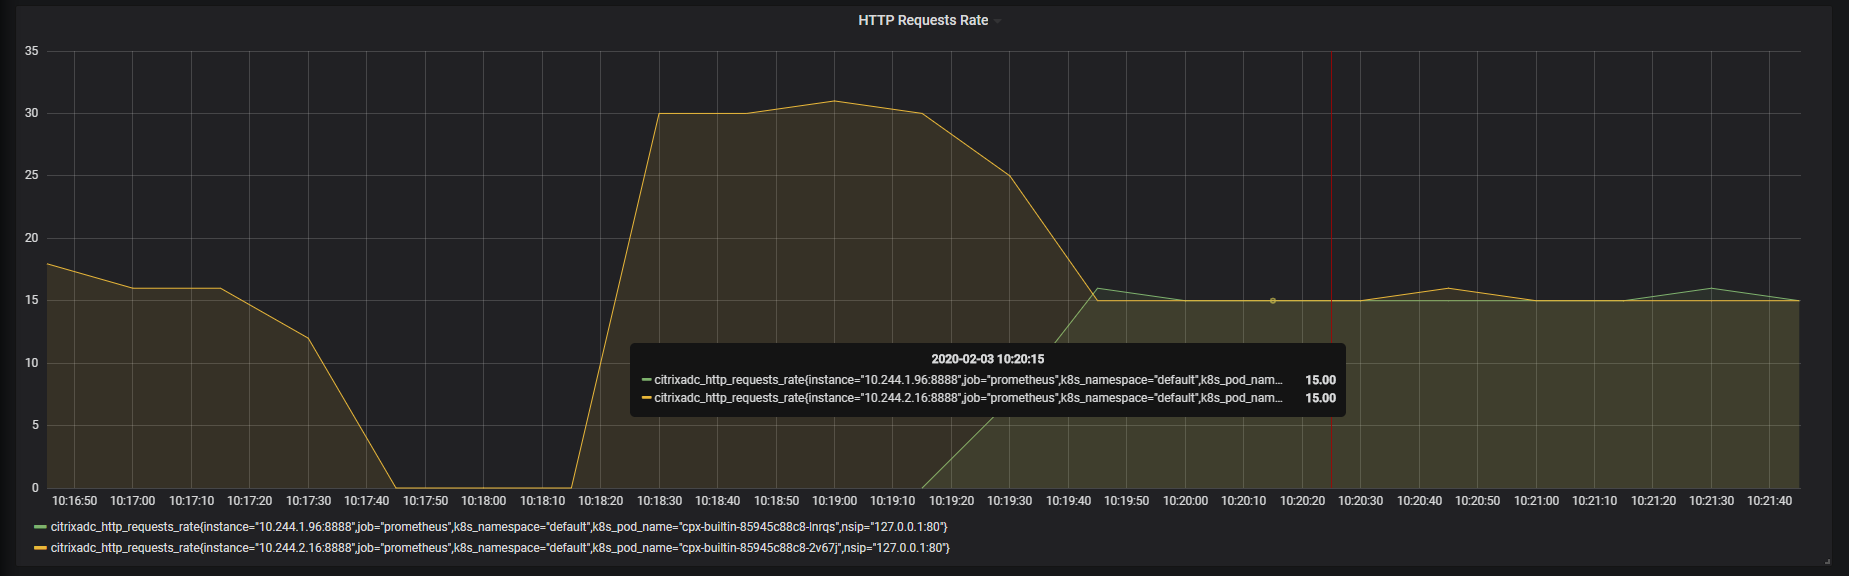
b. Run the
30_curl.shscript to send 30 HTTP requests per second to NetScaler CPX../30_curl.shWhen you run this script, the threshold of 20 requests that was set has been crossed and the NetScaler CPX deployment autoscales from one pod to two pods. The average value of the metric
HTTP request ratealso goes down from 30 to 15 as there are two NetScaler CPX pods.The following output shows the state of HPA when the target is crossed.

The following output shows that the number of replicas of NetScaler CPX have gone up to 2 and the average value of HTTP RPS comes down to 15.

The following diagram shows a Grafana dashboard with two NetScaler CPXs load balancing the traffic.
-
-
Clean up by executing the
delete_all.shscript../delete_all.sh
Note:
If the Tier-1 NetScaler VPX is not present, use NodePort to expose the NetScaler CPX service.