Single tier NetScaler® Ingress solution for MongoDB
MongoDB is one of the most popular NoSQL databases which is designed to process and store massive amounts of unstructured data. Cloud-native applications widely use MongoDB as a NoSQL database in the Kubernetes platform.
To identify and troubleshoot performance issues are a challenge in a Kubernetes environment due to the massive scale of application deployments. For database deployments like MongoDB, monitoring is a critical component of database administration to ensure that high availability and high performance requirements are met.
NetScaler provides an ingress solution for load balancing and monitoring MongoDB databases on a Kubernetes platform using the advanced load balancing and performance monitoring capabilities of NetScalers. NetScaler Ingress solution for MongoDB provides you deeper visibility into MongoDB transactions and helps you to quickly identify and address performance issues whenever they occur. Using NetScaler Observability Exporter, you can export the MongoDB transactions to Elasticsearch and visualize them using Kibana dashboards to get deeper insights.
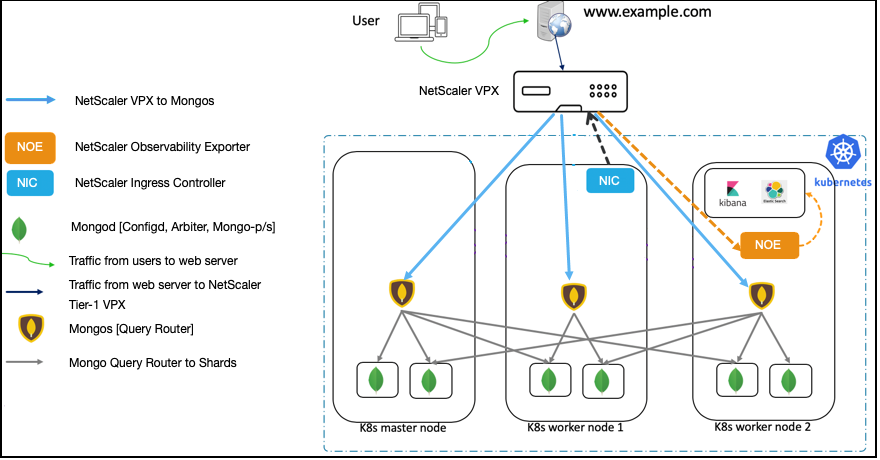
The following diagram explains NetScaler Ingress solution for MongoDB using a single-tier deployment of NetScaler.

In this solution, a NetScaler VPX is deployed outside the Kubernetes cluster (Tier-1) and NetScaler Observability Exporter is deployed inside the Kubernetes cluster.
The Tier-1 NetScaler VPX routes the traffic (North-South) from MongoDB clients to Mongo DB query routers (Mongos) in the Kubernetes cluster. NetScaler Observability Exporter is deployed inside the Kubernetes cluster.
As part of this deployment, an Ingress resource is created for NetScaler VPX (Tier-1 Ingress). The Tier-1 Ingress resource defines rules to enable load balancing for MongoDB traffic on NetScaler VPX and specifies the port for Mongo. Whenever MongoDB traffic arrives on the specified port on a NetScaler VPX, it routes this traffic to one of the Mongo service instances mentioned in the Ingress rule. Mongo service is exposed by the MongoDB administrator, and the same service instance is specified in the Ingress.
The NetScaler Observability Exporter instance aggregates transactions from NetScaler VPX and uploads them to the Elasticsearch server. You can set up Kibana dashboards to visualize the required data (for example, query response time, most queried collection names) and analyze them to get meaningful insights. Only insert, update, delete, find, and reply operations are parsed and metrics are sent to the NetScaler Observability Exporter.
Prerequisites
You must complete the following steps before deploying the NetScaler Ingress solution for MongoDB.
- Set up a Kubernetes cluster in cloud or on-premises
-
Deploy MongoDB in the Kubernetes cluster with deployment mode as sharded replica set. Other deployment modes for MongoDB are not supported.
- Ensure that you have Elasticsearch installed and configured. Use the elasticsearch.yaml file for deploying Elasticsearch.
- Ensure that you have installed Kibana to visualize your transaction data. Use the kibana.yaml file for deploying Kibana.
- Deploy a NetScaler VPX instance outside the Kubernetes cluster. For instructions on how to deploy NetScaler VPX, see Deploy a NetScaler VPX instance.
Perform the following after you deploy the NetScaler VPX:
-
Configure an IP address from the subnet of the Kubernetes cluster as SNIP on the NetScaler. For information on configuring SNIPs in NetScaler, see Configuring Subnet IP Addresses (SNIPs).
-
Enable management access for the SNIP that is the same subnet of the Kubernetes cluster. The SNIP should be used as
NS_IPvariable in the NetScaler Ingress Controller YAML file to enable the NetScaler Ingress Controller to configure the Tier-1 NetScaler.Note:
It is not mandatory to use SNIP as
NS_IP. If the management IP address of the NetScaler is reachable from the NetScaler Ingress Controller then you can use the management IP address asNS_IP. -
Create a NetScaler system user account specific to the NetScaler Ingress Controller. The NetScaler Ingress Controller uses the system user account to automatically configure the Tier-1 NetScaler.
-
Configure NetScaler VPX to forward DNS queries to CoreDNS pod IP addresses in the Kubernetes cluster.
add dns nameServer <core-dns-pod-ip-address>For example, if the pod IP addresses are 192.244.0.2 and 192.244.0.3, configure the name servers on NetScaler VPX as:
add dns nameServer 192.244.0.3
add dns nameServer 192.244.0.2
Deploy the NetScaler Ingress solution for MongoDB
When you deploy the NetScaler Ingress solution for MongoDB, you deploy the following components in the Kubernetes cluster:
- A stand-alone NetScaler Ingress Controller for NetScaler VPX
- An Ingress resource for NetScaler VPX
- NetScaler Observability Exporter
Perform the following steps to deploy the NetScaler Ingress solution for MongoDB.
-
Create a Kubernetes secret with the user name and password for NetScaler VPX.
kubectl create secret generic nslogin --from-literal=username='username' --from-literal=password='mypassword' -
Download the cic-configmap.yaml file and then deploy it using the following command.
kubectl create -f cic-configmap.yaml -
Deploy the NetScaler Ingress Controller as a pod using the following steps.
-
Download the NetScaler Ingress Controller manifest file. Use the following command:
wget https://raw.githubusercontent.com/citrix/citrix-k8s-ingress-controller/master/deployment/dual-tier/manifest/tier-1-vpx-cic.yaml -
Edit the NetScaler Ingress Controller manifest file and enter the values for the following environmental variables:
Environment Variable Mandatory or Optional Description NS_IP Mandatory The IP address of the NetScaler appliance. For more details, see Prerequisites. NS_USER and NS_PASSWORD Mandatory The user name and password of the NetScaler VPX or MPX appliance used as the Ingress device. EULA Mandatory The End User License Agreement. Specify the value as Yes.LOGLEVEL Optional The log levels to control the logs generated by NetScaler Ingress Controller. By default, the value is set to DEBUG. The supported values are: CRITICAL, ERROR, WARNING, INFO, and DEBUG. NS_PROTOCOL and NS_PORT Optional Defines the protocol and port that must be used by the NetScaler Ingress Controller to communicate with NetScaler. By default, the NetScaler Ingress Controller uses HTTPS on port 443. You can also use HTTP on port 80. ingress-classes Optional If multiple Ingress load balancers are used to load balance different Ingress resources. You can use this environment variable to specify the NetScaler Ingress Controller to configure NetScaler associated with a specific Ingress class. For information on Ingress classes, see Ingress class support NS_VIP Optional NetScaler Ingress Controller uses the IP address provided in this environment variable to configure a virtual IP address to the NetScaler that receives Ingress traffic. -
Specify or modify the following arguments in the NetScaler Ingress Controller YAML file.
args: - --configmap default/cic-configmap - --ingress-classes tier-1-vpx -
Deploy the updated NetScaler Ingress Controller manifest file using the following command:
kubectl create -f tier-1-vpx-cic.yaml
-
-
Create an Ingress object for the Tier-1 NetScaler using the tier-1-vpx-ingress.yaml file.
kubectl apply -f tier-1-vpx-ingress.yamlFollowing is the content for the
tier-1-vpx-ingress.yamlfile. As per the rules specified in this Ingress resource, NetScaler Ingress Controller configures the NetScaler VPX to listen for MongoDB traffic at port 27017. As shown in this example, you must specify the service that you have created for MongoDb query routers (for example:serviceName: mongodb-mongos) so that the NetScaler VPX can route traffic to it. Here,mongodb-mongosis the service for MongoDB query routers.apiVersion: networking.k8s.io/v1 kind: Ingress metadata: annotations: ingress.citrix.com/analyticsprofile: '{"tcpinsight": {"tcpBurstReporting":"DISABLED"}}' ingress.citrix.com/insecure-port: "27017" ingress.citrix.com/insecure-service-type: mongo ingress.citrix.com/insecure-termination: allow name: vpx-ingress spec: ingressClassName: tier-1-vpx defaultBackend: service: name: mongodb-mongos port: number: 27017 -
Deploy NetScaler Observability Exporter with Elasticsearch as the endpoint using the coe-es-mongo.yaml file.
kubectl apply -f coe-es-mongo.yamlNote:
You must set the Elasticsearch server details in the ELKServer environment variable either based on an IP address or the DNS name, along with the port information.
Following is a sample ConfigMap file.
apiVersion: v1
kind: ConfigMap
metadata:
  name: coe-config-es
data:
  lstreamd_default.conf: |
    {
        "Endpoints": {
            "ES": {
                "ServerUrl": "elasticsearch.default.svc.cluster.local:9200",
                "IndexPrefix":"adc_coe",
                "IndexInterval": "daily",
                "RecordType": {
                    "HTTP": "all",
                    "TCP": "all",
                    "SWG": "all",
                    "VPN": "all",
                    "NGS": "all",
                    "ICA": "all",
                    "APPFW": "none",
                    "BOT": "none",
                    "VIDEOOPT": "none",
                    "BURST_CQA": "none",
                    "SLA": "none",
                    "MONGO": "all"
                },
                "ProcessAlways": "no",
                "ProcessYieldTimeOut": "500",
                "MaxConnections": "512",
                "ElkMaxSendBuffersPerSec": "64",
                "JsonFileDump": "no"
            }
        }
    }
<!--NeedCopy-->
Verify the deployment of NetScaler Ingress solution
You can use the command as shown in the following example to verify that all the applications are deployed and list all services and ports.

You can use the kubectl get ingress command as shown in the following example to get information about the Ingress objects deployed.
   # kubectl get ingress

    NAME               HOSTS   ADDRESS   PORTS   AGE
    vpx-ingress        *                 80      22d
Verify observability for MongoDB traffic
This topic provides information on how to get visibility into MongoDB transactions using the NetScaler Ingress solution and it uses Kibana dashboards to visualize the database performance statistics.
Before performing the steps in this topic ensure that:
- You have deployed MongoDB as a sharded replica set in the Kubernetes cluster
- Deployed the NetScaler Ingress solution for MongoDB
- A client application for MongoDB is installed to send traffic to the MongoDB.
- Kibana is installed for visualization
Perform the following steps to verify observability for MongoDB traffic.
-
Configure your client application for MongoDB to point to the virtual IP address of the Tier-1 NetScaler VPX.
For example:
mongodb://<vip-of-vpx>:27017/ -
Send multiple requests (for example insert, update, delete) to the MongoDB database using your MongoDB client application. The transactions are uploaded to the Elasticsearch server.
-
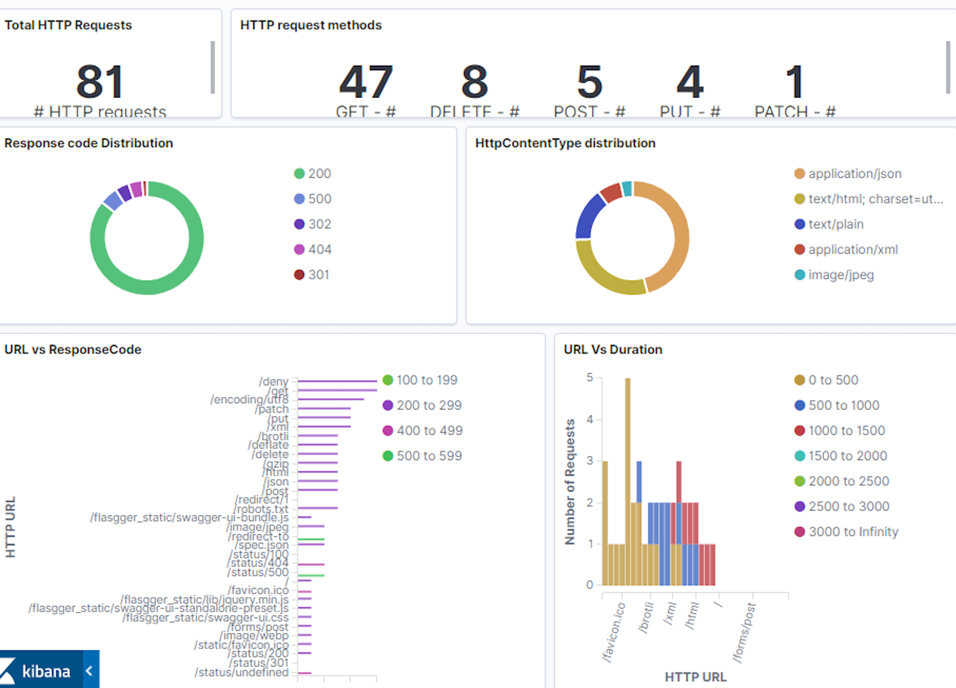
Set up a Kibana dashboard to visualize the MongoDB transactions. You can use the following sample Kibana dashboard.

In this dashboard, you can see performance statistics for your MongoDB deployment including the different type of queries and query response time. Analyzing this data helps you to find any anomalies like latency in a transaction and take immediate action.
Export telemetry data to Prometheus
For your Kubernetes deployment, if you have your Prometheus server deployed in the same Kubernetes cluster, you can configure annotations to enable Prometheus to automatically add NetScaler Observability Exporter as a scrape target.
Following is a snippet of NetScaler Observability Exporter YAML file (coe-es-mongodb.yaml) with these annotations.
template:
  metadata:
    name: coe-es
    labels:
      app: coe-es
    annotations:
      prometheus.io/scrape: "true"
      prometheus.io/port: "5563"
Alternatively, you can manually add NetScaler Observability Exporter as the scrape target on your Prometheus server configuration file.
Also, ensure that metrics for Prometheus are enabled in the cic-configmap.yaml file as shown in the following YAML file.
apiVersion: v1
kind: ConfigMap
metadata:
  name: cic-configmap
  namespace: default
data:
   NS_ANALYTICS_CONFIG: |
     distributed_tracing:
       enable: 'false'
       samplingrate: 0
     endpoint:
       server: 'coe-es.default.svc.cluster.local'
     timeseries:
       port: 5563
       metrics:
         enable: 'true'
         mode: 'prometheus'
       auditlogs:
         enable: 'false'
       events:
         enable: 'false'
     transactions:
       enable: 'true'
       port: 5557
<!--NeedCopy-->
In this YAML file, the following configuration enables metrics for Prometheus.
 metrics:
    enable: 'true'
    mode: 'prometheus'