-
-
SSL certificate for services of type LoadBalancer through the Kubernetes secret resource
-
BGP advertisement for type LoadBalancer services and Ingresses using NetScaler CPX
-
NetScaler CPX integration with MetalLB in layer 2 mode for on-premises Kubernetes clusters
-
Advanced content routing for Kubernetes Ingress using the HTTPRoute CRD
-
IP address management using the NetScaler IPAM controller for Ingress resources
-
Deploy NetScaler ingress controller for NetScaler with admin partitions
-
This content has been machine translated dynamically.
Dieser Inhalt ist eine maschinelle Übersetzung, die dynamisch erstellt wurde. (Haftungsausschluss)
Cet article a été traduit automatiquement de manière dynamique. (Clause de non responsabilité)
Este artículo lo ha traducido una máquina de forma dinámica. (Aviso legal)
此内容已经过机器动态翻译。 放弃
このコンテンツは動的に機械翻訳されています。免責事項
이 콘텐츠는 동적으로 기계 번역되었습니다. 책임 부인
Este texto foi traduzido automaticamente. (Aviso legal)
Questo contenuto è stato tradotto dinamicamente con traduzione automatica.(Esclusione di responsabilità))
This article has been machine translated.
Dieser Artikel wurde maschinell übersetzt. (Haftungsausschluss)
Ce article a été traduit automatiquement. (Clause de non responsabilité)
Este artículo ha sido traducido automáticamente. (Aviso legal)
この記事は機械翻訳されています.免責事項
이 기사는 기계 번역되었습니다.책임 부인
Este artigo foi traduzido automaticamente.(Aviso legal)
这篇文章已经过机器翻译.放弃
Questo articolo è stato tradotto automaticamente.(Esclusione di responsabilità))
Translation failed!
Creating monitors for applications
The topic covers how to create monitors for applications which would help to load balance applications better.
NetScaler supports two types of monitors.
- Built-in monitors
- Custom monitors
A smart annotation on the NetScaler Ingress Controller can be used for creating various types of monitors for your applications. You can choose between creating a monitor based on a built-in monitor, or creating a custom monitor that uses a script that you write to monitor the service. Once you have chosen or created a monitor, you can use the smart annotation to manage your application monitor lifecycle.
Smart annotation for monitor
You can use the ingress.citrix.com/monitor smart annotation which can be used to create a monitor of your choice. The NetScaler Ingress Controller internally creates the monitor and bounds it to the right service.
Configure a built-in monitor
The NetScaler appliance contains various built-in monitors that you can use to monitor your services. These built-in monitors handle most of the common protocols. Based on your application needs, you can choose the built-in monitor which suits your application.
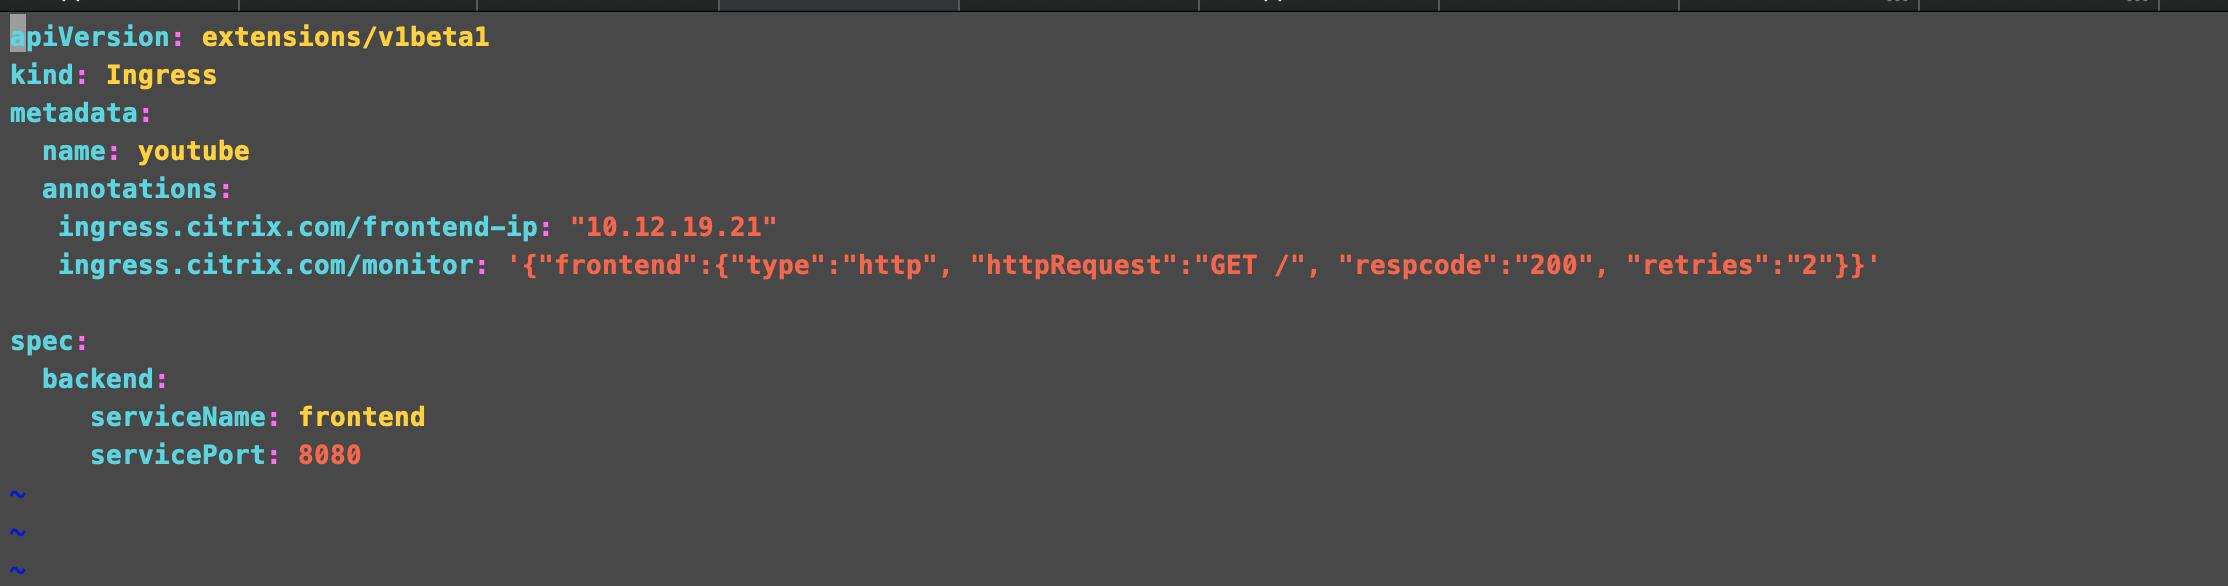
Here is an example of using an HTTP monitor with the help of smart annotation.
ingress.citrix.com/monitor: '{"frontend":{"type":"http", "httpRequest":"GET /", "respcode":"200", "retries":"2"}}'
In this example, a service called frontend is configured with an HTTP monitor which sends a GET request and expects the HTTP response code 200. When the NetScaler Ingress Controller gets this event, it creates a monitor and binds the monitor with the corresponding service.
A sample Ingress is shown as follows:
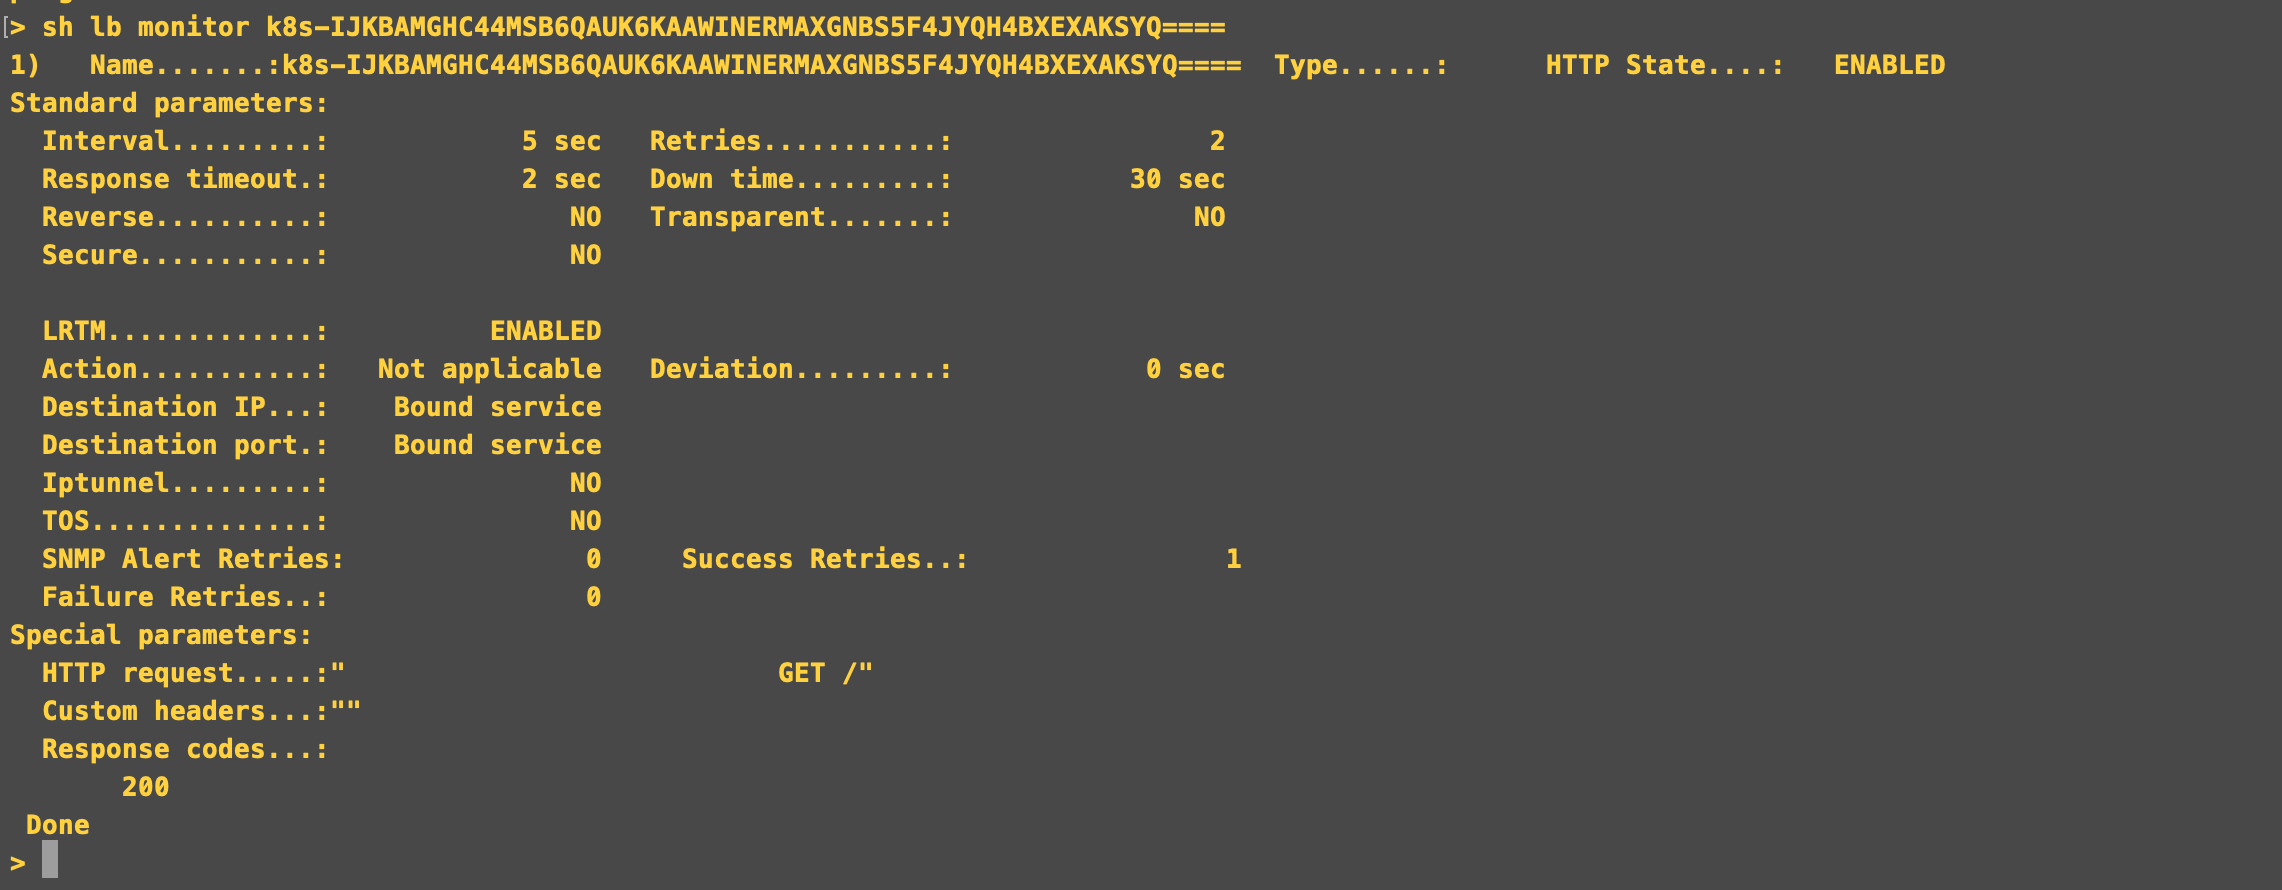
Corresponding ADC configurations are as follows:
Configure a custom monitor
In addition to built-in monitors, you can use custom monitors to check the state of your services. The NetScaler appliance provides several types of custom monitors based on scripts that are included with the NetScaler operating system. These monitors can be used to determine the state of services based on the load on the service or network traffic sent to the service. These are the inline monitors, user monitors, and load monitors. You can either use the provided functionality or you can create your own scripts and use those scripts to determine the state of the service to which the monitor is bound.
Following are the scripts which are provided by NetScaler® ADC:

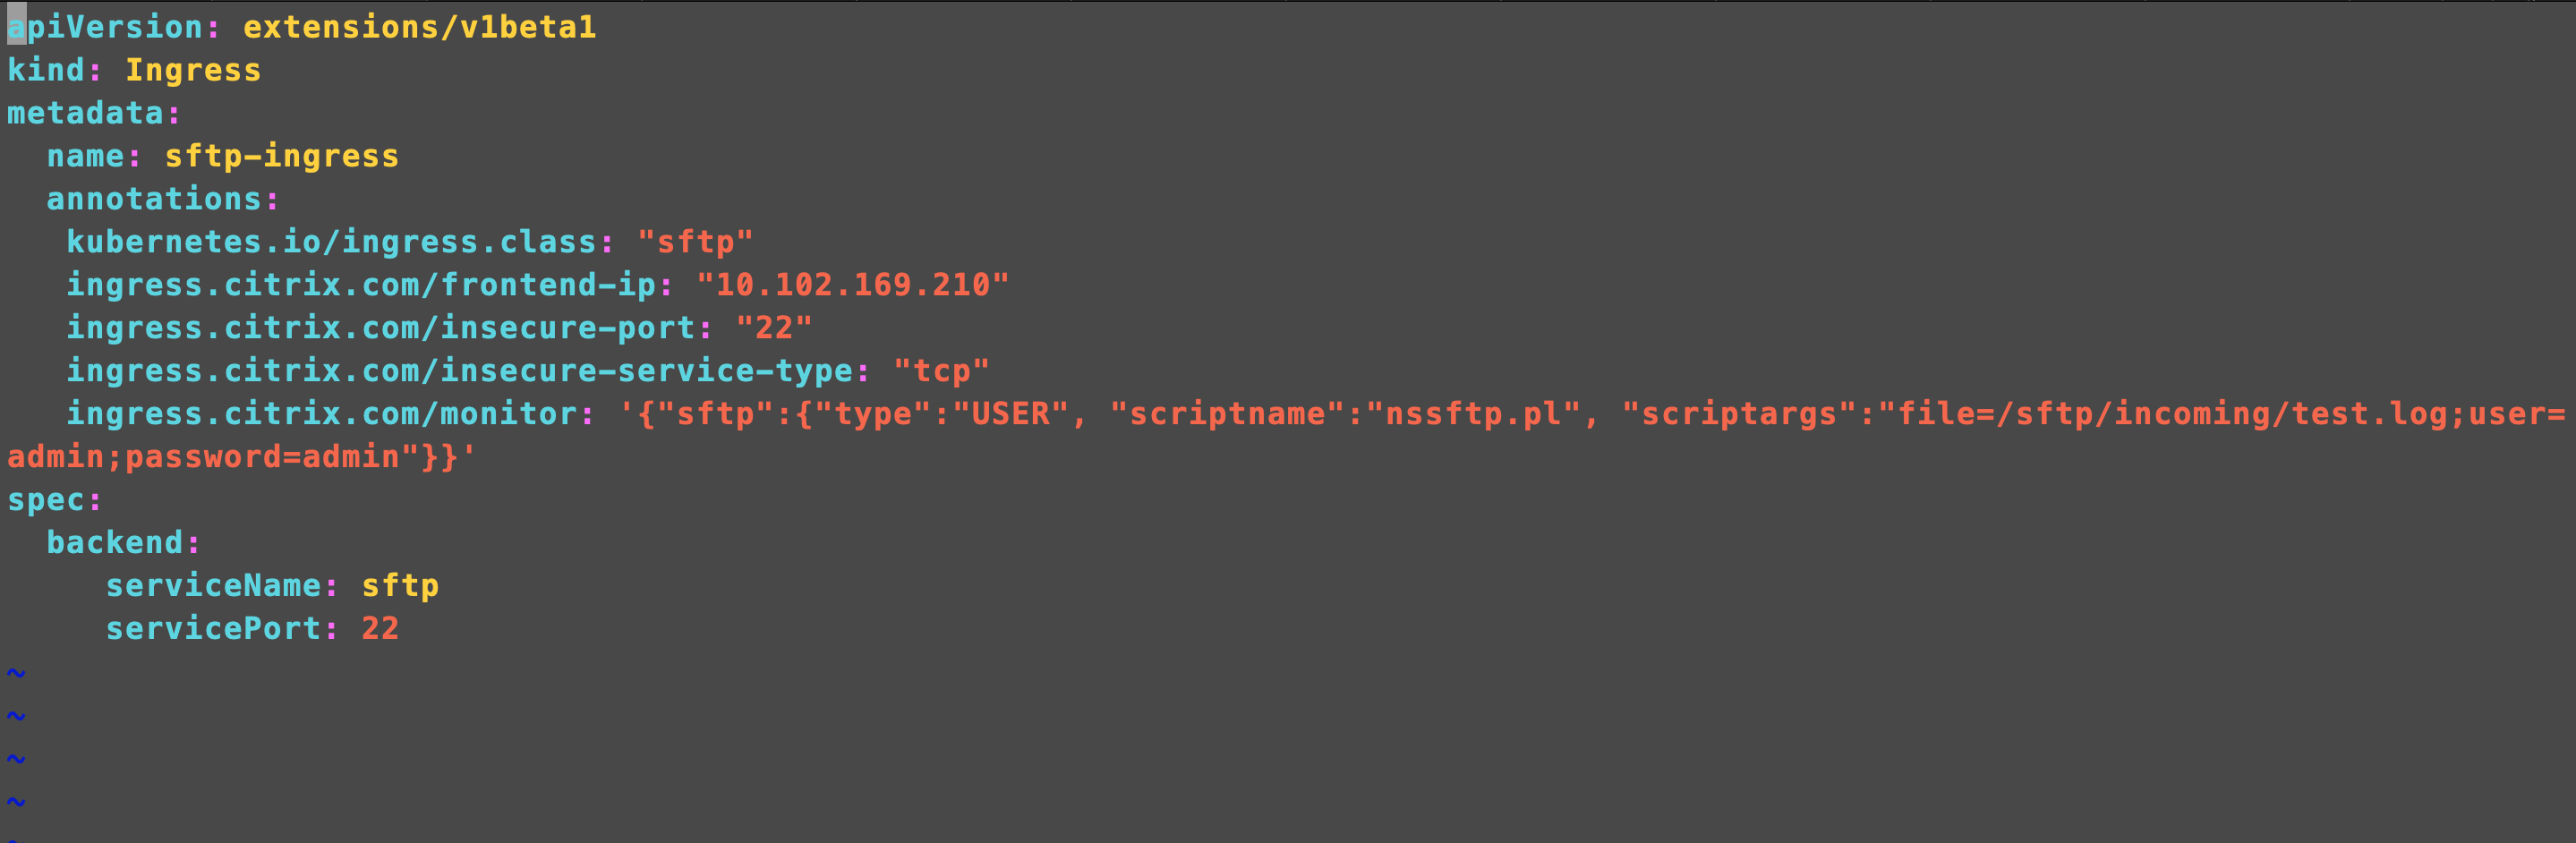
Here, we are using a user monitor for SFTP application. The name of the service used here is sftp and type of monitor is USER. Providing the script nssftp.pl<!--NeedCopy-->
which is already available in NetScaler.
ingress.citrix.com/monitor: '{"sftp":{"type":"USER", "scriptname":"nssftp.pl", "scriptargs":"file=/sftp/incoming/test.log;user=admin;password=admin"}}'
A sample Ingress is shown as follows:
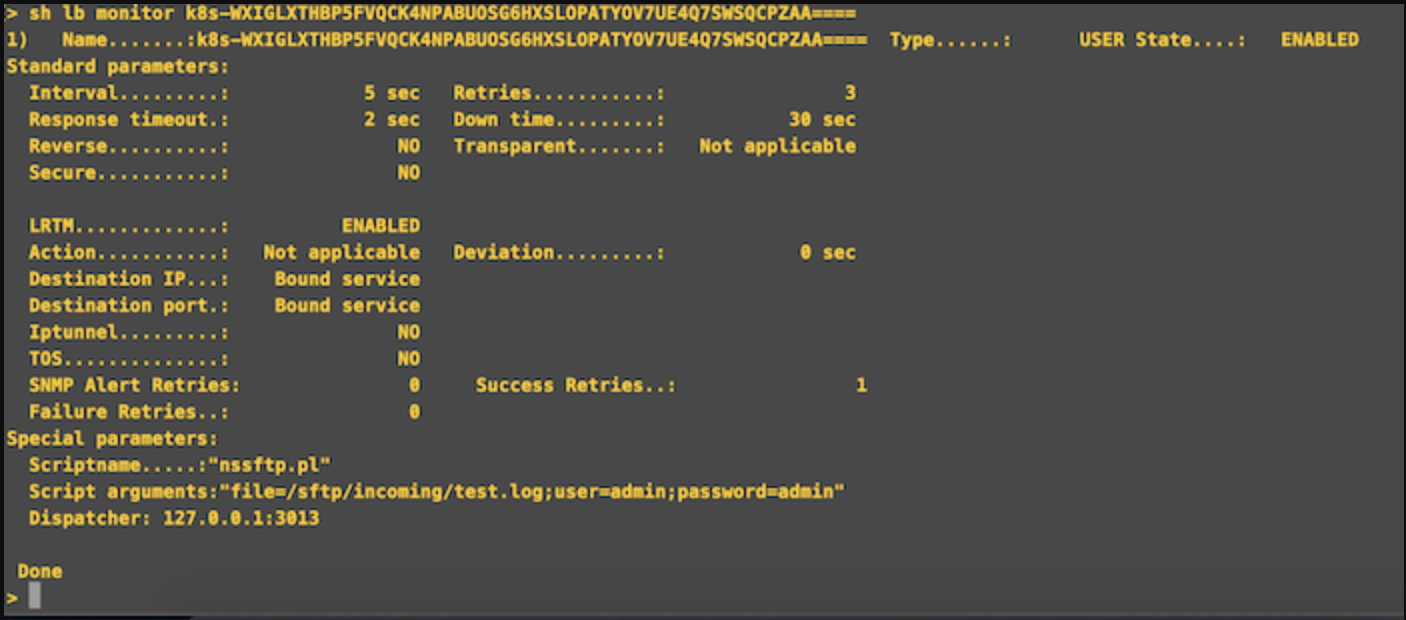
When this Ingress is applied for the service sftp, a user monitor is created on the NetScaler and bound to the service.
Corresponding ADC configurations are shown as follows:
Share
Share
This Preview product documentation is Cloud Software Group Confidential.
You agree to hold this documentation confidential pursuant to the terms of your Cloud Software Group Beta/Tech Preview Agreement.
The development, release and timing of any features or functionality described in the Preview documentation remains at our sole discretion and are subject to change without notice or consultation.
The documentation is for informational purposes only and is not a commitment, promise or legal obligation to deliver any material, code or functionality and should not be relied upon in making Cloud Software Group product purchase decisions.
If you do not agree, select I DO NOT AGREE to exit.