View metrics of NetScalers using Prometheus and Grafana
You can use the NetScaler Metrics Exporter and Prometheus-Operator to monitor NetScaler VPX or CPX ingress devices and NetScaler CPX (east-west) devices.
NetScaler Metrics Exporter
NetScaler Metrics Exporter is a simple server that collects NetScaler stats and exports them to Prometheus using HTTP. You can then add Prometheus as a data source to Grafana and graphically view the NetScaler stats. For more information see, NetScaler Metrics Exporter.
Note:
NetScaler Metrics Exporter supports exporting metrics from the admin partitions of NetScaler.
Launch prometheus operator
The Prometheus Operator has an expansive method of monitoring services on Kubernetes. To get started, this topic uses kube-prometheus and its manifest files. The manifest files help you to deploy a basic working model. Deploy the Prometheus Operator in your Kubernetes environment using the following commands:
git clone https://github.com/coreos/kube-prometheus.git
kubectl create -f kube-prometheus/manifests/setup/
kubectl create -f kube-prometheus/manifests/
Once you deploy Prometheus-Operator, several pods and services are deployed. From the deployed pods, the prometheus-k8s-xx pods are for metrics aggregation and timestamping, and the grafana pods are for visualization. If you view all the container images running in the cluster, you can see the following output:
$ kubectl get pods -n monitoring
NAME                                   READY     STATUS    RESTARTS   AGE
alertmanager-main-0                    2/2       Running   0          2h
alertmanager-main-1                    2/2       Running   0          2h
alertmanager-main-2                    2/2       Running   0          2h
grafana-5b68464b84-5fvxq               1/1       Running   0          2h
kube-state-metrics-6588b6b755-d6ftg    4/4       Running   0          2h
node-exporter-4hbcp                    2/2       Running   0          2h
node-exporter-kn9dg                    2/2       Running   0          2h
node-exporter-tpxhp                    2/2       Running   0          2h
prometheus-k8s-0                       3/3       Running   1          2h
prometheus-k8s-1                       3/3       Running   1          2h
prometheus-operator-7d9fd546c4-m8t7v   1/1       Running   0          2h
Note: The files in the
manifestsfolder are interdependent and hence the order in which they are created is important. In certain scenarios the manifest files might be created out of order and this leads to an error messages from Kubernetes. To resolve this scenario, re-execute thekubectl create -f kube-prometheus/manifests/command. Any YAML files that were not created the first time due to unmet dependencies, are created now.
It is recommended to expose the Prometheus and Grafana pods through NodePorts. To do so, you need to modify the prometheus-service.yaml and grafana-service.yaml files as follows:
Modify Prometheus service
apiVersion: v1
kind: Service
metadata:
  labels:
    prometheus: k8s
  name: prometheus-k8s
  namespace: monitoring
spec:
  type: NodePort
  ports:
  - name: web
    port: 9090
    targetPort: web
  selector:
    app: prometheus
    prometheus: k8s
<!--NeedCopy-->
After you modify the prometheus-service.yamlfile, apply the changes to the Kubernetes cluster using the following command:
kubectl apply -f prometheus-service.yaml
Modify Grafana service
apiVersion: v1
kind: Service
metadata:
  name: grafana
  namespace: monitoring
spec:
  type: NodePort
  ports:
  - name: http
    port: 3000
    targetPort: http
  selector:
    app: grafana
<!--NeedCopy-->
After you modify the grafana-service.yamlfile, apply the changes to the Kubernetes cluster using the following command:
kubectl apply -f grafana-service.yaml
Configure NetScaler Metrics Exporter
This topic describes how to integrate the NetScaler Metrics Exporter with NetScaler VPX or CPX ingress or NetScaler CPX (east-west) devices.
Configure NetScaler Metrics Exporter for NetScaler VPX Ingress device
To monitor an ingress NetScaler VPX device, the NetScaler Metrics Exporter is run as a pod within the Kubernetes cluster. The IP address of the NetScaler VPX ingress device is provided as an argument to the NetScaler Metrics Exporter. To provide the login credentials to access ADC, create a secret and mount the volume at mountpath “/mnt/nslogin”.
kubectl create secret generic nslogin --from-literal=username=<citrix-adc-user> --from-literal=password=<citrix-adc-password> -n <namespace>
<!--NeedCopy-->
The following is a sample YAML file to deploy the exporter:
apiVersion: v1
kind: Pod
metadata:
  name: exporter-vpx-ingress
  labels:
    app: exporter-vpx-ingress
spec:
  containers:
    - name: exporter
      image: "quay.io/citrix/citrix-adc-metrics-exporter:1.4.8"
      imagePullPolicy: IfNotPresent
      args:
        - "--target-nsip=<IP_of_VPX>"
        - "--port=8888"
      volumeMounts:
      - name: nslogin
        mountPath: "/mnt/nslogin"
        readOnly: true
      securityContext:
        readOnlyRootFilesystem: true
  volumes:
  - name: nslogin
    secret:
      secretName: nslogin
---
kind: Service
apiVersion: v1
metadata:
  name: exporter-vpx-ingress
  labels:
    service-type: citrix-adc-monitor
spec:
  selector:
    app: exporter-vpx-ingress
  ports:
    - name: exporter-port
      port: 8888
      targetPort: 8888
<!--NeedCopy-->
The IP address and the port of the NetScaler VPX device needs to be provided in the --target-nsip parameter. For example, --target-nsip=10.0.0.20.
Configure NetScaler Metrics Exporter for NetScaler CPX Ingress device
To monitor a NetScaler CPX ingress device, the NetScaler Metrics Exporter is added as a sidecar to the NetScaler CPX.The following is a sample YAML file of a NetScaler CPX ingress device with the exporter as a side car:
---
apiVersion: apps/v1
kind: Deployment
metadata:
  labels:
    app: cpx-ingress
  name: cpx-ingress
spec:
  replicas: 1
  selector:
    matchLabels:
      app: cpx-ingress
  template:
    metadata:
      annotations:
        NETSCALER_AS_APP: "True"
      labels:
        app: cpx-ingress
    spec:
      containers:
      - env:
        - name: EULA
          value: "YES"
        - name: NS_PROTOCOL
          value: HTTP
        - name: NS_PORT
          value: "9080"
        #Define the NITRO port here
        image: quay.io/citrix/citrix-k8s-cpx-ingress:13.0-52.24
        imagePullPolicy: IfNotPresent
        name: cpx-ingress
        ports:
        - containerPort: 80
          name: http
          protocol: TCP
        - containerPort: 443
          name: https
          protocol: TCP
        - containerPort: 9080
          name: nitro-http
          protocol: TCP
        - containerPort: 9443
          name: nitro-https
          protocol: TCP
        securityContext:
          privileged: true
      # Adding exporter as a sidecar
      - args:
        - --target-nsip=192.0.0.2
        - --port=8888
        - --secure=no
        env:
        - name: NS_USER
          value: nsroot
        - name: NS_PASSWORD
          value: nsroot
        image: quay.io/citrix/citrix-adc-metrics-exporter:1.4.8
        imagePullPolicy: IfNotPresent
        name: exporter
        securityContext:
          readOnlyRootFilesystem: true
      serviceAccountName: cpx
---
kind: Service
apiVersion: v1
metadata:
  name: exporter-cpx-ingress
  labels:
    service-type: citrix-adc-monitor
spec:
  selector:
    app: cpx-ingress
  ports:
    - name: exporter-port
      port: 8888
      targetPort: 8888
<!--NeedCopy-->
Here, the exporter uses the local IP address (192.0.0.2) to fetch metrics from the NetScaler CPX.
Configure NetScaler Metrics Exporter for NetScaler CPX (east-west) device
To monitor a NetScaler CPX (east-west) device, the NetScaler Metrics Exporter is added as a sidecar to the NetScalerCPX.The following is a sample YAML file of a NetScaler CPX (east-west) device with the exporter as a side car:
apiVersion: apps/v1
kind: DaemonSet
metadata:
  annotations:
    deprecated.daemonset.template.generation: "0"
  labels:
    app: cpx-ew
  name: cpx-ew
spec:
  selector:
    matchLabels:
      app: cpx-ew
  template:
    metadata:
      annotations:
        NETSCALER_AS_APP: "True"
      labels:
        app: cpx-ew
      name: cpx-ew
    spec:
      containers:
      - env:
        - name: EULA
          value: "yes"
        - name: NS_NETMODE
          value: HOST
        #- name: "kubernetes_url"
        #  value: "https://10..xx.xx:6443"
        image: quay.io/citrix/citrix-k8s-cpx-ingress:13.0-52.24
        imagePullPolicy: IfNotPresent
        name: cpx
        securityContext:
          privileged: true
      # Add exporter as a sidecar
      - args:
        - --target-nsip=192.168.0.2
        - --port=8888
        - --secure=no
        env:
        - name: NS_USER
          value: nsroot
        - name: NS_PASSWORD
          value: nsroot
        image: quay.io/citrix/citrix-adc-metrics-exporter:1.4.8
        imagePullPolicy: IfNotPresent
        name: exporter
        securityContext:
          readOnlyRootFilesystem: true
      serviceAccountName: cpx
---
kind: Service
apiVersion: v1
metadata:
  name: exporter-cpx-ew
  labels:
    service-type: citrix-adc-monitor
spec:
  selector:
    app: cpx-ew
  ports:
    - name: exporter-port
      port: 8888
      targetPort: 8888
<!--NeedCopy-->
Here, the exporter uses the local IP (192.168.0.2) to fetch metrics from the NetScaler CPX (east-west) device.
ServiceMonitors to detect NetScaler
The NetScaler Metrics Exporter helps collect data from the NetScaler VPX or CPX ingress and NetScaler CPX (east-west) devices. The Prometheus Operator needs to detect these exporters so that the metrics can be timestamped, stored, and exposed for visualization on Grafana. The Prometheus Operator uses the concept of ServiceMonitors to detect pods that belong to a service, using the labels attached to that service.
The following example YAML file detects all the exporter services (given in the sample YAML files) which have the label service-type: citrix-adc-monitor associated with them.
apiVersion: monitoring.coreos.com/v1
kind: ServiceMonitor
metadata:
  name: citrix-adc-servicemonitor
  labels:
    servicemonitor: citrix-adc
spec:
  endpoints:
  - interval: 30s
    port: exporter-port
  selector:
    matchLabels:
      service-type: citrix-adc-monitor
  namespaceSelector:
    matchNames:
    - monitoring
    - default
<!--NeedCopy-->
The ServiceMonitor directs Prometheus to detect Exporters in the default and monitoring namespaces only. To detect Exporters from other namespaces add the names of those namespaces under the namespaceSelector: field.
Note:
If the Exporter that needs to be monitored exists in a namespace other than the
defaultormonitoringnamespace, then additional RBAC privileges must be provided to Prometheus to access those namespaces. The following is sample YAML (prometheus-clusterRole.yaml) file the provides Prometheus full access to resources across the namespaces:
apiVersion: rbac.authorization.k8s.io/v1
kind: ClusterRole
metadata:
  name: prometheus-k8s
rules:
- apiGroups:
  - ""
  resources:
  - nodes/metrics
  - namespaces
  - services
  - endpoints
  - pods
  verbs: ["*"]
- nonResourceURLs:
  - /metrics
  verbs:  ["*"]
<!--NeedCopy-->
To provide additional privileges Prometheus, deploy the sample YAML using the following command:
kubectl apply -f prometheus-clusterRole.yaml
View the metrics in grafana
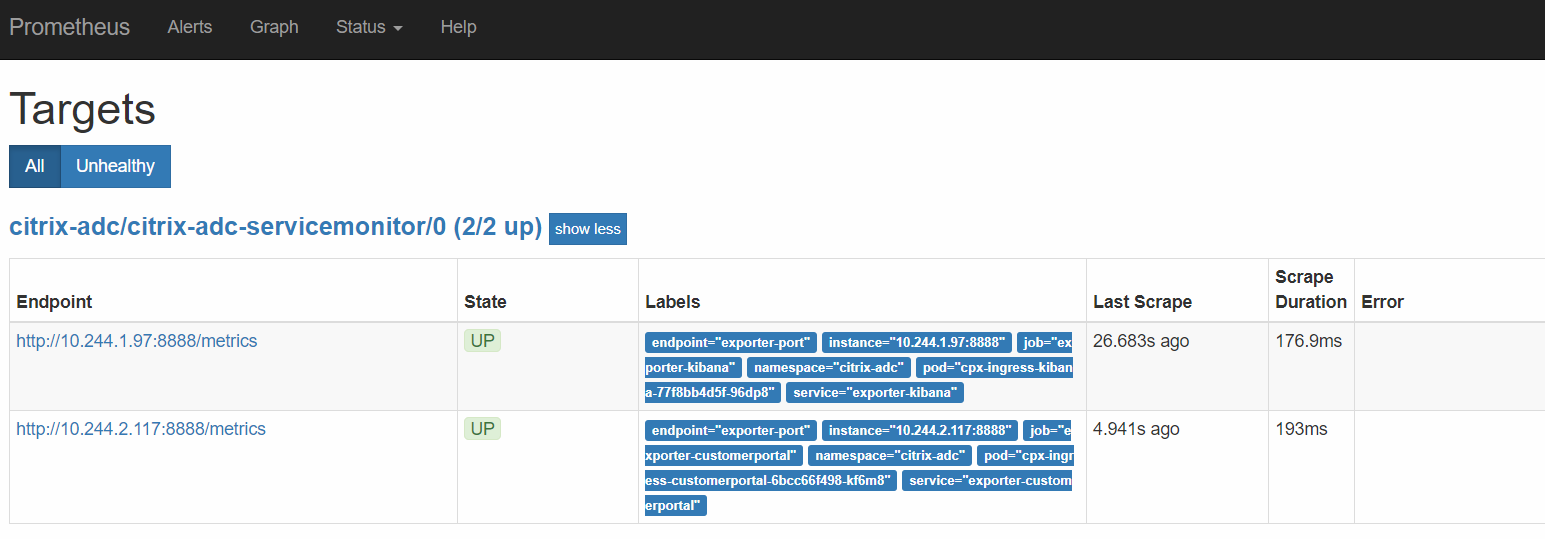
The NetScaler instances that are detected for monitoring appears in the Targets page of the prometheus container. You can be access the Targets page using the following URL: http://<k8s_cluster_ip>:<prometheus_nodeport>/targets:

To view the metrics graphically:
-
Log into grafana using
http://<k8s_cluster_ip>:<grafafa_nodeport>with default credentials admin:admin -
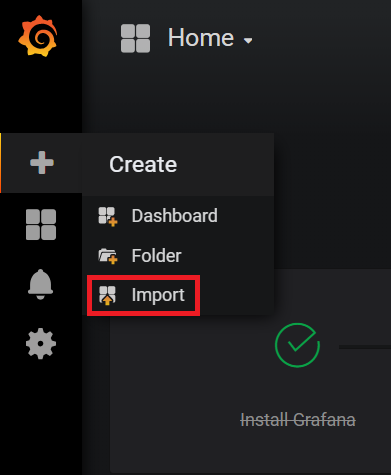
On the left panel, select + and click Import to import the sample grafana dashboard.

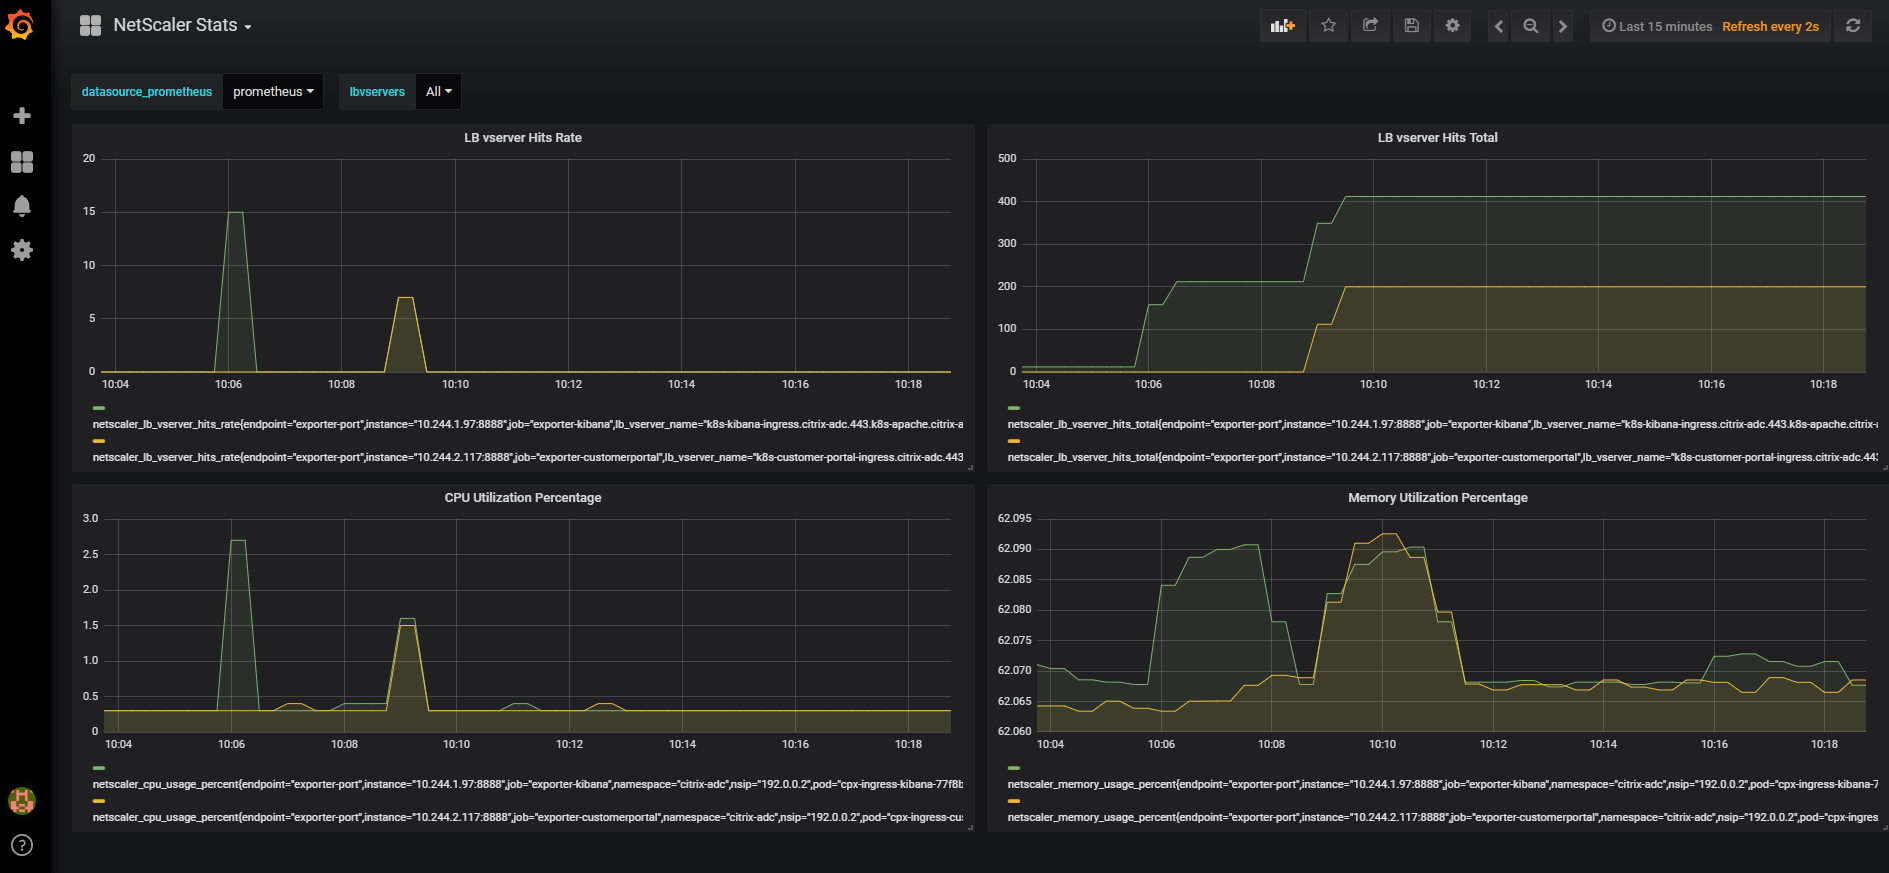
A dashboard containing the graphs similar to the following appears:

You can further enhance the dashboard using Grafana’s documentation or demo videos.