Deploy NetScaler® Observability Exporter (NSOE) by using NetScaler Operator
NetScaler Observability Exporter is a container that collects metrics and transactions from NetScaler and transforms them to suitable formats, such as JSON and AVRO. You can export the data collected by NSOE to any desired endpoint for analysis and get valuable insights at the microservices level for applications proxied by NetScaler devices.
Prerequisites
- Red Hat OpenShift Cluster (version 4.1 or later).
- Deploy NetScaler Operator. See Deploy NetScaler Operator.
-
Because NSOE operates via any User ID (uid), deploy the following security context constraints (SCC) for the namespace in which NSOE is deployed.
 oc adm policy add-scc-to-user anyuid system:serviceaccount:<namespace>:default
 <!--NeedCopy-->
Deploy NetScaler Observability Exporter using NetScaler Operator
Perform the following steps:
-
Log in to the OpenShift 4.x Cluster console.
-
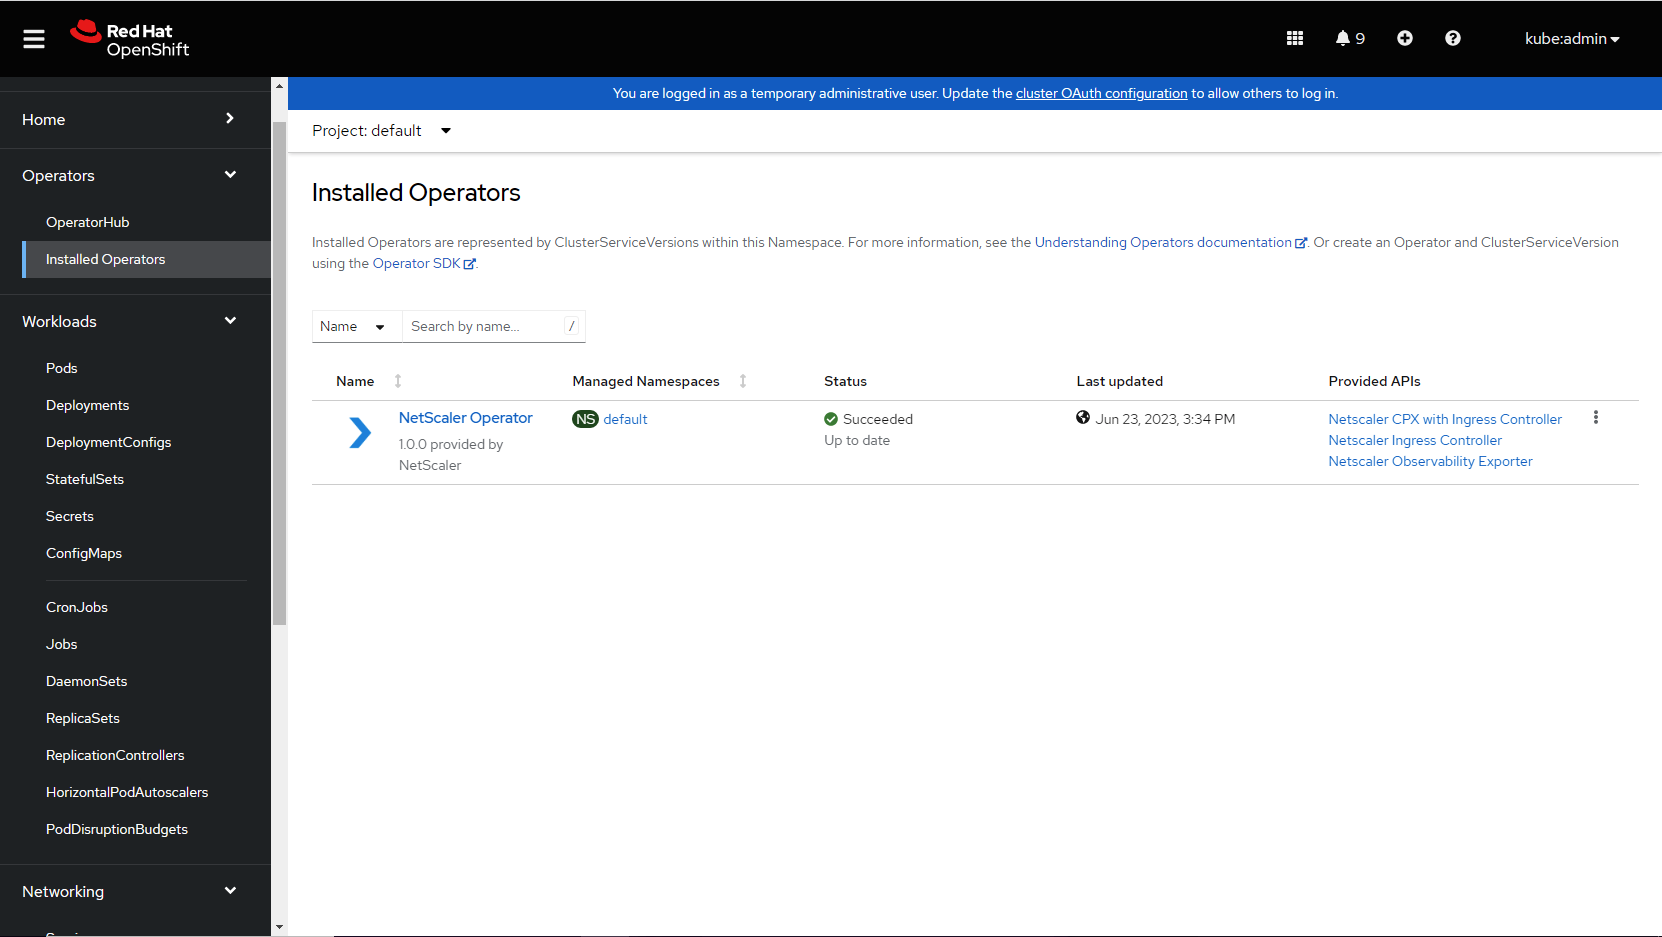
Navigate to Operators > Installed Operators and select NetScaler Operator.
-
Click NetScaler Observability Exporter and select Create NetScalerObservabilityExporter .

The NetScaler Observability Exporter YAML definition is displayed. Optionally, you can select
Form viewbutton and update the parameters in a form.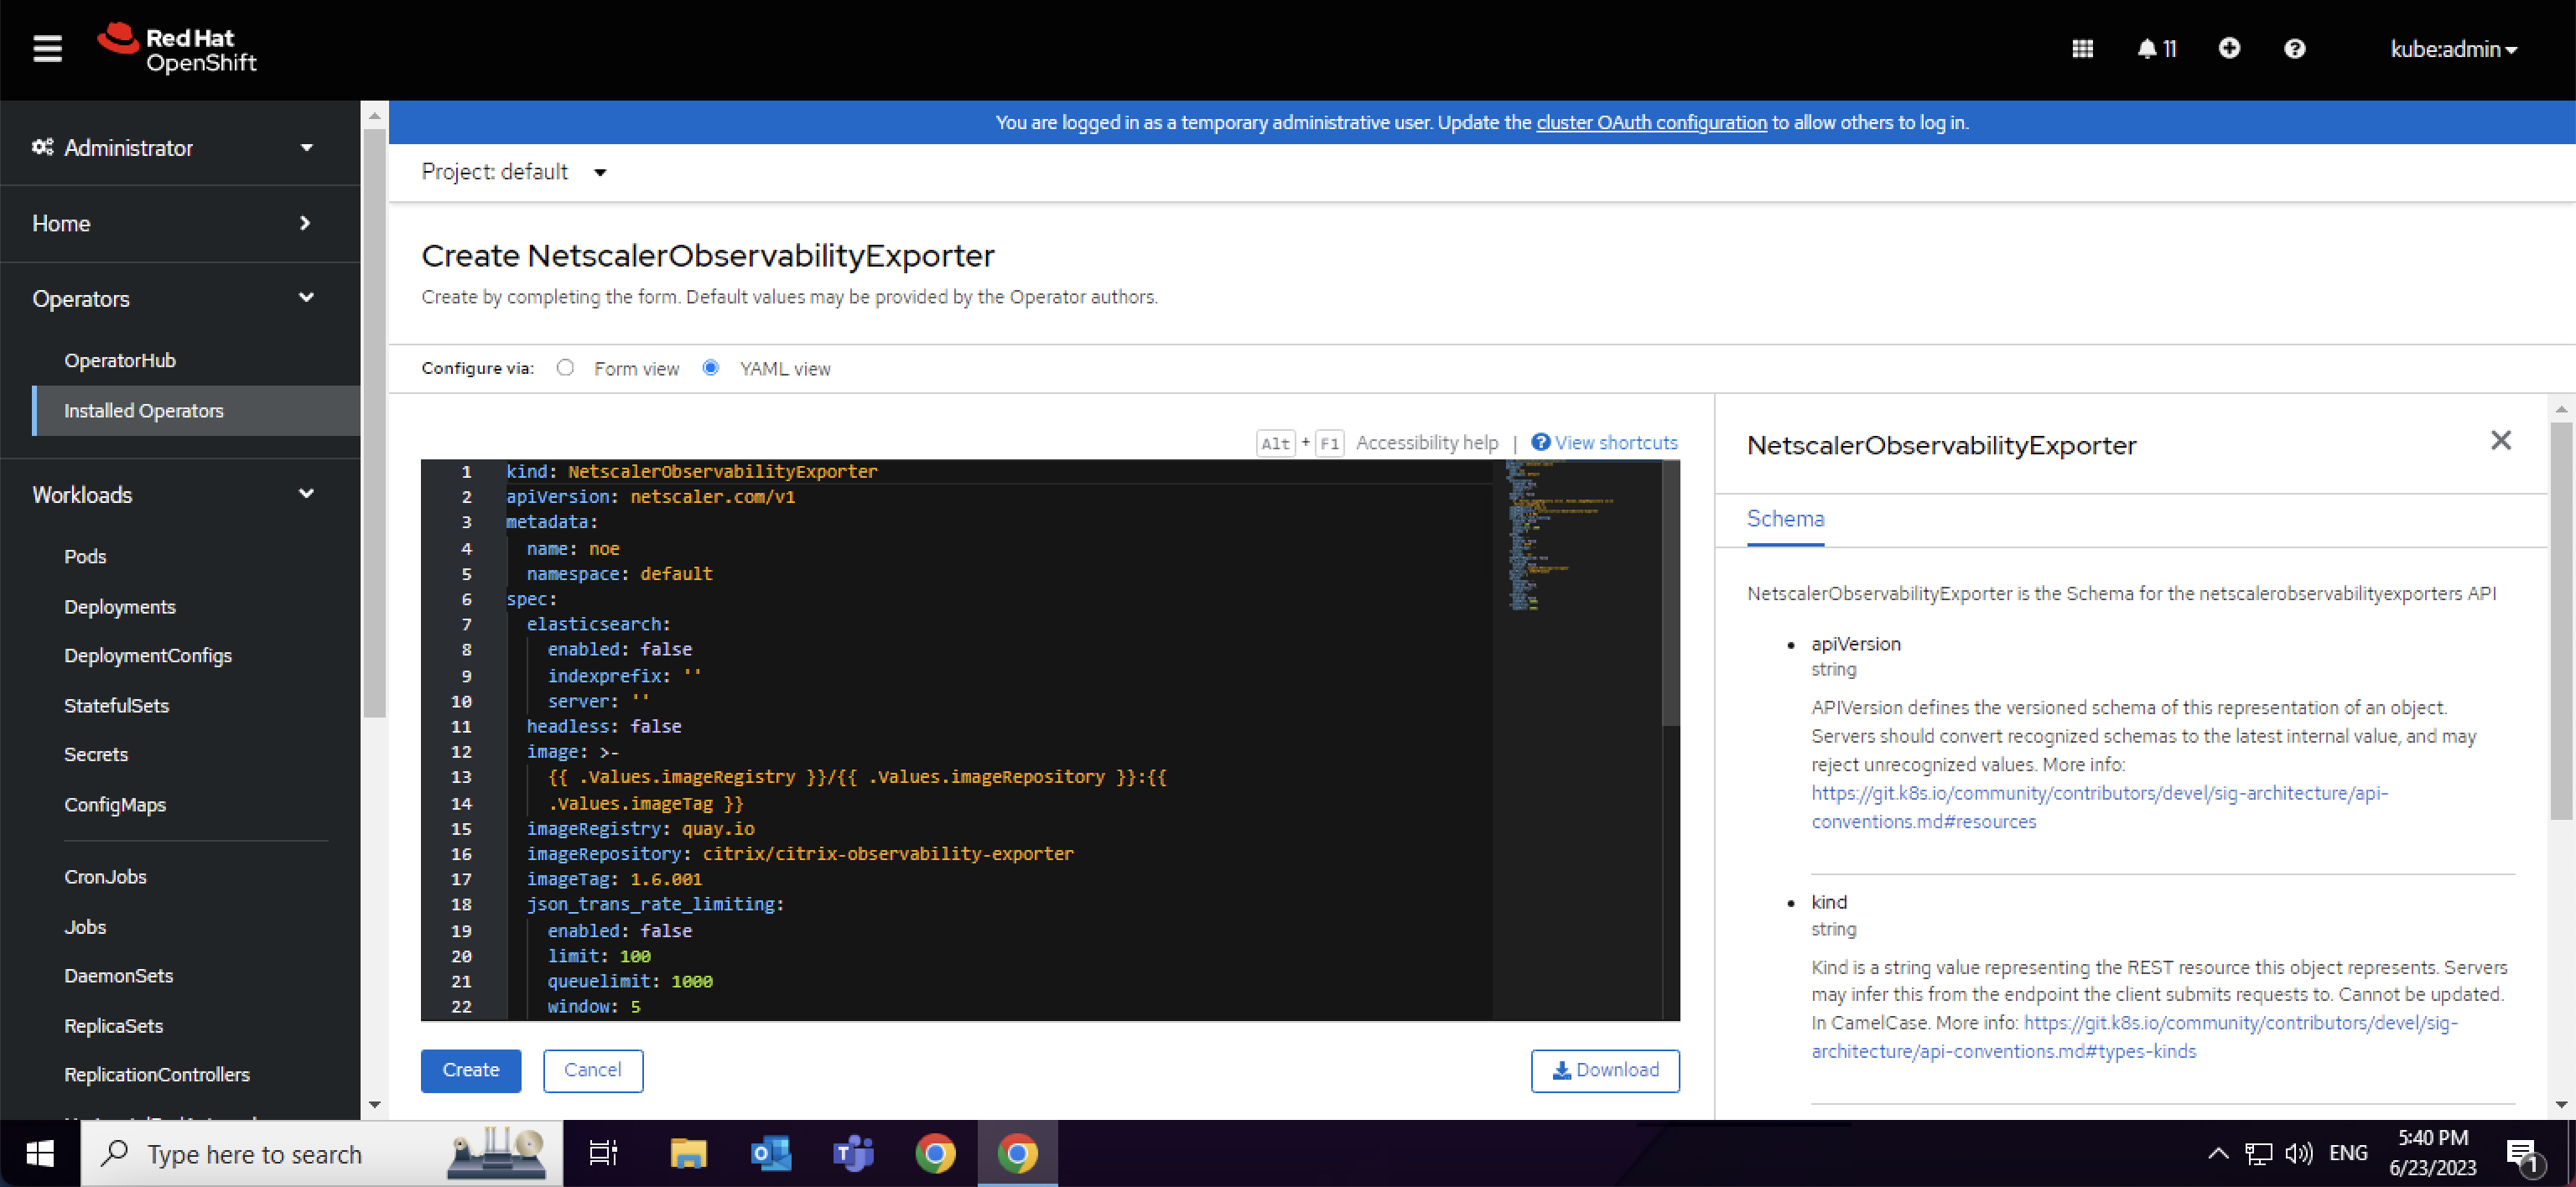
-
Refer the following table that lists the mandatory and optional parameters and their default values that you can configure during installation.
Parameters Mandatory or Optional Default value Description acceptLicense Mandatory no Set this value to Yesto accept the NSOE EULA.affinity Optional N/A Affinity labels for pod assignment. nodePortRequired Optional false Set this parameter to true to create a NSOE nodeport service. nodeSelector Optional N/A The node label key:value pair to be used for the nodeSelector option in an NSOE deployment. podAnnotations Optional N/A Map of annotations to add to the pods. pullPolicy Optional IfNotPresent The NSOE image pull policy. replicas Optional 1 The number of NSOE pods that run at any given time. resources Optional N/A CPU/memory resources for an NSOE container. tolerations Optional N/A The tolerations for an NSOE deployment. headless Optional false Set this parameter to trueto create a headless service.image Mandatory quay.io/netscaler/netscaler-observability-exporter@shavalue of latest NSOE image The NSOE image hosted on Quay.io. nsoeLogLevel Optional INFO The log level to control the logs generated by NSOE. The supported log levels are: CRITICAL,ERROR,WARNING,INFO,DEBUG,TRACE, andNONE.Parameters Mandatory or Optional Default value Description elasticsearch enabled Optional false Set this parameter to trueto enable an Elasticsearch endpoint for transactions.server Optional http://elasticsearch:9200 The Elasticsearch endpoint. Parameters Mandatory or Optional Default value Description jsonTransRateLimiting enabled Optional false Set this parameter to trueto enable rate-limiting of transactions for JSON-based endpoints, such asSplunk,ElasticSearch, andZipkin.limit Optional 100 The rate limit for JSON transactions. Hundred amounts to approximately 800 TPS. queueLimit Optional 1000 The amount of transactional data that can be saved before NSOE starts shedding them. For Zipkin, 1000 amounts to approximately 64 MB of data. For Splunk and ElasticSearch, 1000 amounts to approximately 32 MB of data. Window Optional 5 The recalculation window in seconds. The lower the window size (any value greater than 0), the more effective is the rate limiting. However, setting a lower window size results in CPU overhead. Parameters Mandatory or Optional Default value Description kafka auditLogs Optional no Set this parameter to yesto export the audit logs to Kafka.broker Optional N/A The kafka broker IP address. dataFormat Optional AVRO The format of the data exported to Kafka. Possible values are JSONandAVRO.enabled Optional false Set this parameter to trueto enable sending transaction data to the kafka server.events Optional no Set this parameter to yesto export events to Kafka.topic Optional HTTP The kafka topic details to upload data. Parameters Mandatory or Optional Default value Description nstracing enabled Optional false Set this parameter to trueto enable sending trace data to a tracing server.server Optional zipkin:9411/api/v1/spans The tracing server API endpoint. Parameters Mandatory or Optional Default value Description splunk authToken Optional N/A The authentication token for Splunk. enabled Optional false Set this parameter to trueto enable sending transaction data to the Splunk server.indexPrefix Optional N/A The Splunk index prefix to upload the transactions. server Optional N/A The Splunk server API endpoint. Parameters Mandatory or Optional Default value Description timeseries enabled Optional false Set this parameter to trueto enable metrics data upload in Prometheus format. Currently, Prometheus is the only metrics endpoint supported.Notes:
NSOE can be deployed in multiple namespaces. Also, multiple instances of NSOE can also be deployed in the same namespace, provided the deployment name is different for each instance. Before deploying, ensure that the prerequisite
any-uid SCCis deployed for the target namespace. -
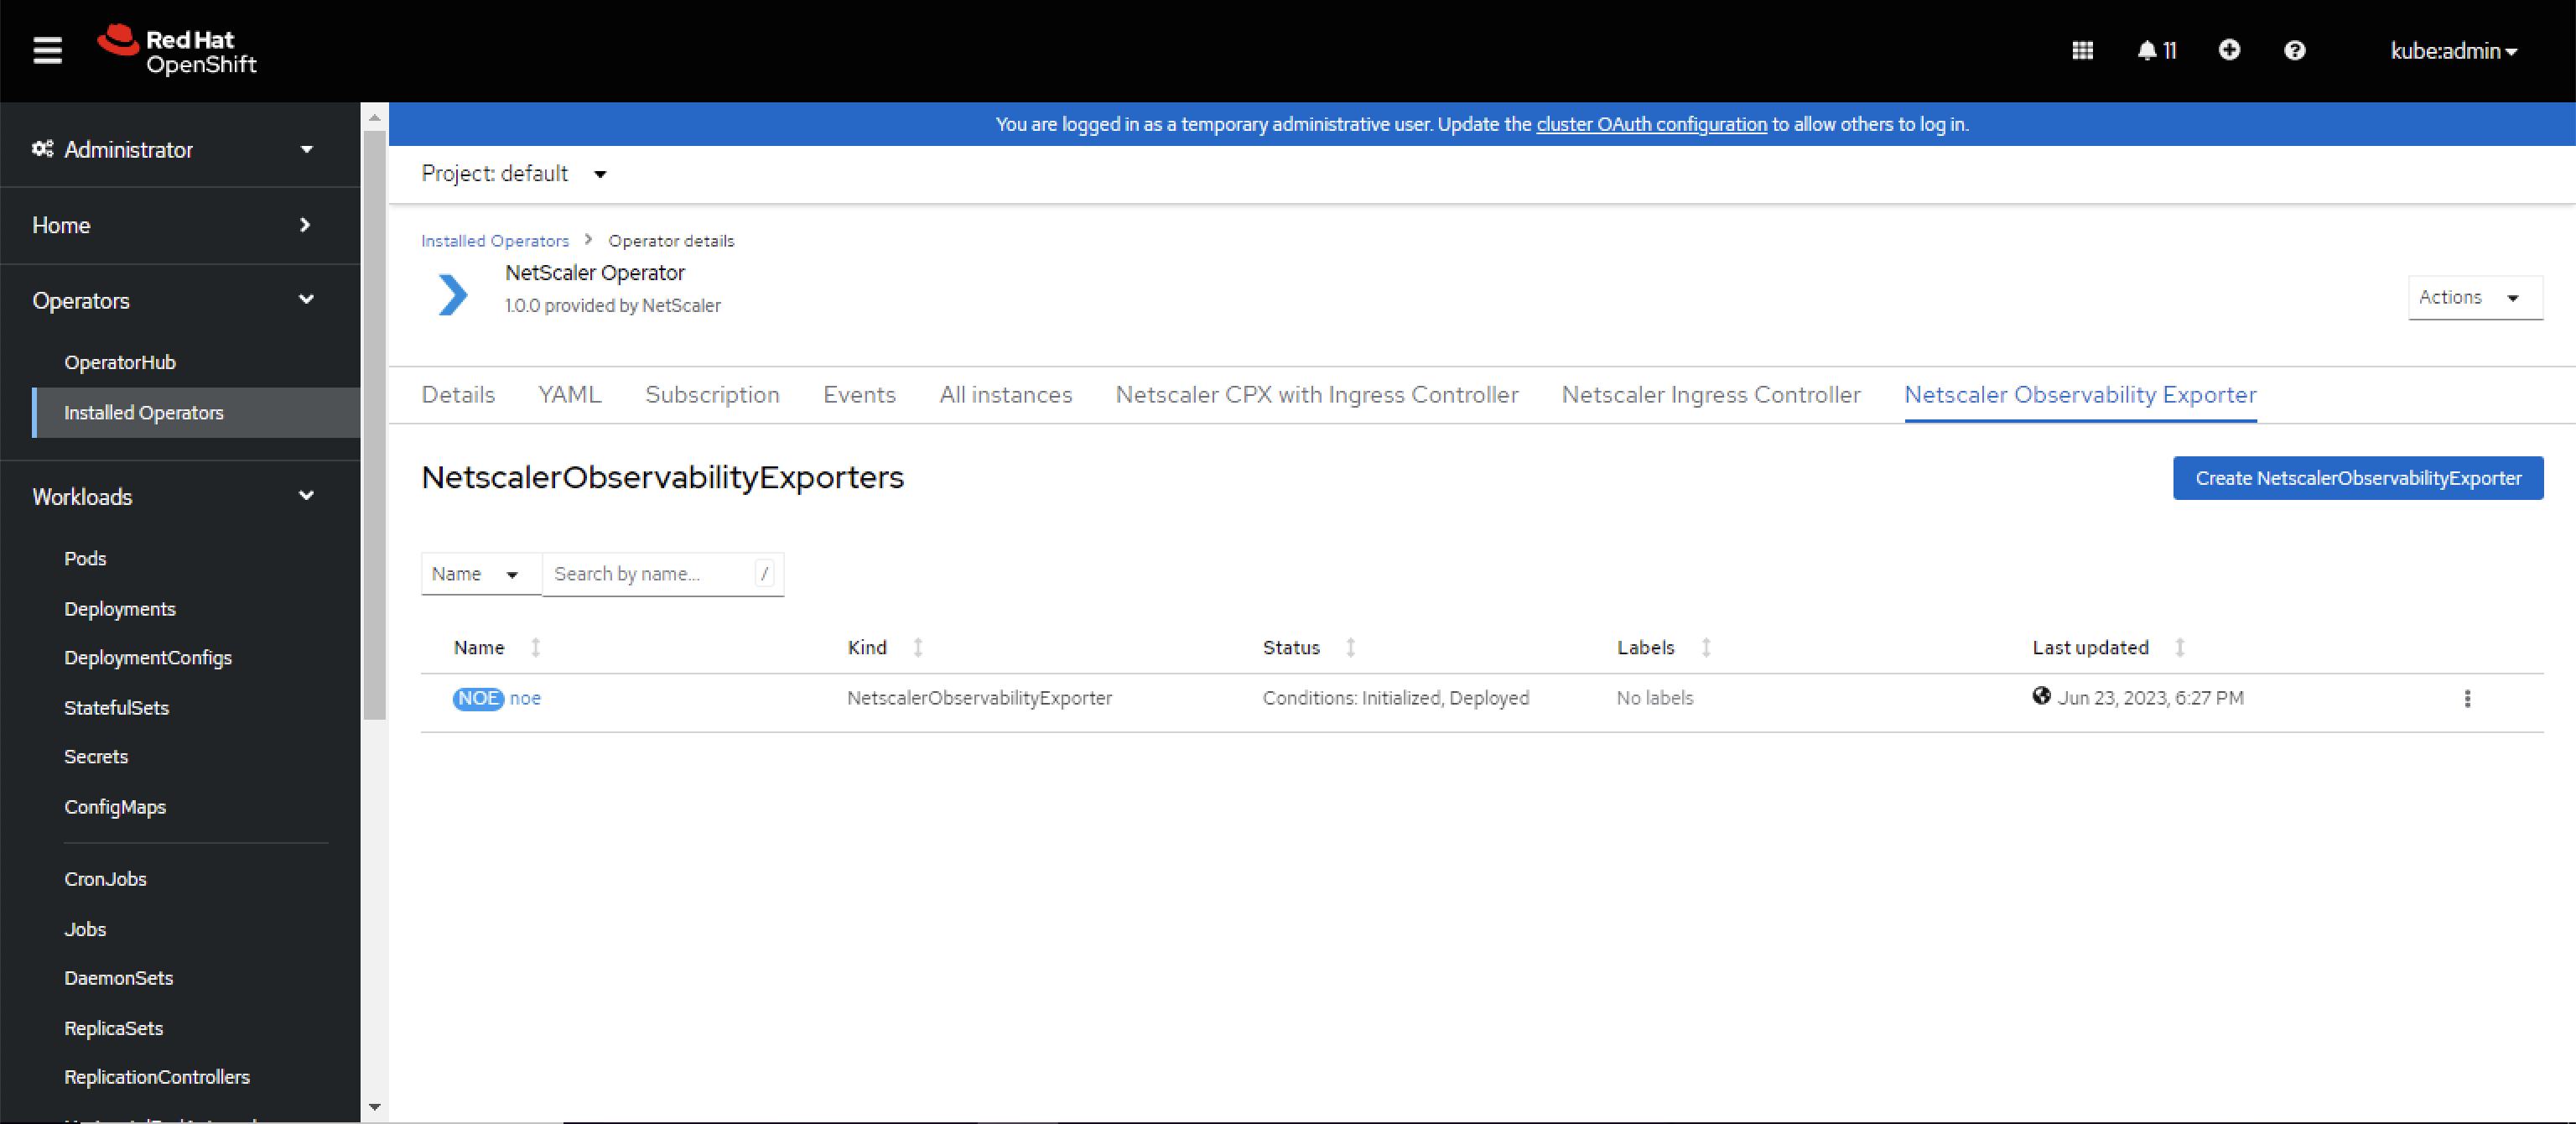
After updating the values for the required parameters, click Create.
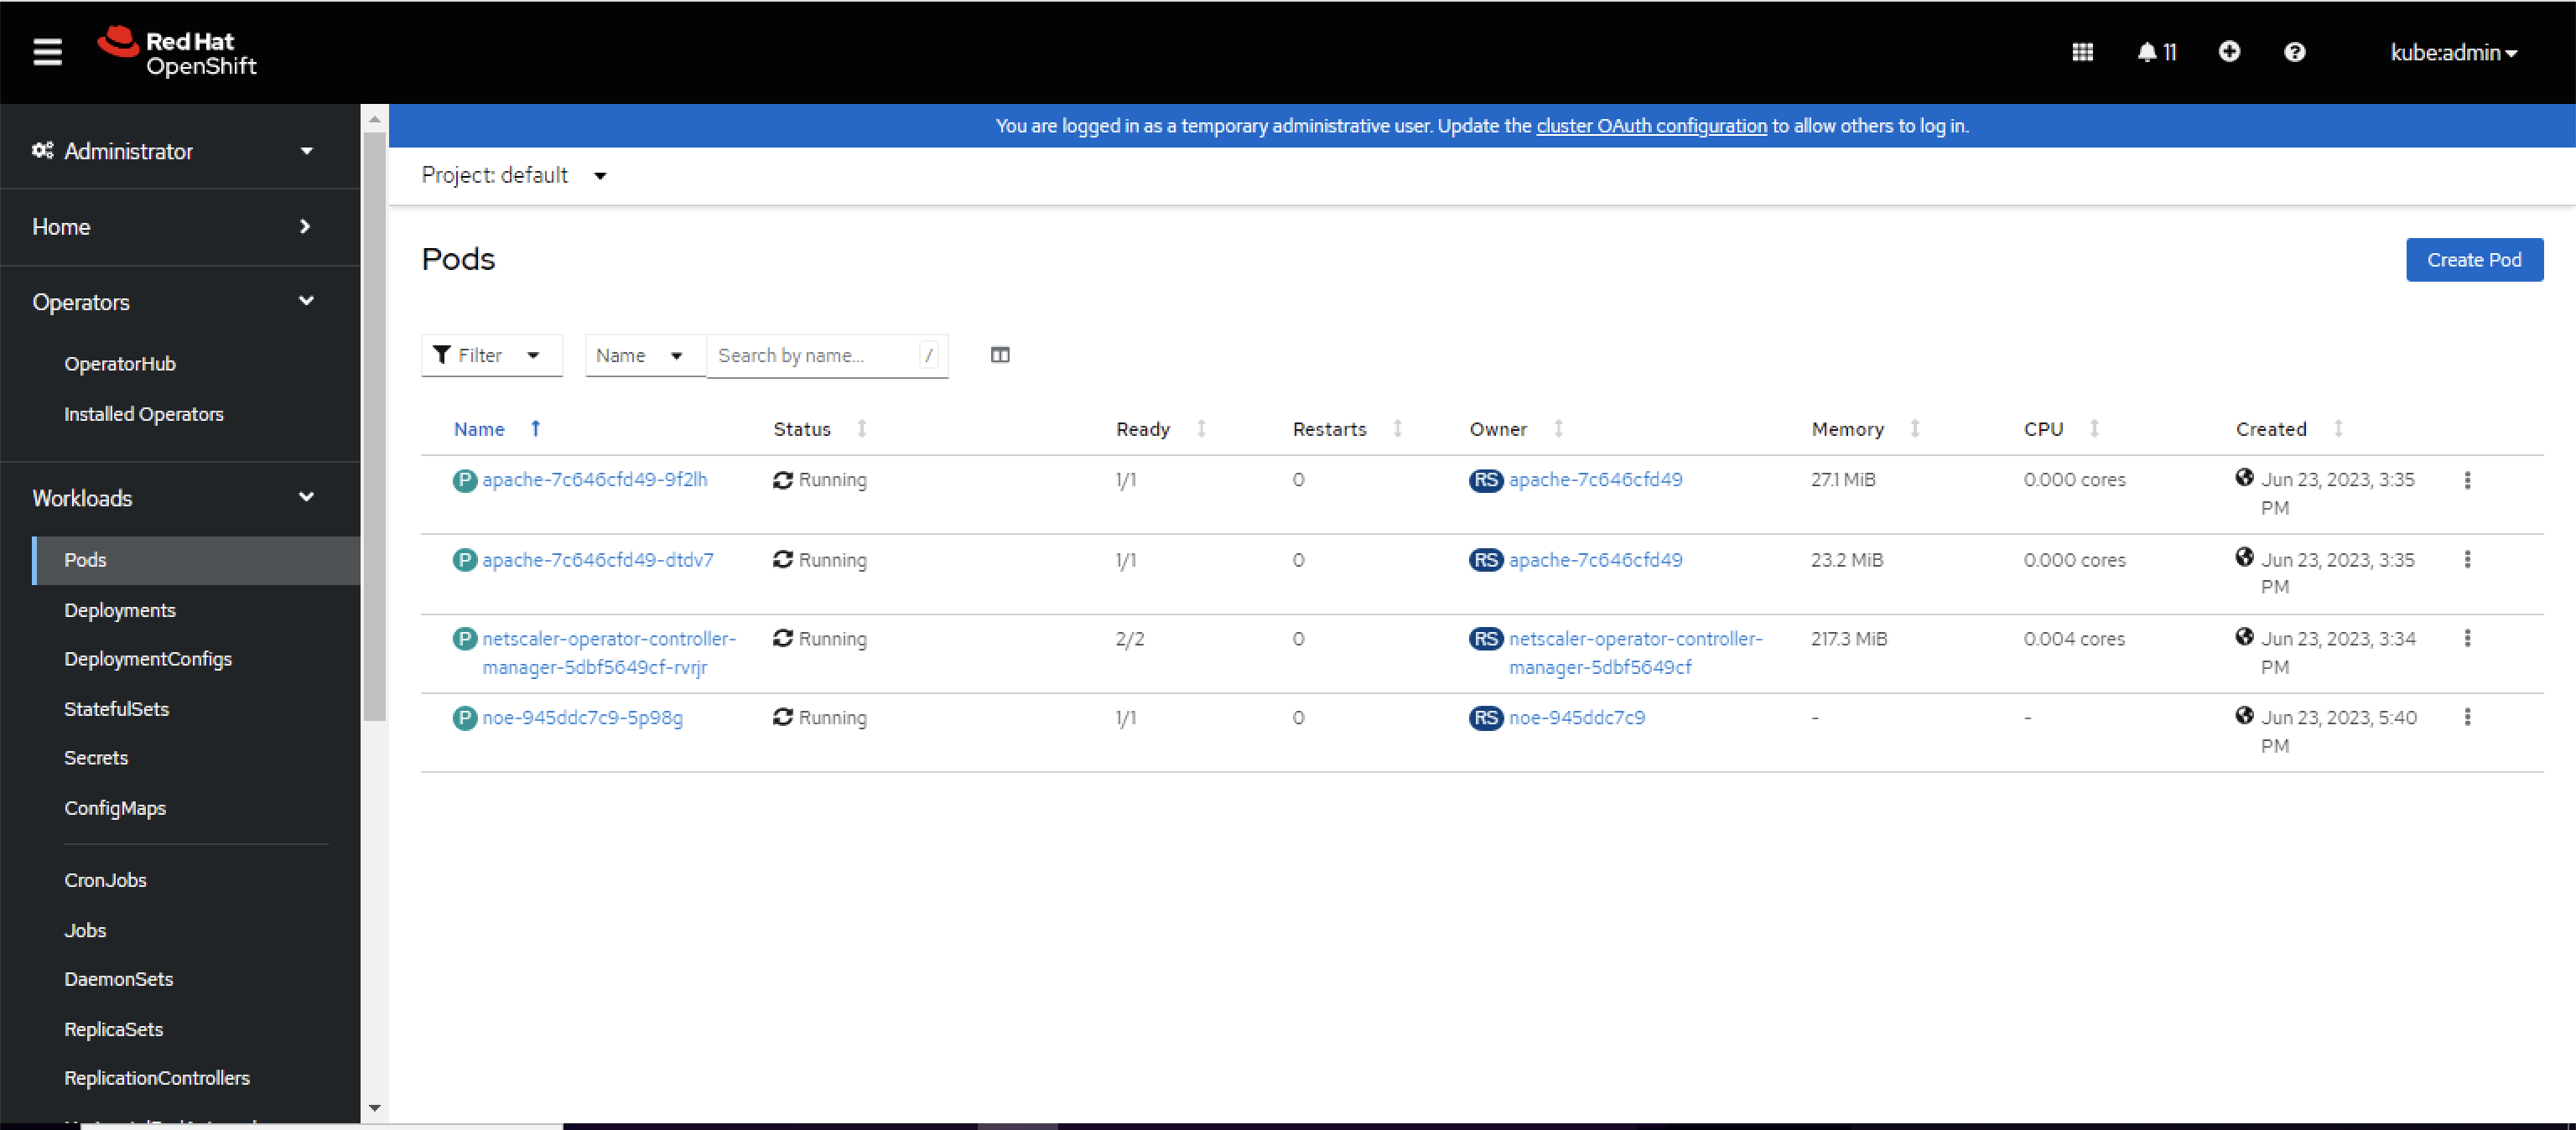
Ensure that the NetScaler Observability Exporter is successfully deployed.
-
Navigate to Workloads > Pods section and verify that the NetScaler Observability Exporter pod is up and running.