-
-
-
View recommendations and manage your ADCs and applications efficiently
-
-
-
-
Modify the reported severity of events that occur on NetScaler instances
-
Display event severities and SNMP trap details
-
Use ADM log messages for managing and monitoring your infrastructure
This content has been machine translated dynamically.
Dieser Inhalt ist eine maschinelle Übersetzung, die dynamisch erstellt wurde. (Haftungsausschluss)
Cet article a été traduit automatiquement de manière dynamique. (Clause de non responsabilité)
Este artículo lo ha traducido una máquina de forma dinámica. (Aviso legal)
此内容已经过机器动态翻译。 放弃
このコンテンツは動的に機械翻訳されています。免責事項
이 콘텐츠는 동적으로 기계 번역되었습니다. 책임 부인
Este texto foi traduzido automaticamente. (Aviso legal)
Questo contenuto è stato tradotto dinamicamente con traduzione automatica.(Esclusione di responsabilità))
This article has been machine translated.
Dieser Artikel wurde maschinell übersetzt. (Haftungsausschluss)
Ce article a été traduit automatiquement. (Clause de non responsabilité)
Este artículo ha sido traducido automáticamente. (Aviso legal)
この記事は機械翻訳されています.免責事項
이 기사는 기계 번역되었습니다.책임 부인
Este artigo foi traduzido automaticamente.(Aviso legal)
这篇文章已经过机器翻译.放弃
Questo articolo è stato tradotto automaticamente.(Esclusione di responsabilità))
Translation failed!
Display event severities and SNMP trap details
When you create an event and its settings in NetScaler Application Delivery Management (ADM), you can view the event immediately on the Event Summary page. Similarly, you can view and monitor the health, up time, models, and the versions of all Citrix Application Delivery Controller™ (ADC) instances added to your NetScaler ADM server in minute detail on the Infrastructure Dashboard.
On the Infrastructure dashboard, you can now mask irrelevant values so that you can more easily view and monitor information such as event by severities, health, up time, models, and version of NetScaler instances in minute detail.
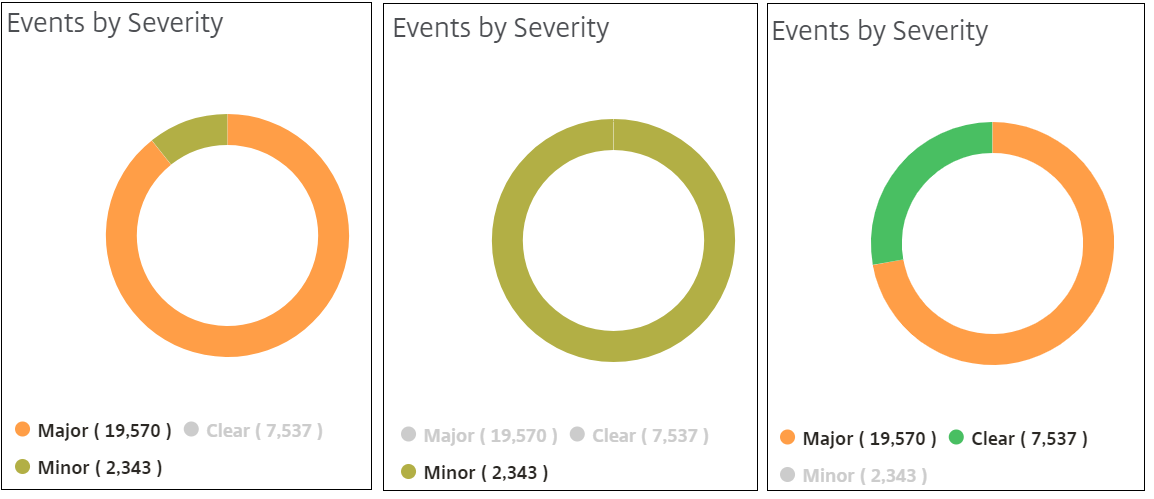
For example, events with a Critical severity level might occur rarely. However, when these critical events do occur on your network, you might want to further investigate, troubleshoot, and monitor where and when the event occurred. If you select all severity levels except Critical, the graph displays only the occurrences of critical events. Also, by clicking the graph, you are taken to the Severity based events page, where you can see all the details regarding when a critical event occurred for the duration that you’ve selected: the instance source, the date, category, and message notification sent when the critical event occurred.
Similarly, you can view the health of a NetScaler VPX instance on the Dashboard. You can mask the time during which the instance was up and running, and display only the times the instance was out of service. By clicking on the graph, you are taken to that instance’s page, where the out of service filter is already applied, and see details such as host name, the number of HTTP requests it received per second, CPU usage, and so on. You can also select the instance and see the particular Citrix instance’s dashboard for more details.
To select specific events by severity in NetScaler® ADM:
-
Log on to NetScaler ADM, using your administrator credentials.
-
Navigate to Infrastructure > Dashboard.
Or,
Navigate to Infrastructure > Events > Reports.
-
From the menu in the upper-right corner of the page, select the duration for which you want to see events by severity.

-
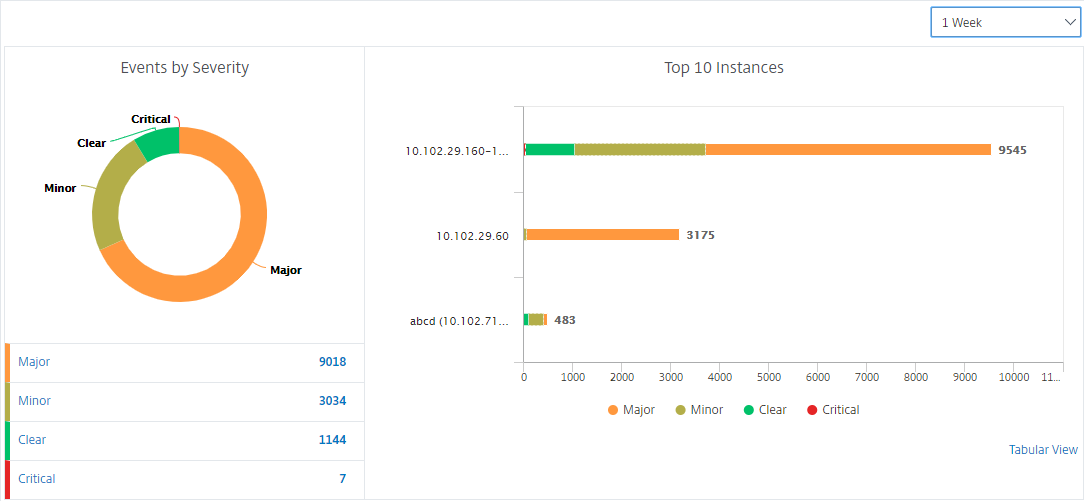
The Events by Severity donut chart displays a visual representation of all the events by their severity. Different types of events are represented as different colored sections, and the length of each section corresponds to the total number of events of that type of severity.
-
You can click each section on the donut chart to display the corresponding Severity based events page, which shows the following details for the selected severity for the selected duration:
-
Instance Source
-
Data of the event
-
Category of events generated by the NetScaler instance
-
Message notification sent
Note
Below the donut chart you can see a list of severities that are represented in the chart. By default, a donut chart displays all events of all severity types, and therefore all severity types in the list are highlighted. You can toggle the severity types to more easily view and monitor your chosen severity.

-
To view NetScaler SNMP trap details on NetScaler ADM:
You can now view the details of each SNMP trap received from its managed NetScaler instances on the NetScaler ADM server on the Event Settings page. Navigate to Infrastructure > Events > Event Settings. For a specific trap received from your instance, you can view the following details in tabular format:
-
Category - Specifies the category of the instance to which the event belongs.
-
Severity - The severity of the event is indicated by colors and its severity type.
-
Description - Specifies the messages associated with the event.
For example, an event with the trap category monRespTimeoutBelowThresh, the description of the trap is displayed as “This trap is sent when the response timeout for a monitor probe comes back to normal, less than the threshold set.”
Share
Share
In this article
This Preview product documentation is Cloud Software Group Confidential.
You agree to hold this documentation confidential pursuant to the terms of your Cloud Software Group Beta/Tech Preview Agreement.
The development, release and timing of any features or functionality described in the Preview documentation remains at our sole discretion and are subject to change without notice or consultation.
The documentation is for informational purposes only and is not a commitment, promise or legal obligation to deliver any material, code or functionality and should not be relied upon in making Cloud Software Group product purchase decisions.
If you do not agree, select I DO NOT AGREE to exit.