Provider reports
The Provider Reports provide visibility into alerts, usage trends, and inventory aggregated across all the customers managed by a Provider.
In the Citrix SD-WAN Orchestrator for On-premises provider level UI, navigate to Reports.
Alerts
The provider can review all the events and alerts generated across all the customer networks.
The Summary view displays the number of high, medium, and low alerts for each customer.

You can also view the severity, site at which the alert originated, alert message, time, and other information under Details.
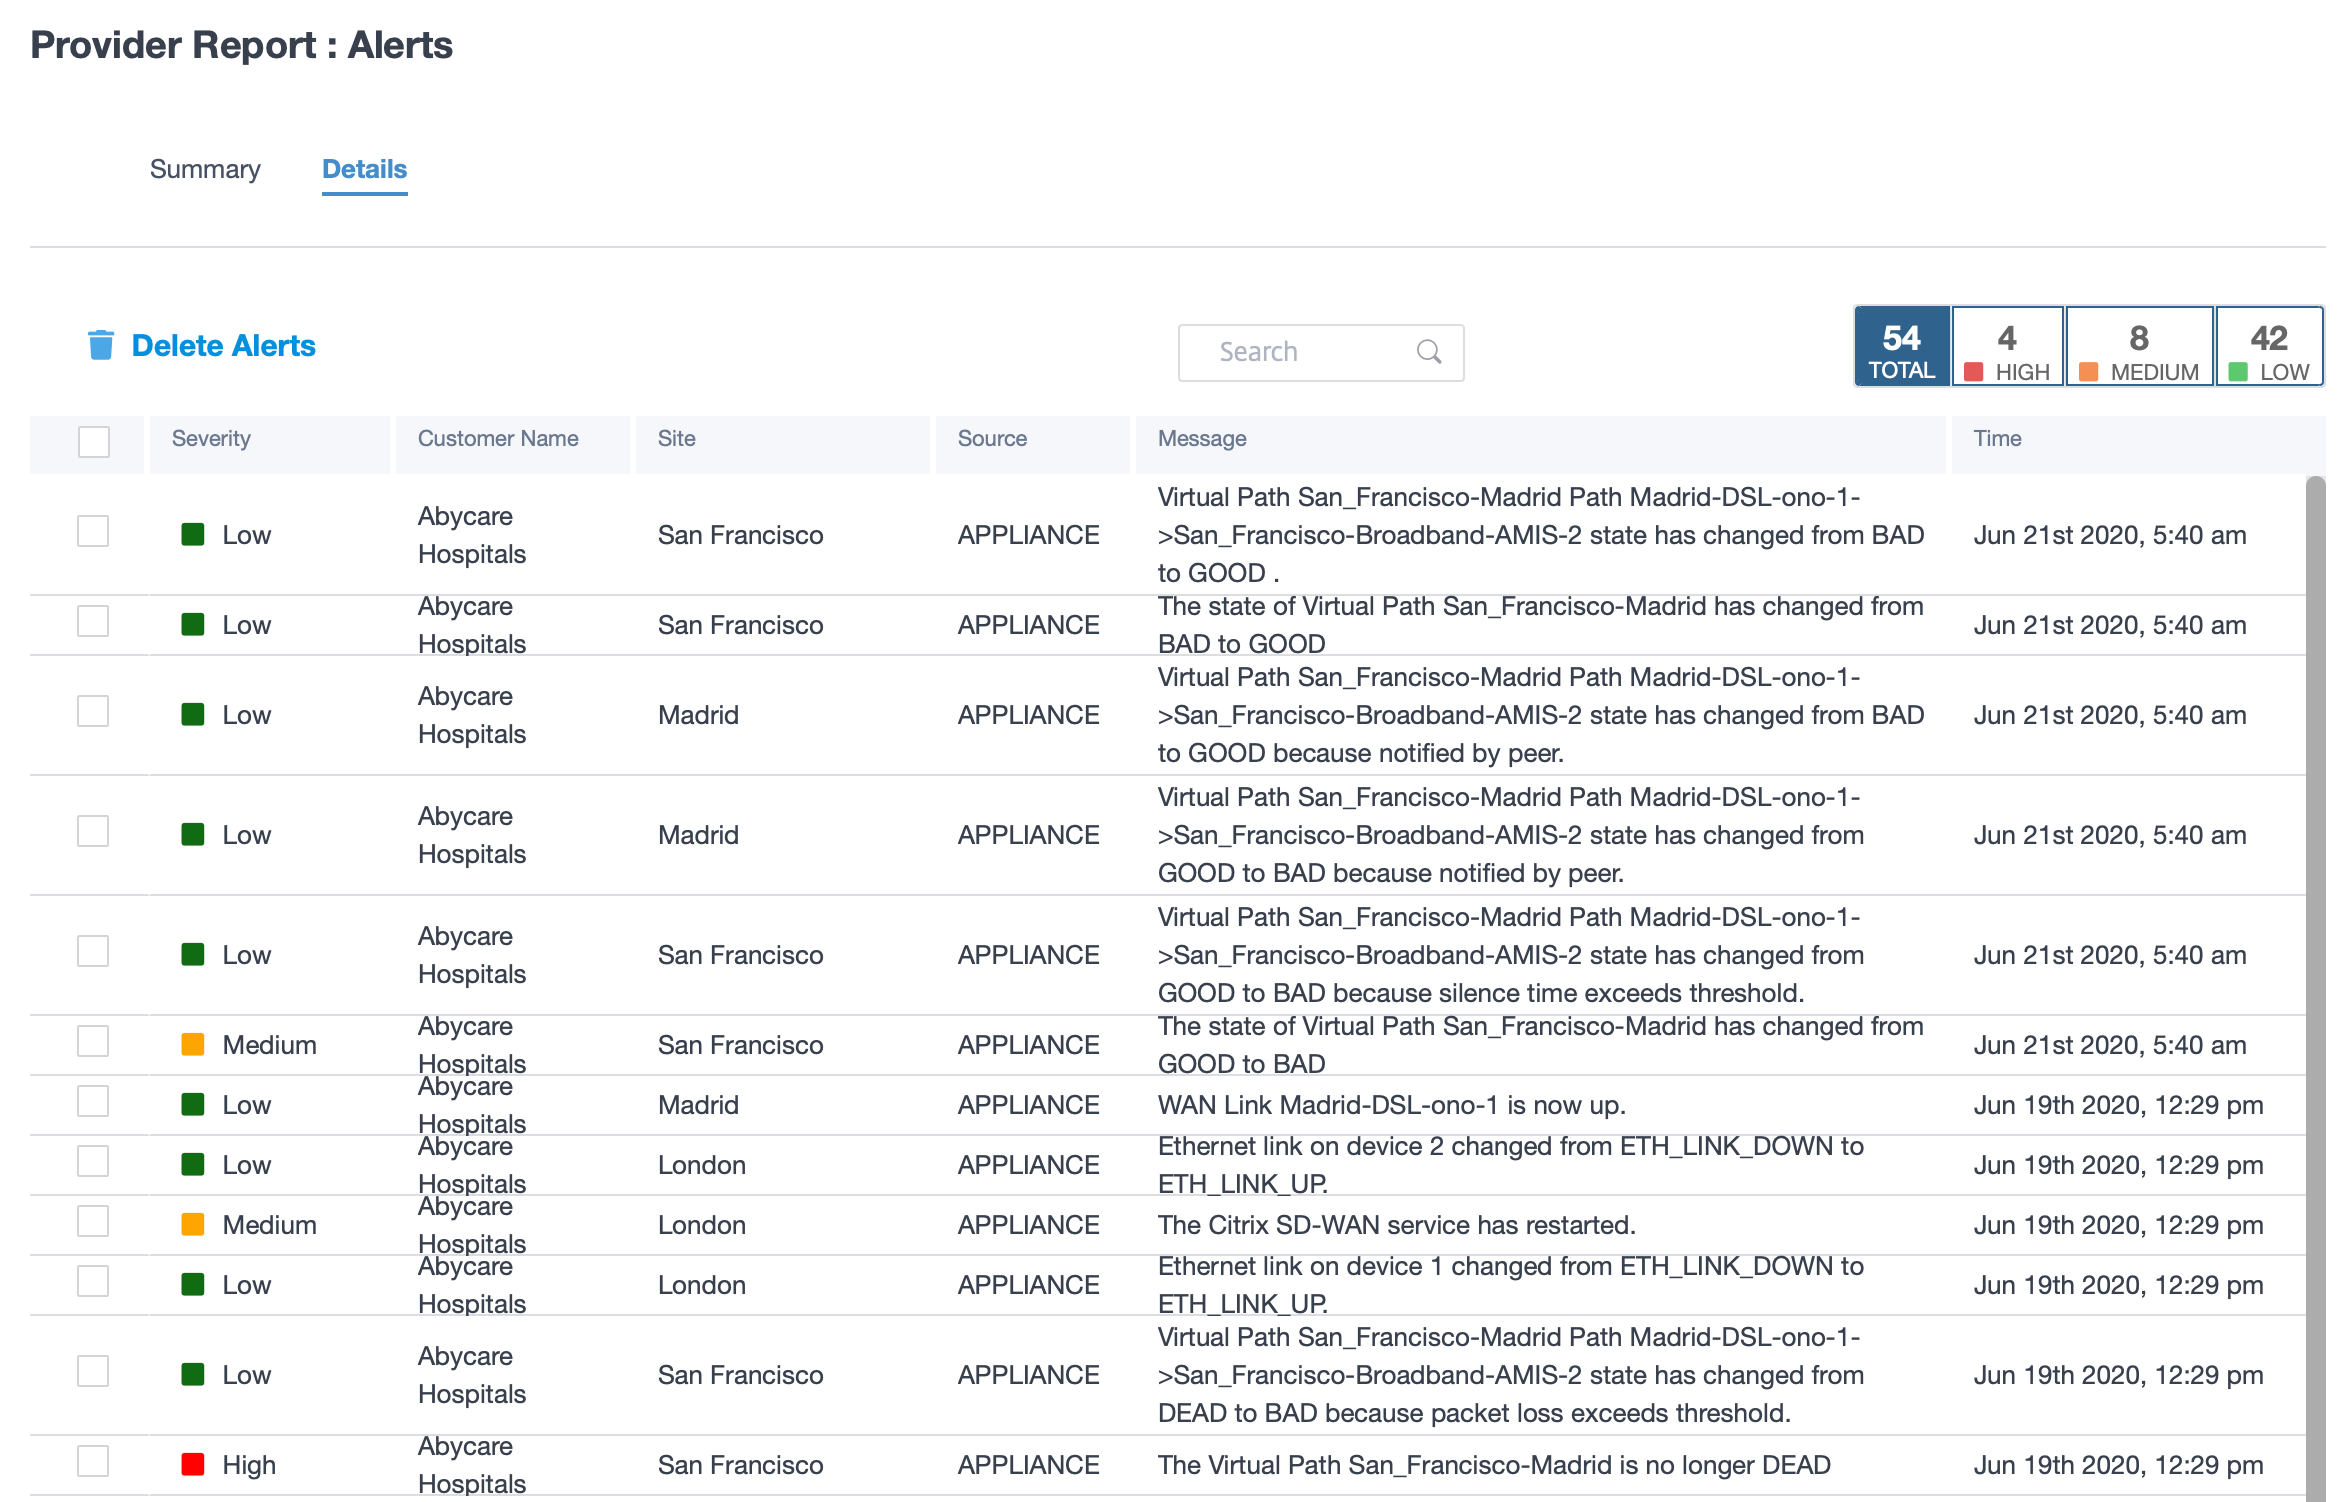
Suitable filtering options can be used as needed for example: Look for the high severity alerts across all the customers, or the alerts for a given customer and so on.
You can also select and delete alerts.
Usage
The provider can review cross-customer usage trends such as Top Applications, Top Application Categories, Application Bandwidth, and Top Sites.
Top application and application categories
The Top Applications and Top Application Categories chart shows the applications and application families that are widely used across all customer networks. This allows you to analyze the data consumption pattern and reassign the bandwidth limit for each class of data, if necessary.
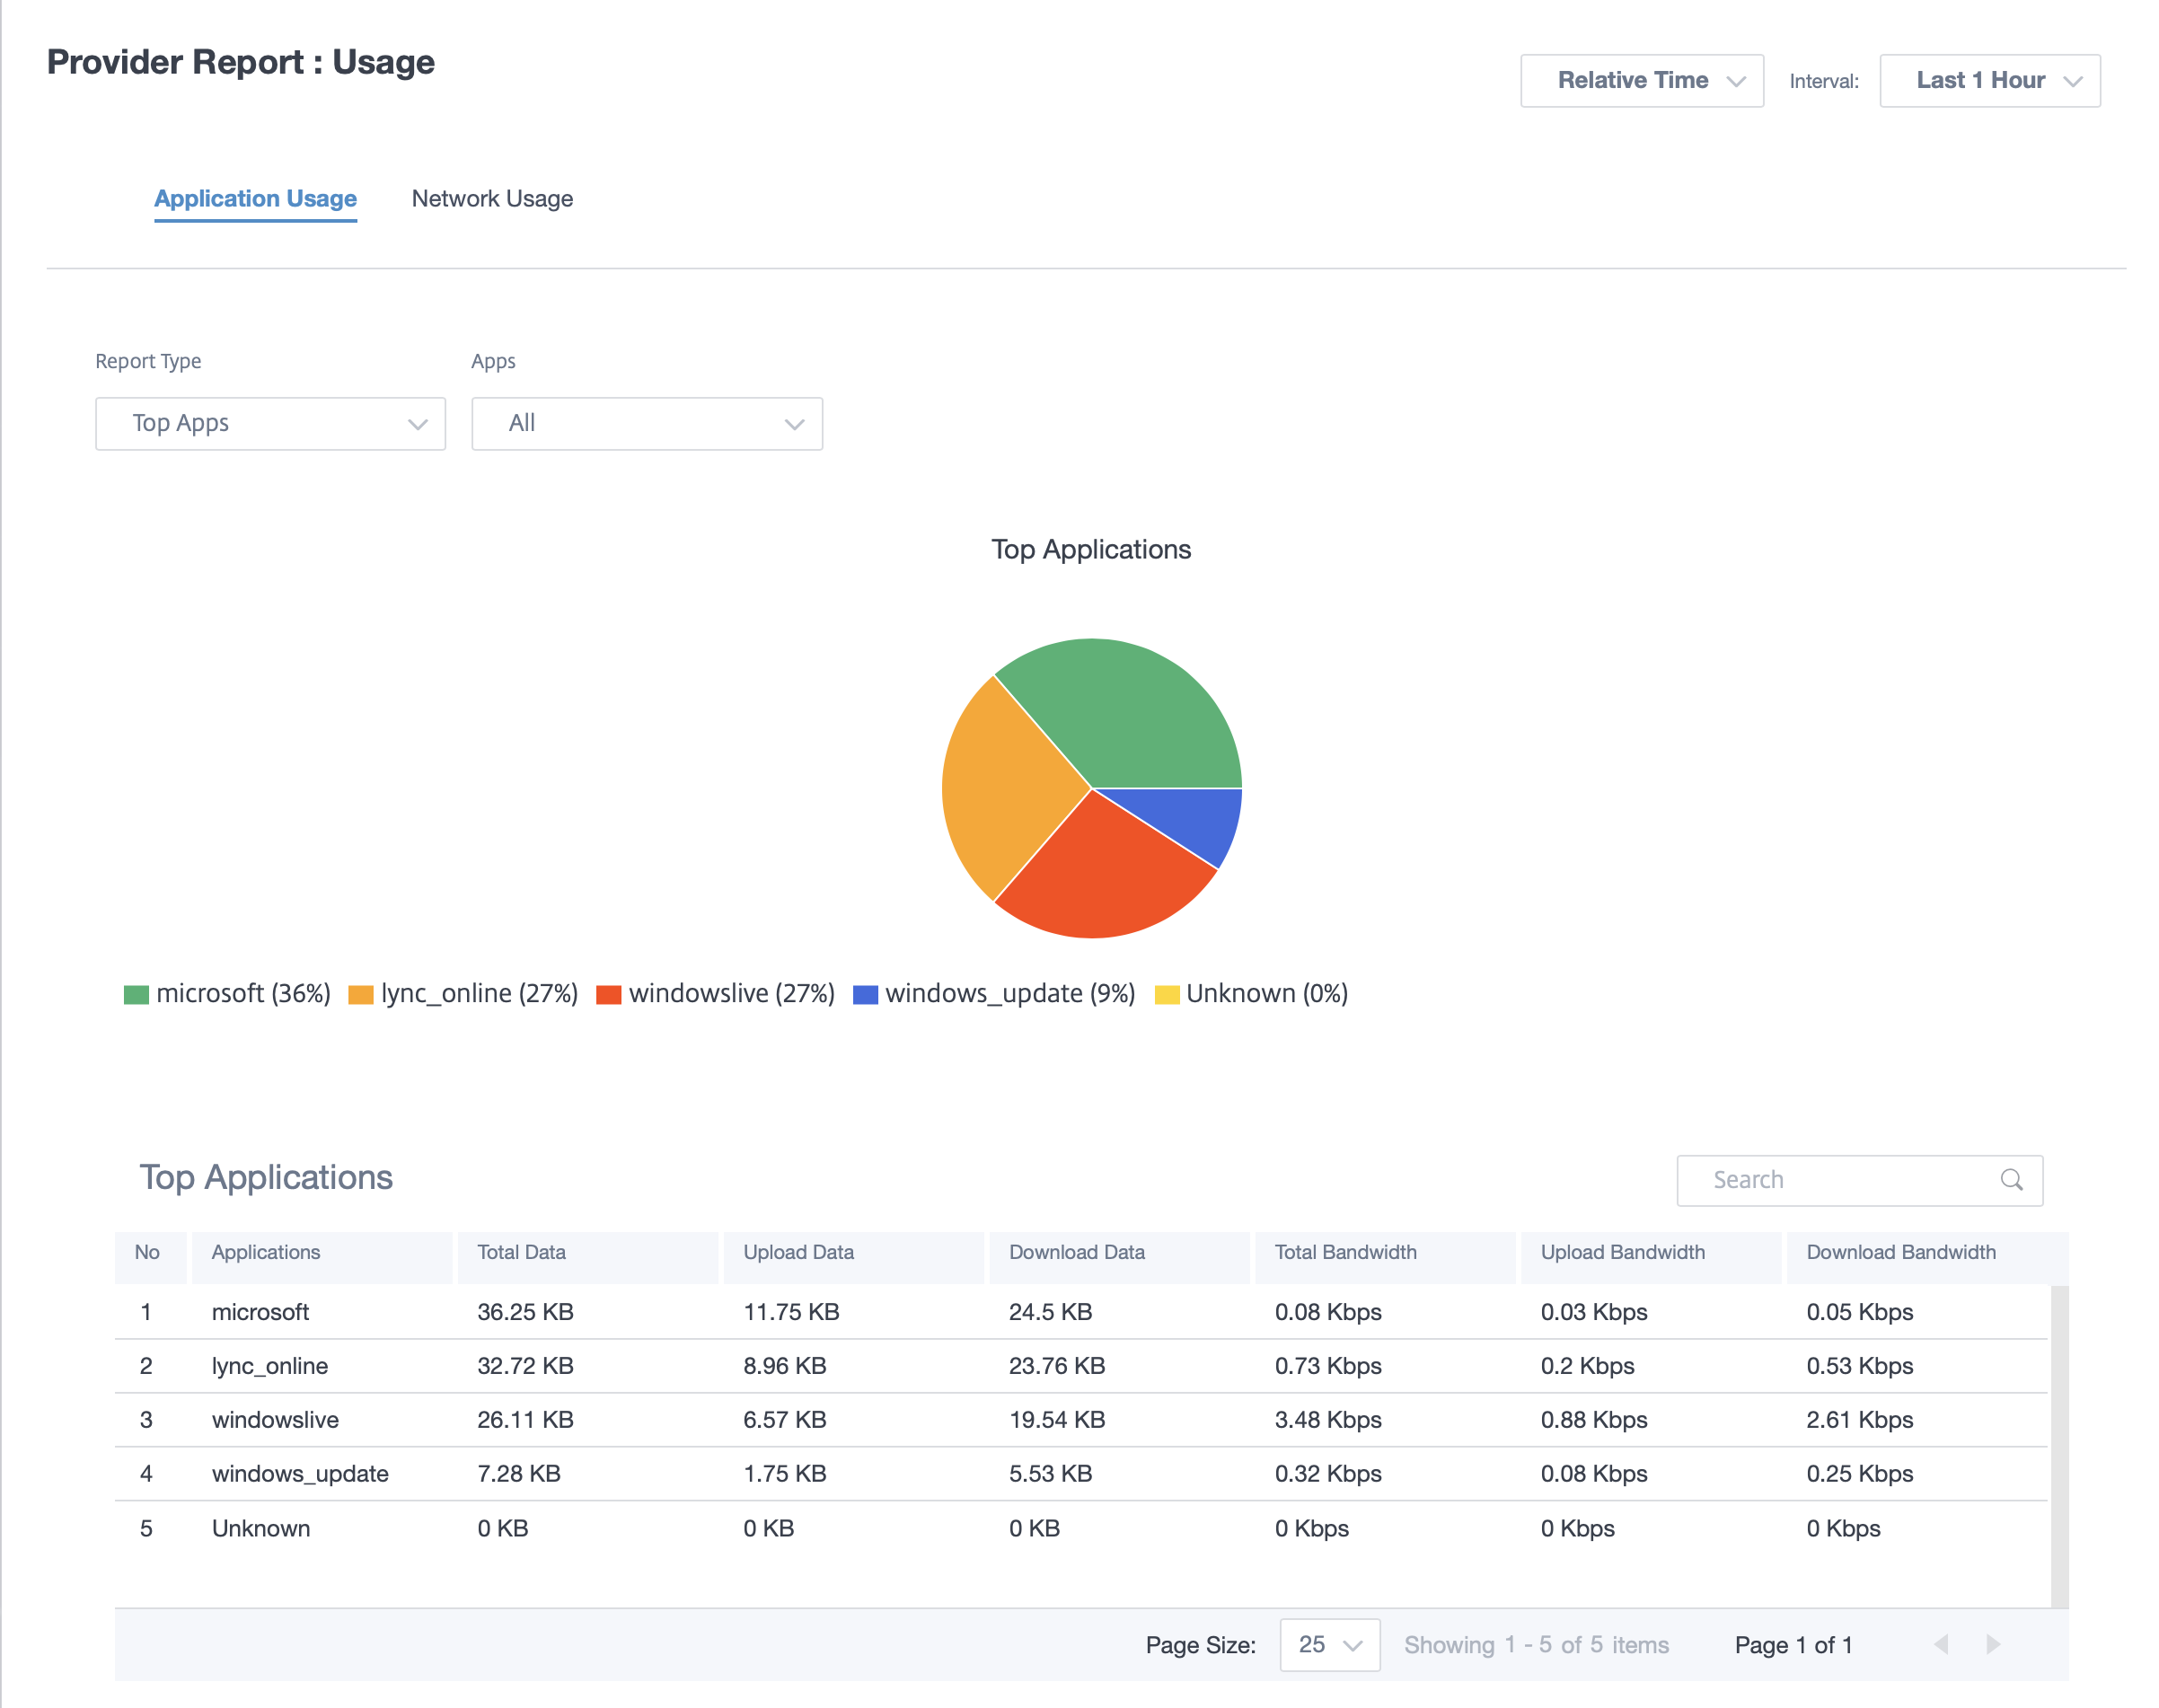
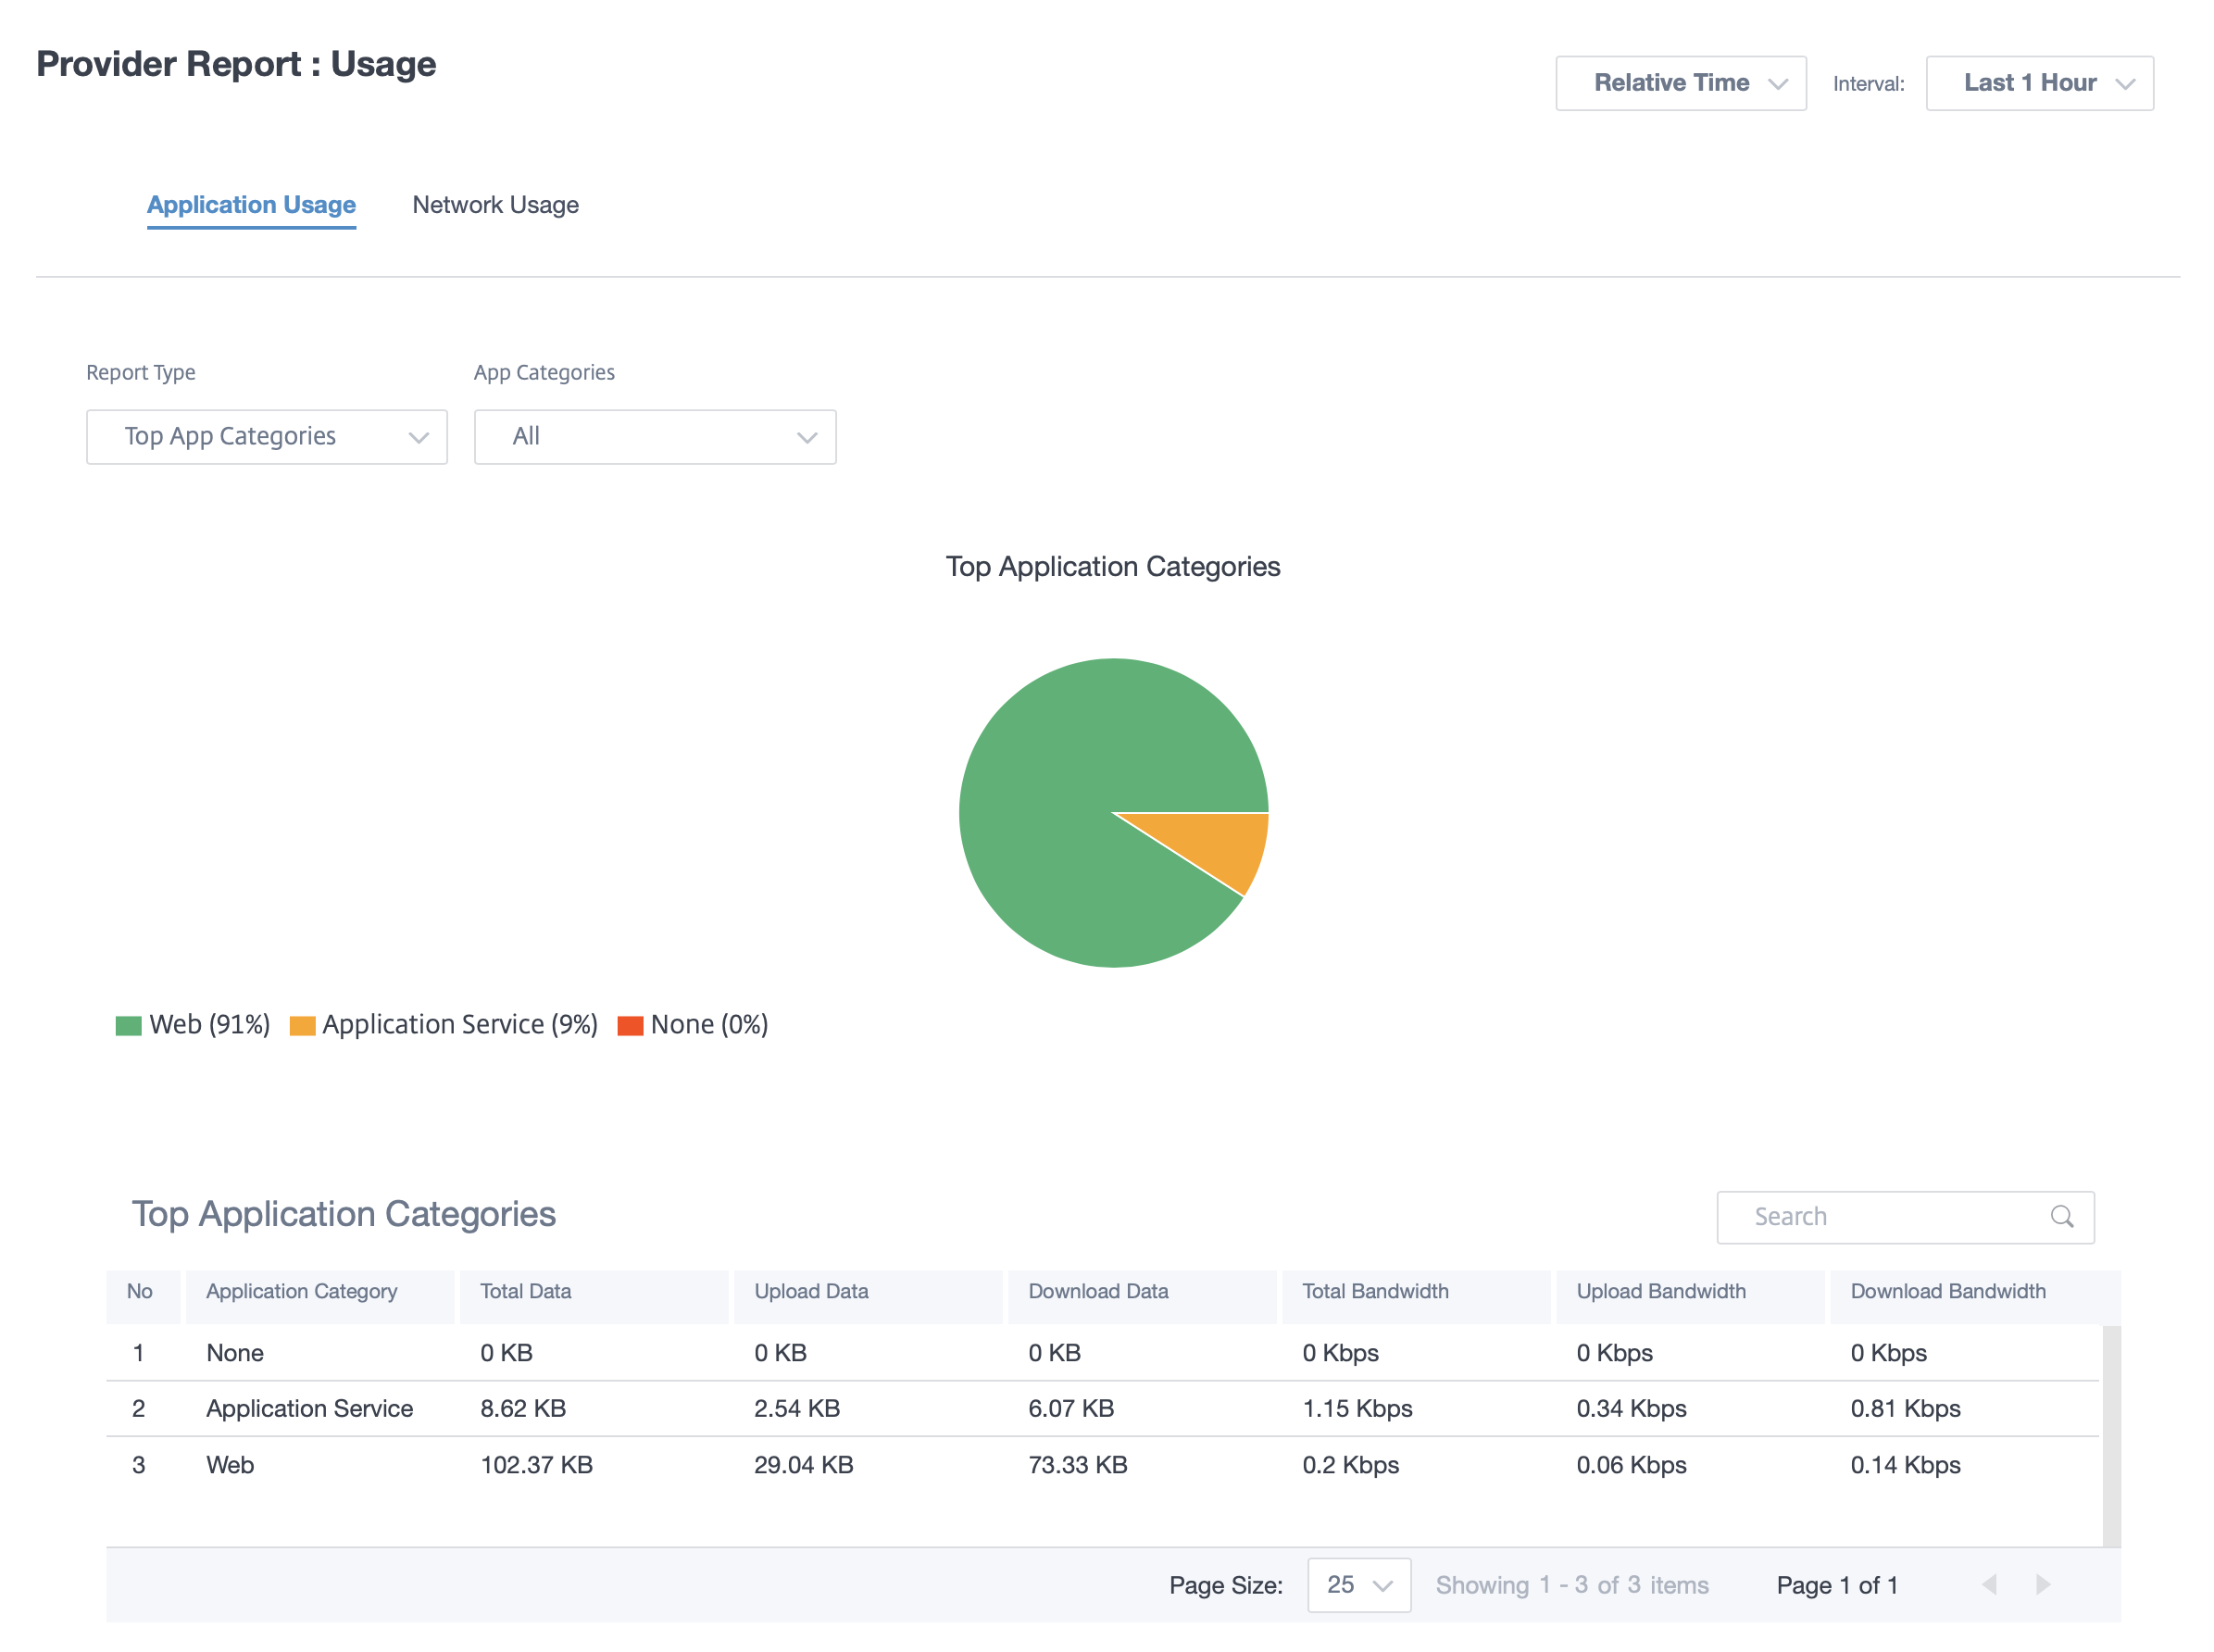
You can view the bandwidth usage statistics. The bandwidth statistics are collected for the selected time interval. You can filter the statistics report based on the Report Type, Apps or Apps Categories, and Metrics.
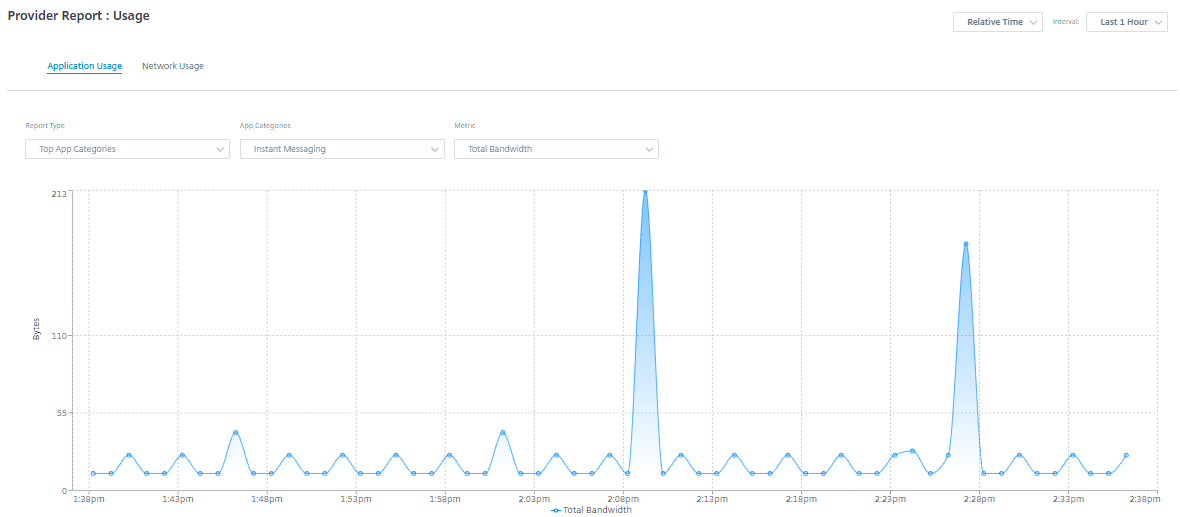
- Report Type: Select Top App or App Categories from the list.
- Apps/App Categories: Select top application or categories from the list.
- Metric: Select the bandwidth metric (such as Total Data, Incoming Data, Total Bandwidth) from the list.
Network usage
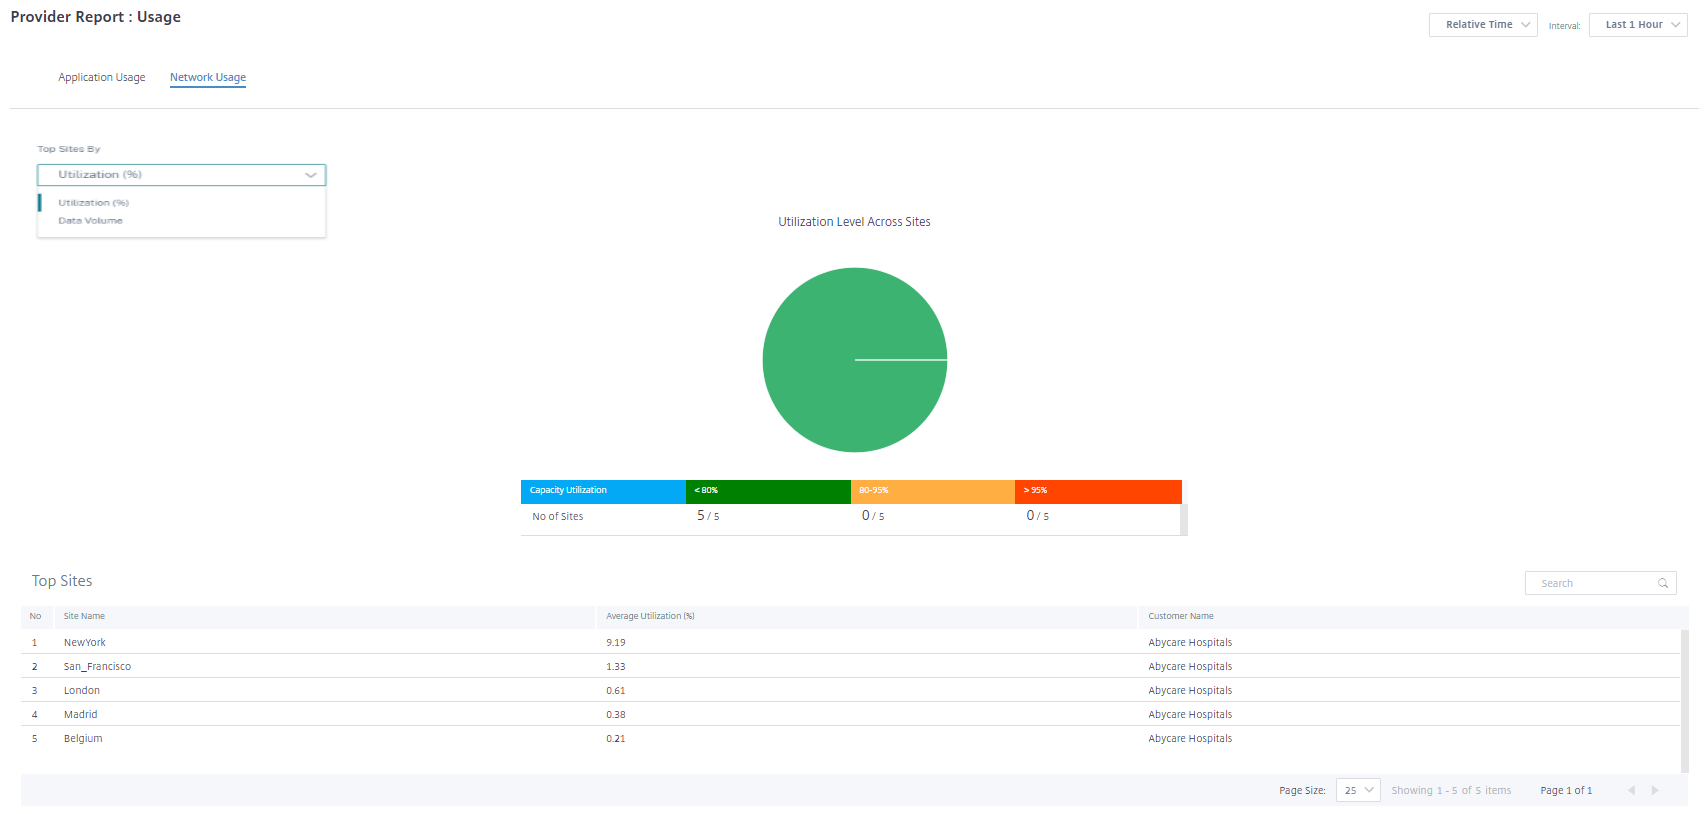
The network usage chart depicts the top 10 sites across all the customers that have the highest bandwidth usage. You can view the Sites by Utilization (%) or Data Volume (MB).
Inventory
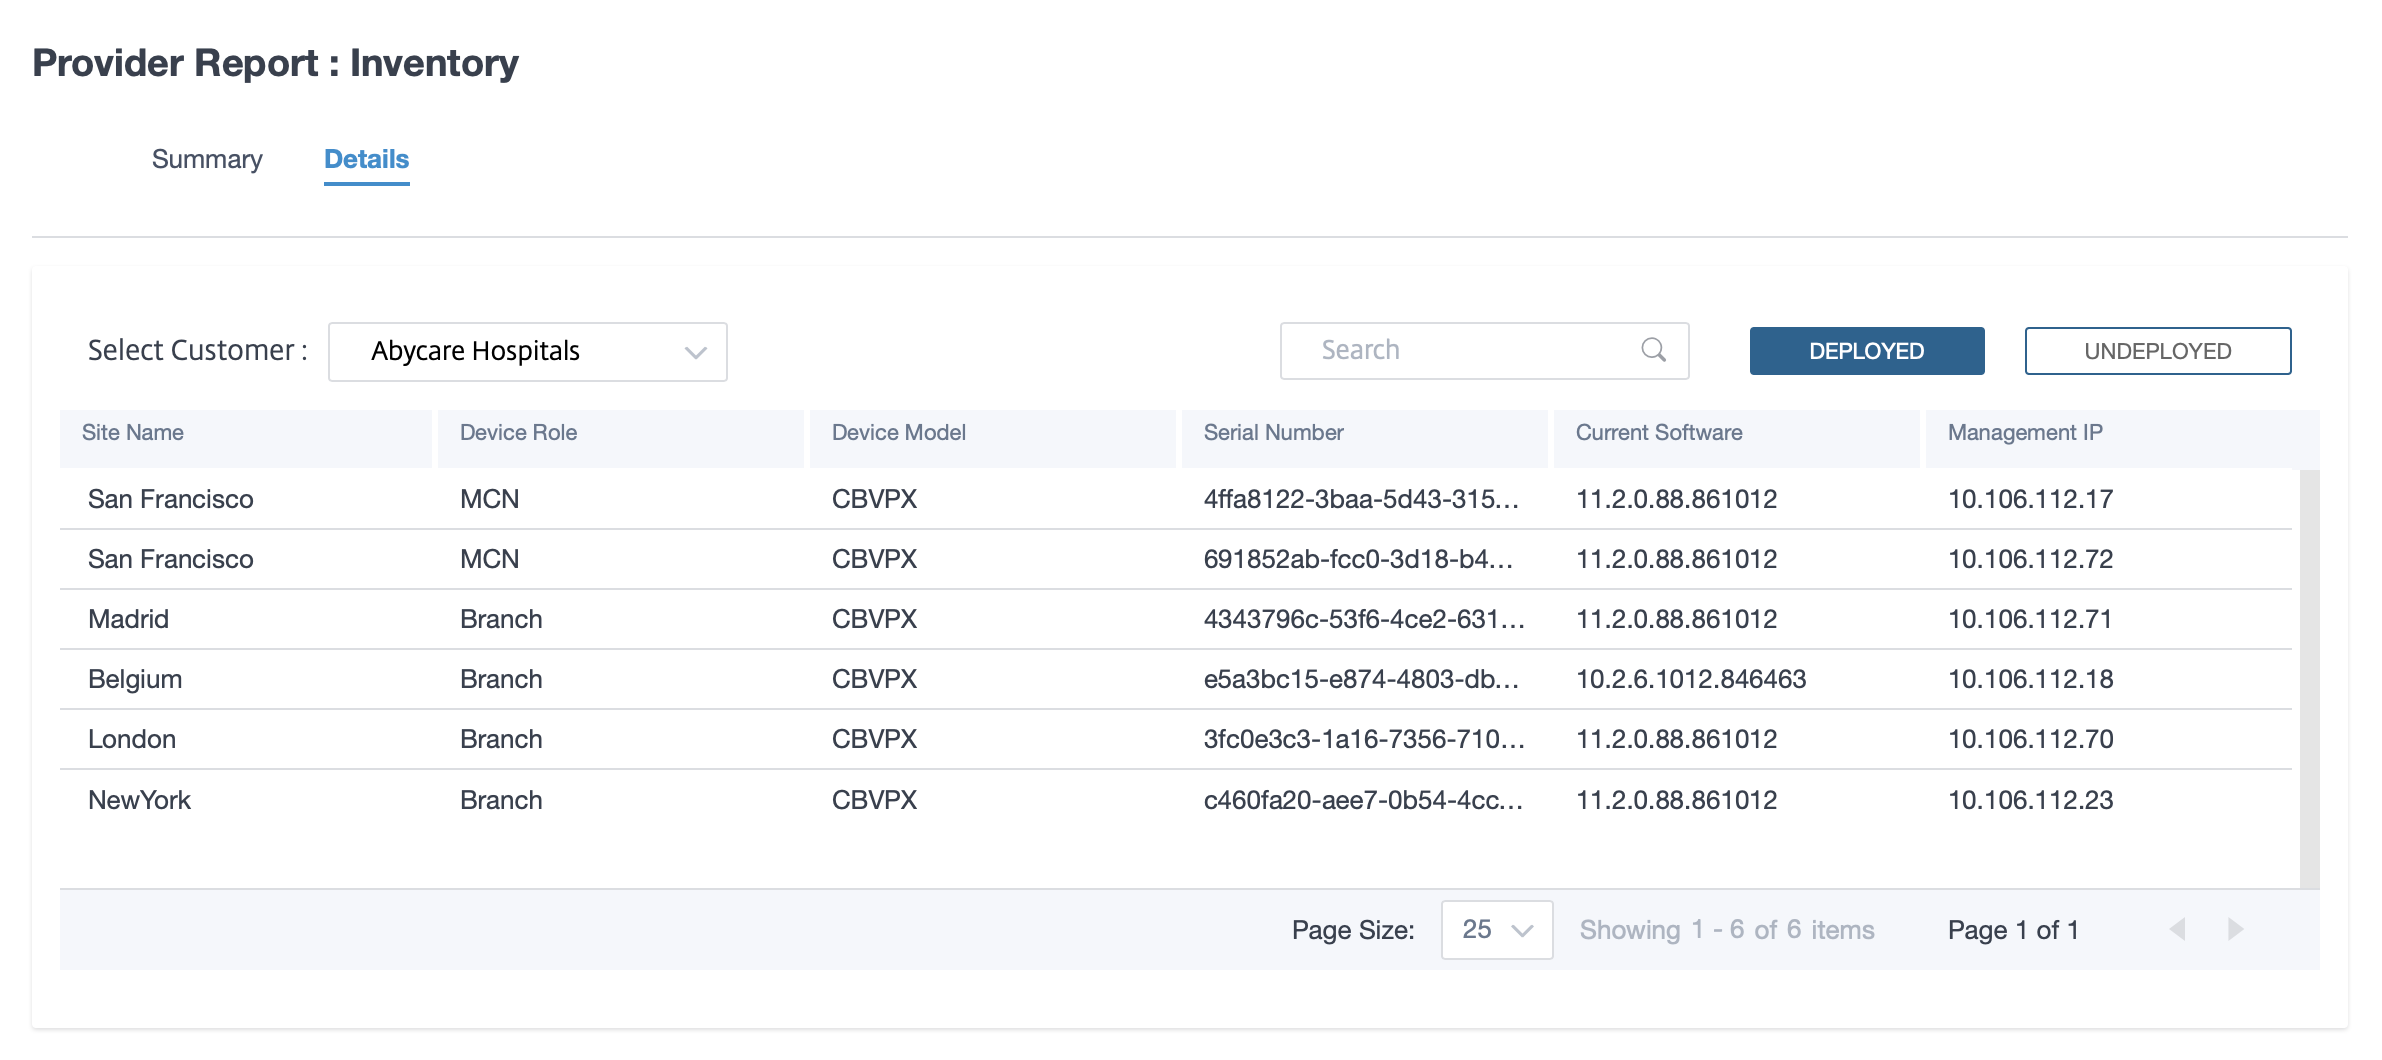
The provider can view the entire device inventory across all the customers. You can choose to view an inventory summary or a detailed view.
The inventory summary view provides a chart of the inventory spread, depicting the various appliance models and the number of each type of appliances used across customer networks.

Suitable filtering options can be used as needed for example: Look for all appliances belonging to a specific customer, or all appliances with a certain device model and so on
The inventory detailed view provides a list of all the appliances that are deployed and those appliances that are configured but not deployed yet. Choose a customer from the Select Customer drop-down list. You can view the site name, device role, device model, device serial number, current software, and device management IP address.
