Customer/Network dashboard
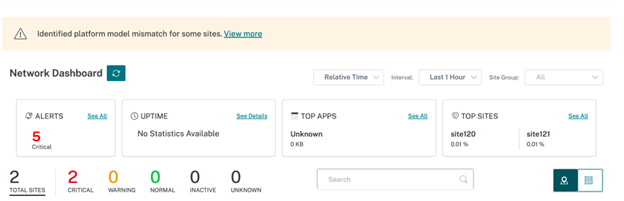
The Network Dashboard provides a bird’s eye view of an organization’s SD-WAN network in terms of health and usage across all the sites. The dashboard captures a summary of the network-wide alerts, uptime of the overlay and underlay paths, highlights usage trends, and provides a global view of the network.
The dashboard summarizes the following aspects of a network, with a provision to drill down for more details.
- Critical Alerts: Running count of the critical health alerts, if any, popping up on the network.
- Uptime: Side-by-side comparison of the average uptime offered by the SD-WAN virtual overlay network v/s the physical underlay network
- Usage Trends: Top Apps - based on traffic volume and Top Sites - based on capacity utilization.
- Network View: A visual representation of all the sites across a network, available in both Map View and List View.
The dashboard lists the total number sites in the network and also segregates the sites based on their connectivity status. Select the numbered links to view the sites based on the following status categories:
- Critical – Sites that have all the associated virtual paths down.
- Warning - Sites that have at least one virtual path down.
- Normal - All virtual paths and associated member paths of the site are up.
- Inactive - Sites that are in the undeployed and inactive state.
- Unknown - Status of the site is unknown.
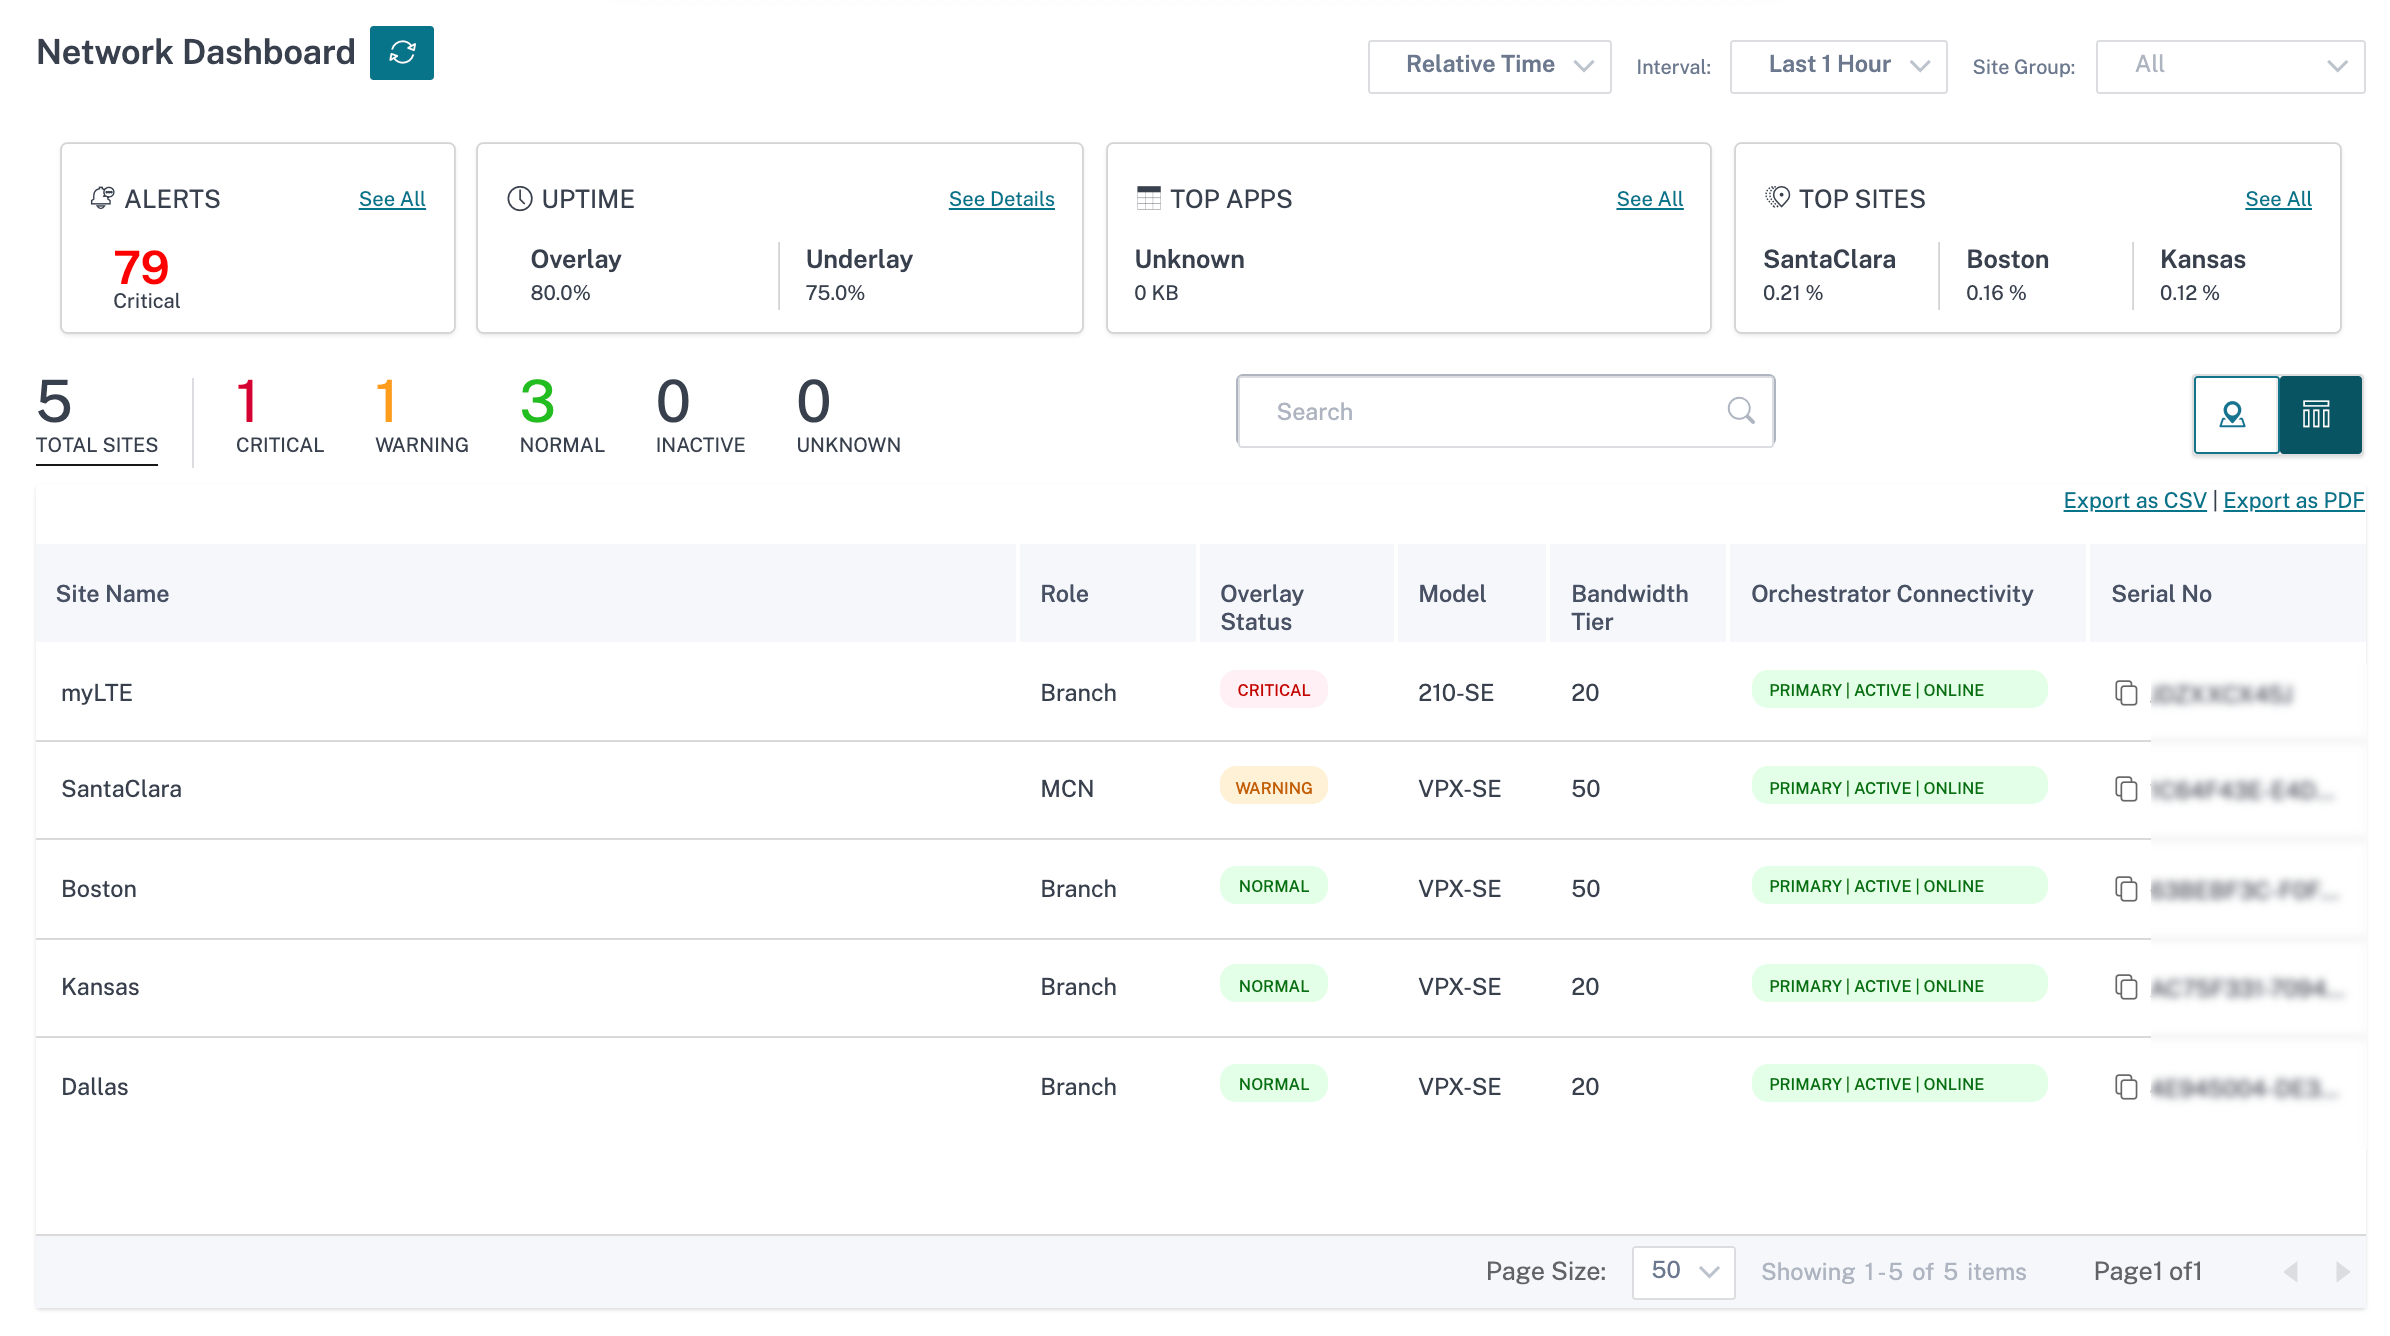
Clicking the status filters the sites based on their status and displays the details. You can also use the Search bar to view the details of a site based on the site name, role, overlay connectivity, model, bandwidth tier, and the serial number parameters.
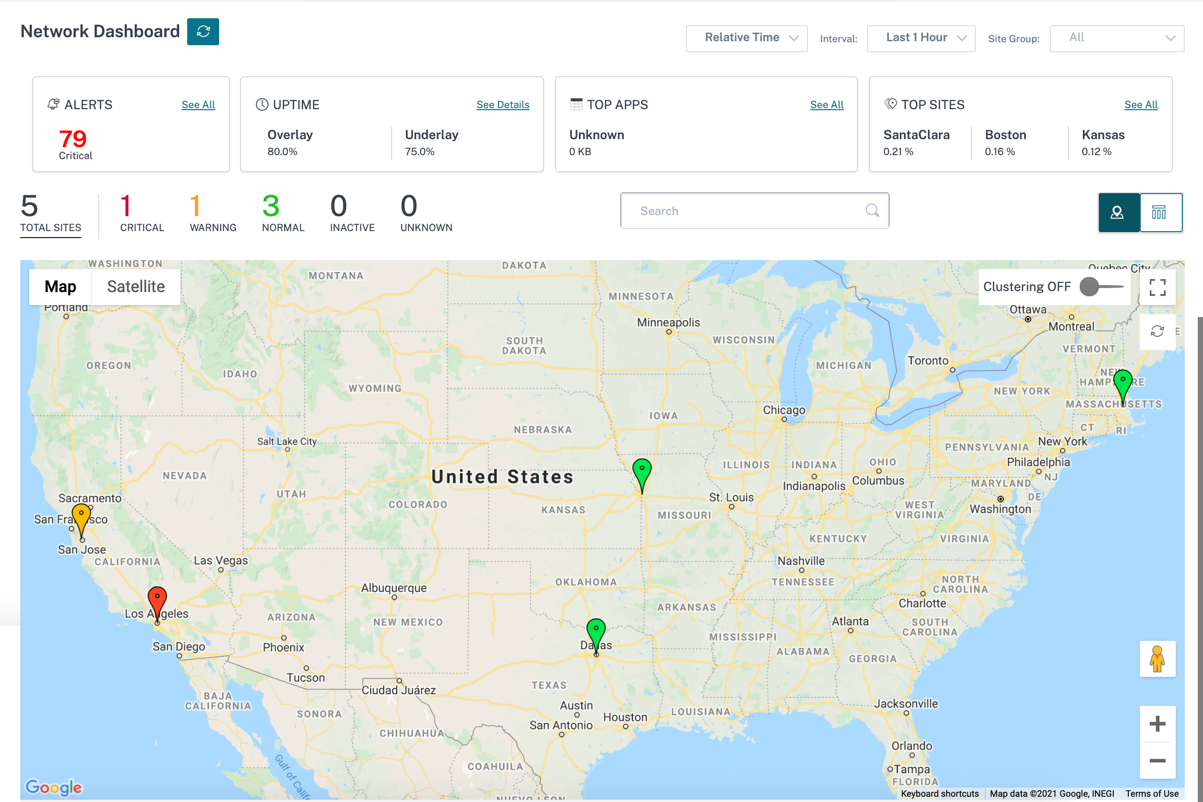
The map provides a real-time view of the global network with all the organization’s sites depicted on a world map, based on their locations. The color of each site reflects its current health.
Following are the color-coding criteria used for each site:
- Critical (Red): At least one overlay virtual path associated with a site is DOWN.
- Warning (Orange): At least one underlay member path is DOWN, but all the overlay virtual paths are UP.
- Normal (Green): All overlay virtual paths and the associated underlay member paths are UP.
- Inactive (Grey): Site is under-configuration and has not been deployed yet.
On hovering over any site, some of the key site-specific details such as the site role, device model, bandwidth tier is displayed. The virtual paths associated with a site show up with suitable color codes that reflect their health. The List View provides the same details for each site, summarized as entries in a table.
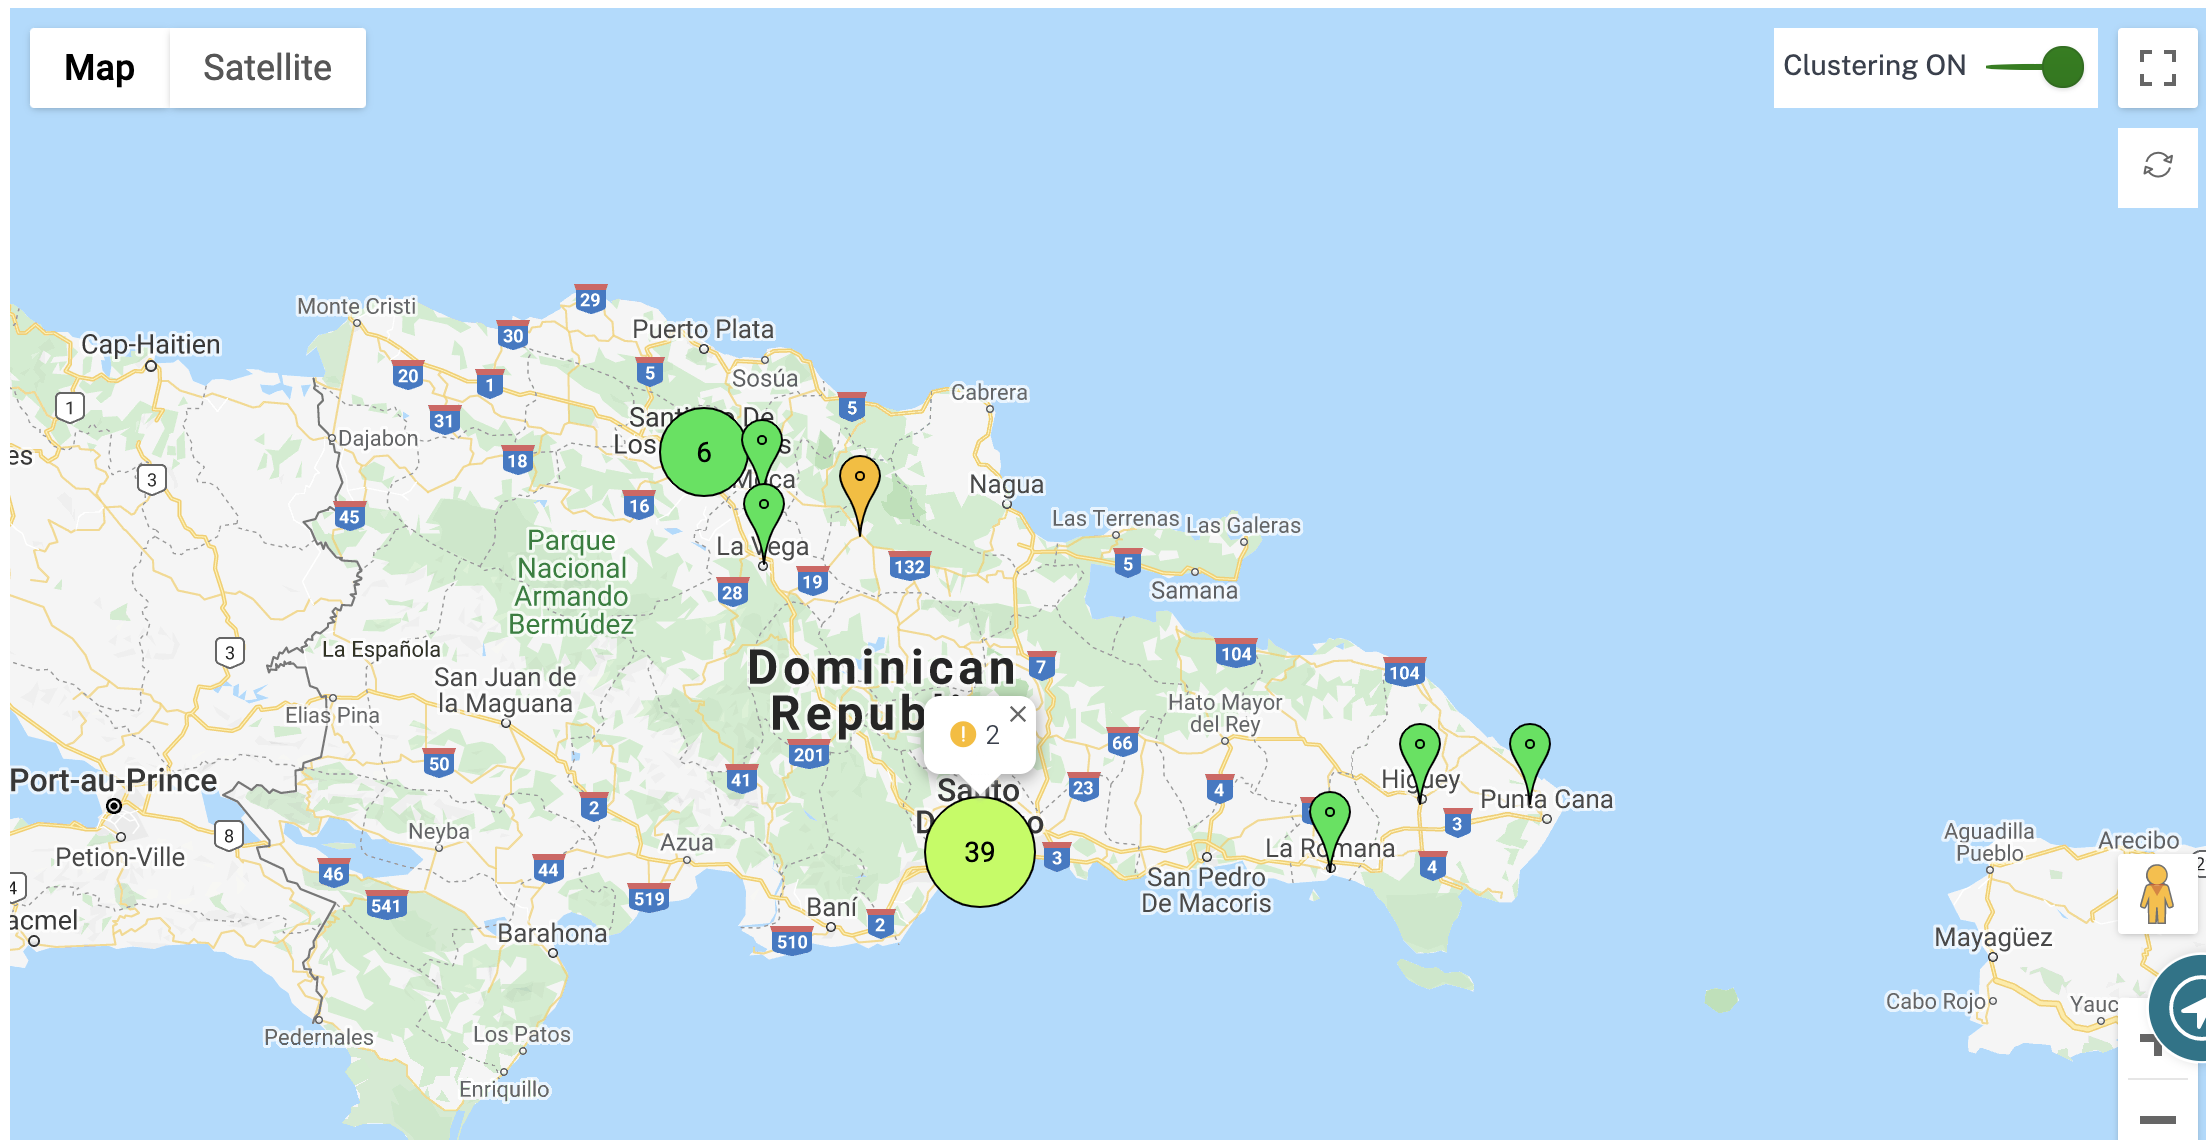
Clustering
The Clustering ON feature monitors the consistency, status, and health of various sites of a cluster or a combination of clusters. The Clustering ON service provides a real-time view of sites that help to monitor the failover and the current state of the site.
This Clustering ON feature is introduced to manage the high density of sites. It is not recommended to use the clustering off option when there are thousands of sites and it also brings down the performance.
The following table describes the five colors shade that is used for clusters to represent the health of sites:
| Color Legends | Description |
|---|---|
 |
All sites in the cluster are green. That means each site has all the virtual paths, and the associated member paths UP |
 |
All sites in the cluster are orange. That means each site has at least one member path DOWN, but all virtual paths UP |
 |
All sites in the cluster are red. That means each site has at least one virtual path DOWN |
 |
The cluster has a combination of green and orange sites |
 |
The cluster has a combination of red and non-red sites |
You can also verify the network aspect by hovering your mouse on any cluster. The critical or warning alerts are visible on top of the cluster as a pop-up.
If you click the cluster, it zooms into that cluster and shows other clusters. You can see a view bar with the number of clusters. The arrow option helps to bring you back one step. Click the Close (X) button to resume to the original page.
Alternatively, you can view the network summary in List View.
- Clicking any inactive “under-configuration” site that is yet to be deployed, would take you to the site configuration workflow.
- Clicking any active site, which has already been deployed, would take you to the Site Dashboard.
Note
Citrix SD-WAN overlay tunnels are called Virtual Paths. You would typically have one virtual path tunnel between each site and the Master Control Node (MCN), and extra site-site virtual paths as needed. Virtual paths are formed by bonding together the underlay WAN links / paths. So, each virtual path comprises multiple member paths.
This can be shown when a user hovers over the term virtual path or member path.
You can drag the Pegman onto the map to open the street view.

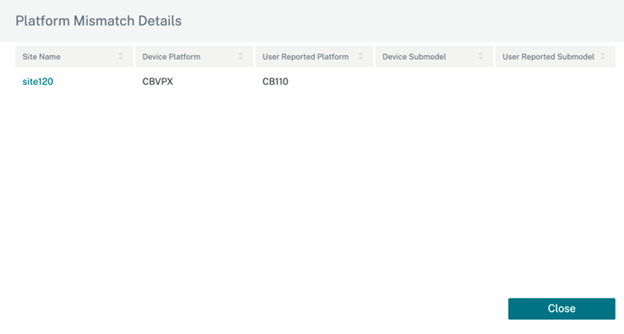
Record device mismatch
Citrix SD-WAN Orchestrator service reports a mismatch that is identified between the appliance reported platform model and the user reported platform model.
When the platform model and the sub-model provided by a user during site configuration does not match the platform model and sub-model provided by the appliance during the initial registration with Citrix SD-WAN Orchestrator service, a notification about the mismatch is displayed on the network dashboard. In such a scenario, ensure to configure the platform model reported by the appliance.
Click View more for a tabular representation of the platform model mismatch for each site.
The Platform Mismatch Details provides information such as site name, appliance reported platform model and sub-model, and user reported platform model and sub-model.