HDX™ QoE
Network parameters such as latency, jitter, and packet drop affect the user experience of HDX users. Quality of Experience (QoE) helps the users to understand and check their ICA® quality of experience. QoE is a calculated index, which indicates the ICA traffic performance. The users can tune the rules and policy to improve the QoE.
The QoE is a numeric value between 0–100, the higher the value the better the user experience.
The parameters used to calculate QoE are measured between the two Citrix SD-WAN™ appliances located at the client and server side and not measured between the client or the server appliances themselves. Latency, jitter, and packet drop are measured at the flow level and it can be different from the statistics at the link level. The end host (client or server) application might never know that there is a packet loss on the WAN. If the retransmit succeeds, the flow level packet loss rate is lower than the link level loss. However, as a result, it might increase latency and jitter a bit.
You can view a graphical representation of the overall quality of HDX applications in the HDX dashboard on Citrix SD-WAN Orchestrator™ service. The HDX applications are classified into the following three quality categories:
| Quality | QoE Range |
|---|---|
| Good | 71-100 |
| Fair | 51-70 |
| Poor | 0-50 |
Depending on the selected UI page, a list of the bottom (least QoE) five sites, five users, five sessions, or all of them are displayed in the HDX dashboard.
A graphical representation of the QoE for different time intervals allows you to monitor the performance of HDX applications at each site.
Configure HDX QoE
To configure HDX QoE:
-
At the network level, navigate to Configuration > App Settings & Groups > App Quality Config and click + QoE Configuration. Add the following applications using the QoE profile that you want to use for the calculation of HDX behavior:
- ICA Real-time (ica_priority_0)
- ICA Interactive (ica_priority_1)
- ICA Bulk-Transfer (ica_priority_2)
- ICA Background (ica_priority_3)
- Independent Computing Architecture (Citrix®)(ICA)
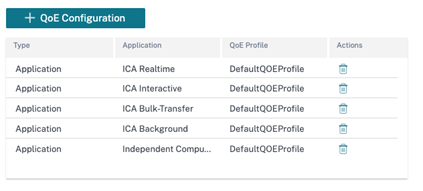
These configurations provide the parameters to measure HDX performance used in HDX report through the profile. Configuration of ICA Real-time, ICA Interactive, ICA Bulk-Transfer, ICA Background are required for HDX Multi-Stream (MSI) connections, Independent Computing Architecture (Citrix) is required for Single Stream (SSI) connections.
-
Navigate to Configuration > QoS > QoS Profiles and provide a name for the QoS profile. Standard-HDX-Multistream is the default QoS Profile selected and the HDX Reporting option is selected by default. Clear HDX Reporting if HDX reporting is not required.
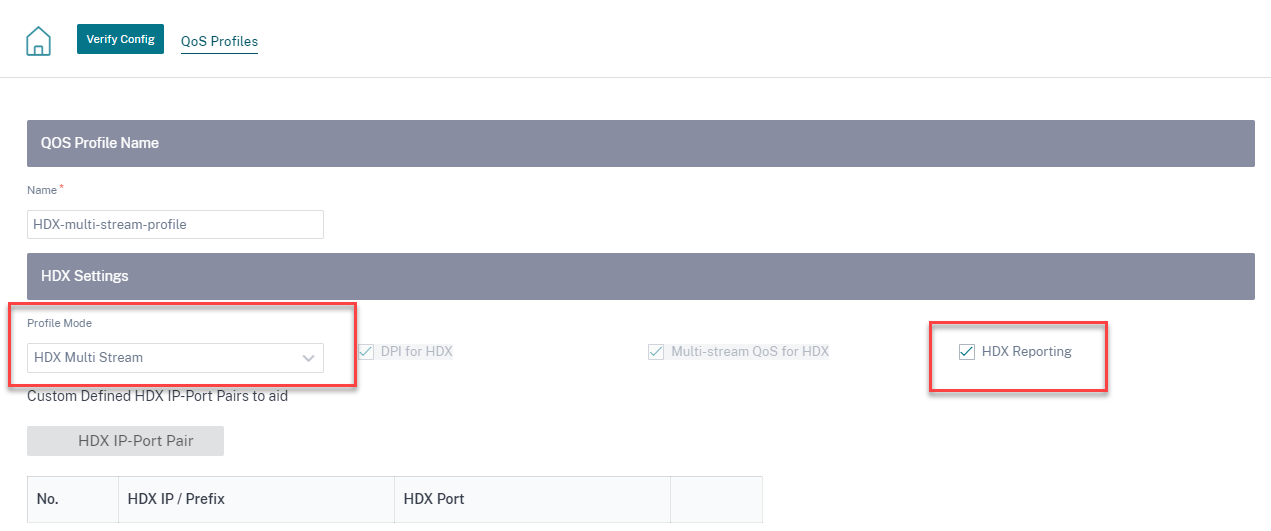
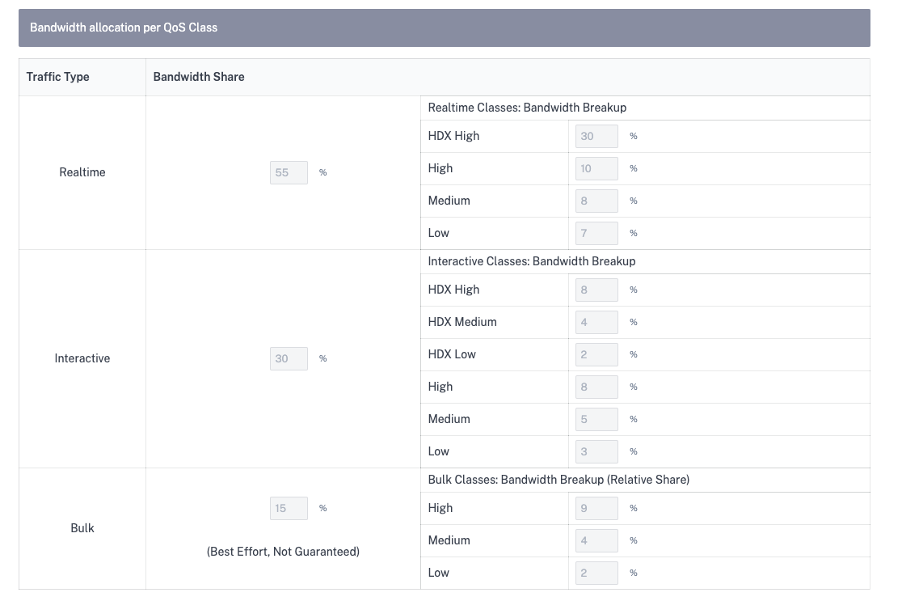
In each QoS profile, there is a pre-defined bandwidth percentage for each class. They are configurable to adjust the bandwidth assigned to the classes that the HDX traffic is using.
-
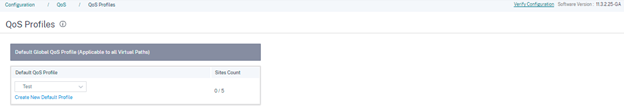
Ensure that the new QoS Profile is actively used by checking the Site Count indicator.
-
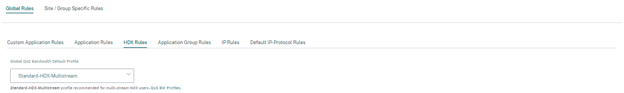
Navigate to Configuration > QoS > QoS Policies > HDX Rules and set the new QoS Profile with the enabled HDX reporting as the Global QoS Bandwidth Default Profile.
-
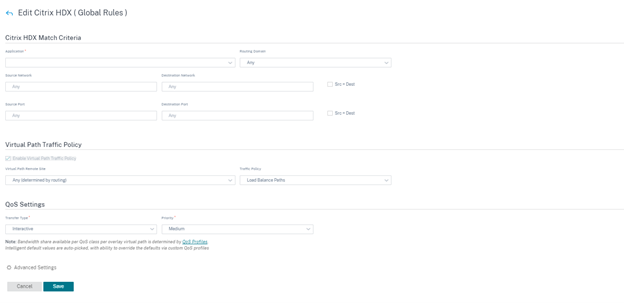
Add HDX rules. These configurations assign proper QoS settings to HDX connections. To check the rule details or edit the rules, navigate to the Actions column, click the horizontal ellipsis (…), and select the Edit option. To change the setting of any default rule, click Clone and make the required modification.
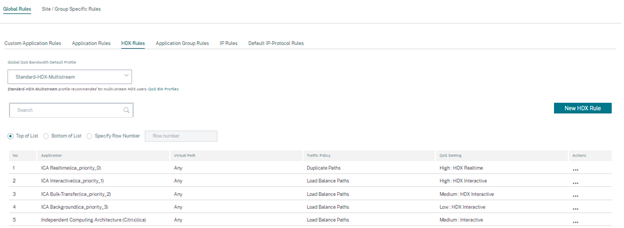
These configurations can be modified:
- QoS class: Real-time, Interactive, Bulk
- Traffic policy:
- Duplicate Paths: The traffic is duplicated across multiple paths to increase reliability.
- Persistent Path: The traffic of a flow remains on the same path, unless the path becomes unavailable.
- Load Balance Paths: The traffic of a flow is balanced across multiple paths.
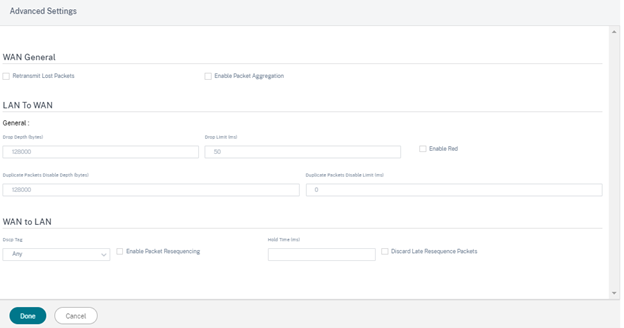
- Advanced Settings: Set policies retransmission, RED, and late packets.
Note
For more information about Classes, see Classes.
HDX dashboard and reports
Citrix SD-WAN Orchestrator service provides the HDX dashboard for up-to-date, detailed measurements of Citrix Virtual Applications and Desktops user experience across the network, for each site, user, and session.
There are two types of HDX sessions – single-stream and multi-stream. A single-stream session has only one connection in the session, whereas a multi-stream session has four. Multi-stream sessions allow for more advanced QoS. The connection in a single-stream HDX session defaults to interactive class, while the top priority connection of a multi-stream HDX session defaults to real-time class and the other three to interactive class. This is configurable.
The Quality of Experience (QoE) score is a numeric value between 0–100. The higher the value the better the user experience. Real-time class traffic QoE is calculated based on jitter, latency, and loss rate. The interactive class QoE is calculated based on burst rate and loss rate. The QoE of a session is the average across all the connections in the session. The QoE of a user is the average of all the sessions launched by that user. The QoE of a site is the average of all the sessions on that site.
All the statistics are metrics:
- For HDX traffic on that site
- Experienced by that user
- Of all the connections in that session
They do not include the metrics of other types of traffic. The metrics are either the average across the selected period, or the total across the selected period.
Note
HDX reporting requires minimum software versions:
- Citrix Virtual Apps and Desktops™ 7–1912 LTSR (or Current Release)
- Citrix Workspace app for Windows 19.12 LTSR (or Current Release)
- SD-WAN 11.2.0 (or current version)
Citrix always recommends using the latest software version to get the latest bug fixes and enhancements. For instance, SD-WAN requires release 11.2.3 or 11.3.1 to have support for new EDT commands introduce in later versions of Citrix Virtual Apps and Desktops LTSR.
Mac clients and Linux clients do not have full support for multi-stream ICA and HDX reporting through Citrix SD-WAN. For instance, Linux clients support multi-stream, however lack detail such as round-trip time and delay. The CWA feature matrix provides insight into which Operating Systems support the Multiport ICA and HDX Insight with NSAP VC features.
Users need to access HDX outside of Citrix Gateway encryption, either through direct access to StoreFront or usage of Beacon Points or the Network Location Service.
Sites
This HDX report provides detailed HDX data per site. To view the site statistics, navigate to Report > HDX > Sites.
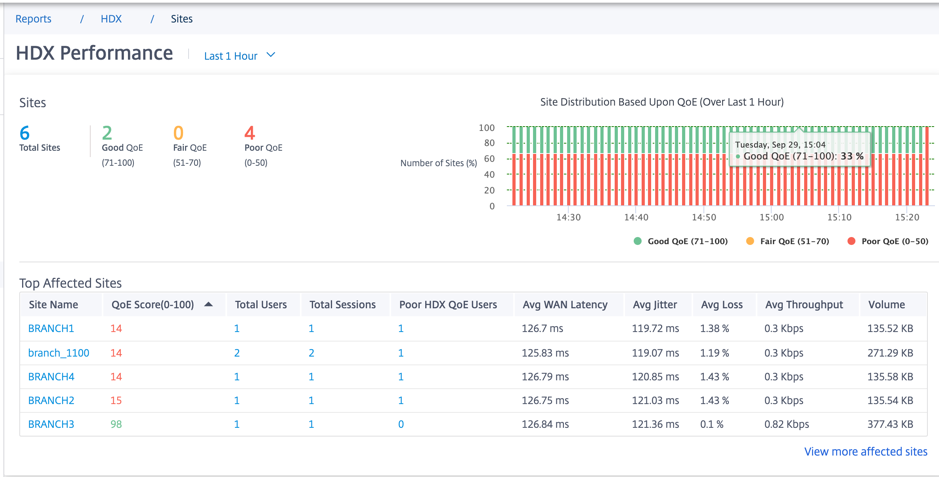
The dashboard reports on site with HDX traffic running during the selected time interval (for example, last 5 minutes, last 30 minutes, last 1 day, last 1 month, and so on). Site performance is categorized as good (71-100), fair (51-70), or poor (0-50) based on the QoE of the site’s HDX traffic. The QoE value in the summary section and the Top Affected Sites table is the average value across the selected time. The time series graphic report shows detailed history with time lapse. Each bar shows the percentage of good, fair, and poor QoE sites at that time.
You can also view the number of sites in percentage, having Good, Fair, and Poor QoE at that time under the Site Distribution Based Upon QoE graph. Hover your mouse to the color bar to see the percentage number of sites in a good/fair/poor state.
NOTE
The statistics are collected in one direction, from the remote side into the current site. For example, for a session between site-A and site-B, the report of site-A is collected on traffic coming from site-B into site-A, whereas the report of site-B is collected on traffic coming from site-A into site-B. Therefore, the statistics of the same session on site-A and site-B can be different.
The Top Affected Sites table reflects only the top 5 most affected sites. By default, it shows the 5 sites with the lowest QoE scores. But each column is sortable, ascending, or descending, and used as a query criterion. For example, clicking the Avg Jitter column title toggles showing either the 5 sites with the lowest average jitter or the highest average jitter. Same for other columns. To see the details of all the sites with HDX traffic during the selected time period, click View more affected sites.
The following are the details of each site:
- Site Name: The site name.
- QoE Score (0-100): The average QoE score of this site.
- Total Users: The total number of active HDX users seen on the site during the selected period.
- Total Sessions: The total number of HDX sessions seen on the site during the selected period, including both single-stream and multi-stream sessions.
- Poor HDX QoE Users: The number of HDX users suffering from poor QoE (below 50).
- Avg WAN Latency: Average latency over the WAN, from the remote site to this site.
- Avg Jitter: The average jitter value for the selected duration.
- Avg Loss: The average packet loss percentage value for the selected duration.
- Avg Throughput: The average data throughput value for the selected duration.
- Volume: The total traffic volume seen on this site. The Citrix SD-WAN Orchestrator service GUI might adjust and change the unit based on the number value.
Clicking any column title shows the report sorted on that column. Click View more affected sites to see the reports of all sites. Clicking any single row shows the detailed report for that site.
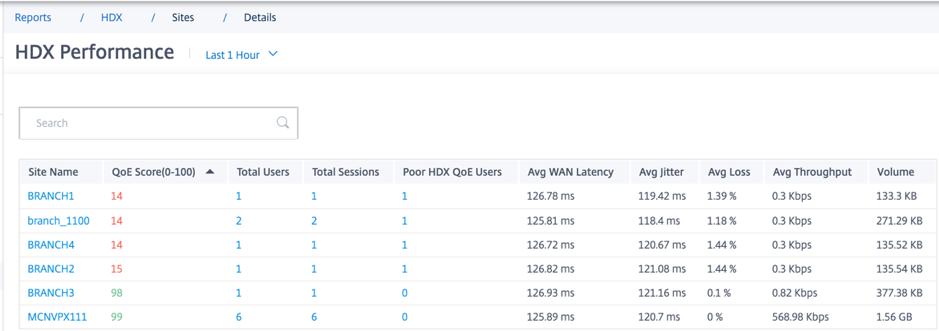
The table in the following screenshot is an example report showing all the sites. It has the same columns as the Top Affected Sites table. You can search for any site using the search bar.
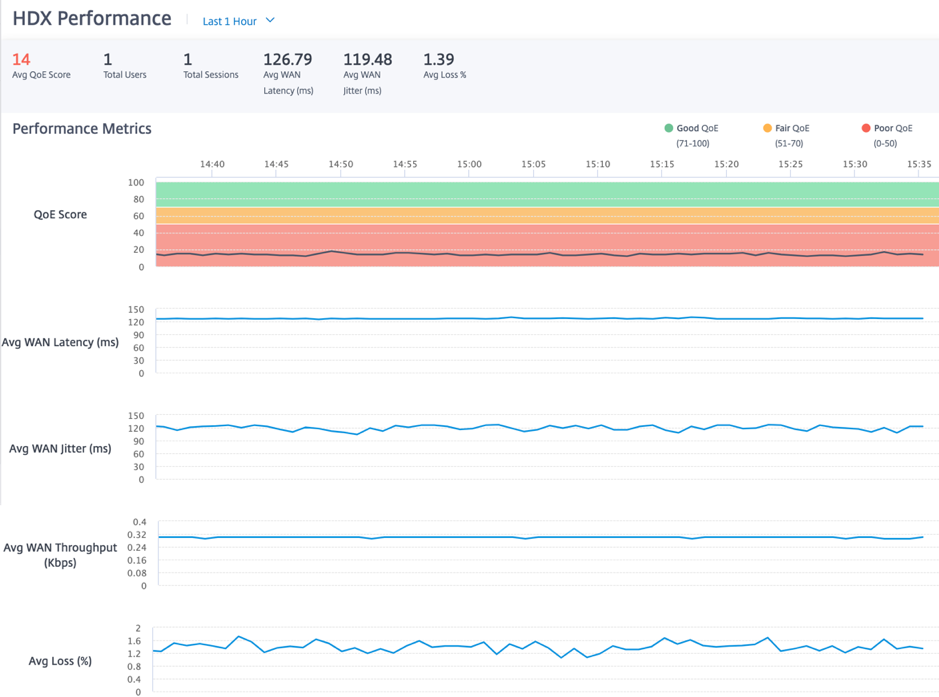
Click the individual site row to view a graphical representation of the performance metrics. Hovering the mouse over the graphic provides more details.
Users
To view the HDX users report, navigate to Reports > HDX > Users.
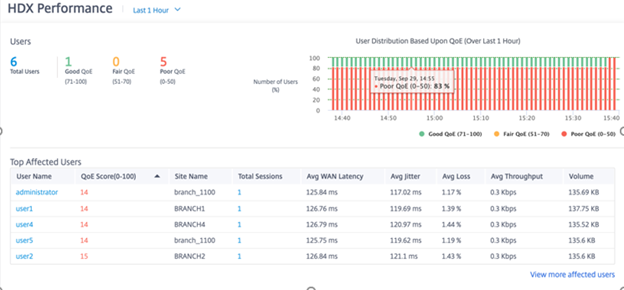
The user report shows the performance experienced by each user during the selected period (for example, last 5 minutes, last 30 minutes, last 1 day, last 1 month, and so on). If the user has been on multiple sites during the selected period, the last site the user logged in from is shown in the report. User experience is categorized as good (71-100), fair (51-70), or poor (0-50) based on the QoE score of their HDX traffic. The QoE values in the summary section and the Top Affected Users table are the average values across the selected time period. The time series graphic report shows detailed history with time lapse. Each bar shows the percentage of users with good, fair, and poor QoE at that time.
You can also view the number of users in percentage, having Good, Fair, and Poor QoE at that time under the User Distribution Based Upon QoE graph. Hover your mouse to the color bar to see the percentage number of users in good/fair/poor state.
Personally Identifiable Information
Currently, the HDX QoE reports have the following two Personally Identifiable Information (PII) fields:
- User Name: Displays the user name.
- IP Address: Displays the client IP address.
NOTE
When the user name is not available, the IP address is displayed in the User Name field.
The HDX user reports are based on statistics from the client side SD-WAN, not the Virtual Delivery Agent (VDA) side SD-WAN. This reflects the end user’s HDX experience.
The Top Affected Users table reflects only the top 5 most affected users. By default, it shows the top 5 users with the lowest QoE. But each column is sortable, ascending, or descending, and used as a query criterion. For example, clicking the Avg Jitter column title toggles displaying either the 5 users with the lowest average jitter or the highest average jitter. To see the details of all the users that have HDX traffic during the selected time period, click View more affected users.
The following are the details of each user:
- User Name: The user name.
- QoE Score (0-100): The average QoE score of this user.
- Site Name: The site name that the user logged in from.
- Total Sessions: The total number of active HDX sessions from that user, including both single-stream and multi-stream sessions.
- Avg WAN Latency: Average latency over the WAN, experienced at the client side.
- Avg Jitter: The average jitter value for the selected duration.
- Avg Loss: The average packet loss percentage value for the selected duration.
- Avg Throughput: The average data throughput value for the selected duration.
- Volume: The total traffic volume used by this user. The Citrix SD-WAN Orchestrator service GUI might adjust and change the unit based on the number value.
Clicking any column title shows the report sorted on that column. Click View more affected users to see the reports of all users. Clicking any single row shows the detailed report for that user.
The following screenshot is an example report table showing all the users. It has the same columns as the Top Affected Users table. You can search for any site using the search bar.
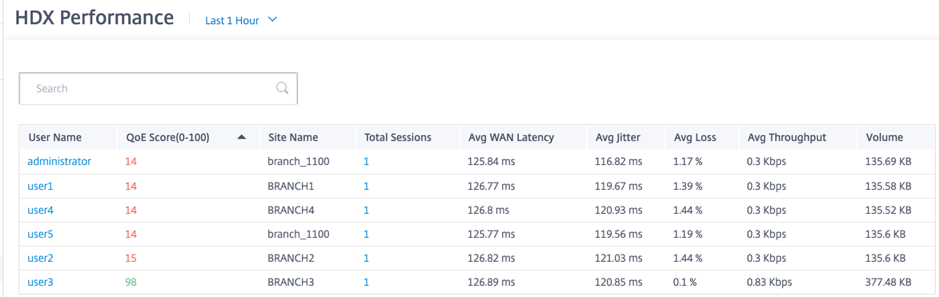
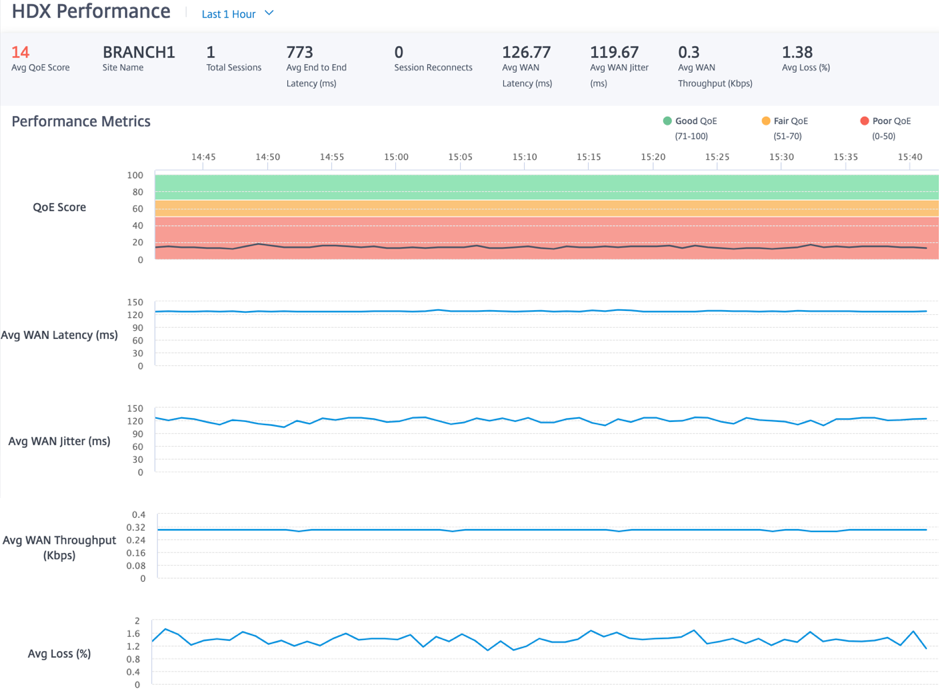
Click an individual user row to see a graphical representation of that user’s performance metrics.
Sessions
The Session report provides details at the session level. To view the session report, navigate to Reports > HDX > Sessions.
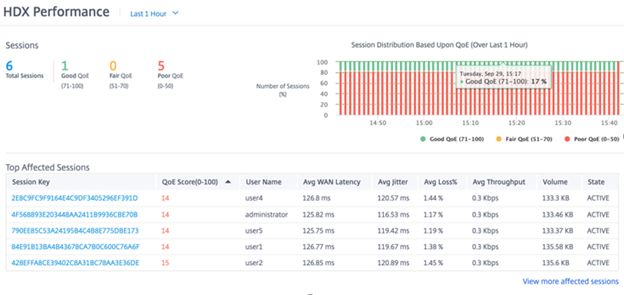
The dashboard shows the reports of HDX sessions running during the selected period (for example, last 5 minutes, last 30 minutes, last 1 day, last 1 month, and so on). Sessions are categorized as good (71-100), fair (51-70), or poor (0-50) based on the QoE of that session. The QoE value in the summary section and the Top Affected table is the average value across the selected period. The time series graphic report shows detailed history with time lapse. Each bar shows the percentage of good, fair, and poor QoE sessions at that time.
You can also view the number of sessions in percentage, having Good, Fair, and Poor QoE at that time under the Session Distribution Based Upon QoE graph. Hover your mouse to the color bar to see the percentage number of sessions in good/fair/poor state.
Note
The HDX session reports are based on statistics from the client side SD-WAN, not the VDA side SD-WAN. This reflects the end user’s HDX experience.
The Top Affected Sessions table reflects only the top 5 most affected sessions. By default, it shows the top 5 sessions with the lowest QoE. But each column is sortable, ascending, or descending, and used as a query criterion. For example, clicking the Avg Jitter column title toggles showing either the 5 sessions with the lowest average jitter or the highest average jitter. To see the details of all the HDX sessions during the selected time period, click View more affected sessions.
The following are the Detail of the top each session:
- Session Key: The unique identity for an HDX session.
- QoE Score (0-100): The average QoE of this session.
- User Name: The user name.
- Avg WAN Latency: The average WAN latency of the session for the selected duration, measured at the client side.
- Avg Jitter: The average jitter value of the session for the selected duration.
- Avg Loss %: The average loss percentage value of the session for the selected duration.
- Avg Throughput: The average throughput value of the session for the selected duration.
- Volume: The total traffic volume used by this session. The Citrix SD-WAN Orchestrator service GUI might adjust and change the unit based on the number value.
Clicking any column title, shows the report sorted on that column. Clicking View more affected sessions shows the reports of all the sessions. Clicking any single row shows the detailed report on that session.
The following screenshot is an example report table showing all the sessions. It has the same columns as the Top Affected Sessions table.
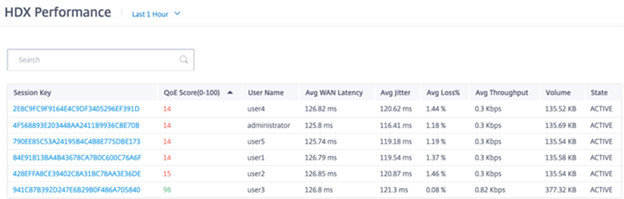
Click the individual session key to view a graphical representation of the performance metrics along with the details about all the variables affecting QoE.
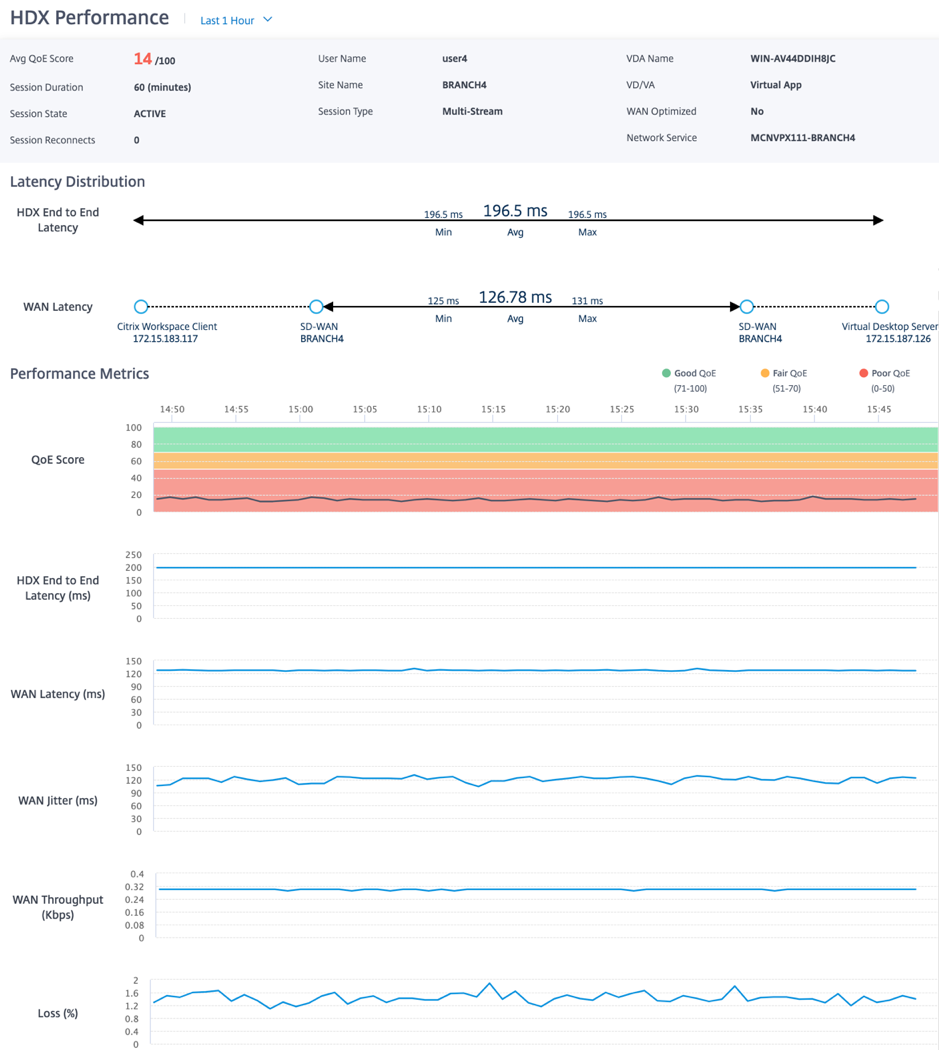
- Avg QoE Score: The average QoE over the selected period.
- User Name: The user who launched this session.
- VDA Name: Name of the VDA from which published Desktop/Application are delivered.
- Session Duration: The active time of this session in the selected period.
- Site Name: The client site of the user when the session was launched.
- VD/VA: Whether this session is a Virtual Desktop or a Virtual Application session.
- Session State: The state of the session at the end of the selected period.
- Session Type: Whether the session is Multi-stream session or single-stream session the last time the session is launched.
- WAN Optimized: Whether this session was WAN optimized. If the SD-WAN is PE platform, WAN Optimization is enabled for HDX, and this session is optimized, then this field shows true.
- Session Reconnects: If the session has been disconnected and reconnects automatically due to network issue, this field is the count of such occurrence.
- Network Service: This is the service name through which this session is delivered.
- HDX End to End Latency: Half of the value of round trip time between the VDA and the client.
- WAN Latency: The latency from the VDA side SD-WAN to the client side SD-WAN.