This content has been machine translated dynamically.
Dieser Inhalt ist eine maschinelle Übersetzung, die dynamisch erstellt wurde. (Haftungsausschluss)
Cet article a été traduit automatiquement de manière dynamique. (Clause de non responsabilité)
Este artículo lo ha traducido una máquina de forma dinámica. (Aviso legal)
此内容已经过机器动态翻译。 放弃
このコンテンツは動的に機械翻訳されています。免責事項
이 콘텐츠는 동적으로 기계 번역되었습니다. 책임 부인
Este texto foi traduzido automaticamente. (Aviso legal)
Questo contenuto è stato tradotto dinamicamente con traduzione automatica.(Esclusione di responsabilità))
This article has been machine translated.
Dieser Artikel wurde maschinell übersetzt. (Haftungsausschluss)
Ce article a été traduit automatiquement. (Clause de non responsabilité)
Este artículo ha sido traducido automáticamente. (Aviso legal)
この記事は機械翻訳されています.免責事項
이 기사는 기계 번역되었습니다.책임 부인
Este artigo foi traduzido automaticamente.(Aviso legal)
这篇文章已经过机器翻译.放弃
Questo articolo è stato tradotto automaticamente.(Esclusione di responsabilità))
Translation failed!
Provider reports
The Provider Reports provide visibility into alerts, usage trends, and inventory aggregated across all the customers managed by a Provider.
In the Citrix SD-WAN Orchestrator service provider level UI, navigate to Reports.
Alerts
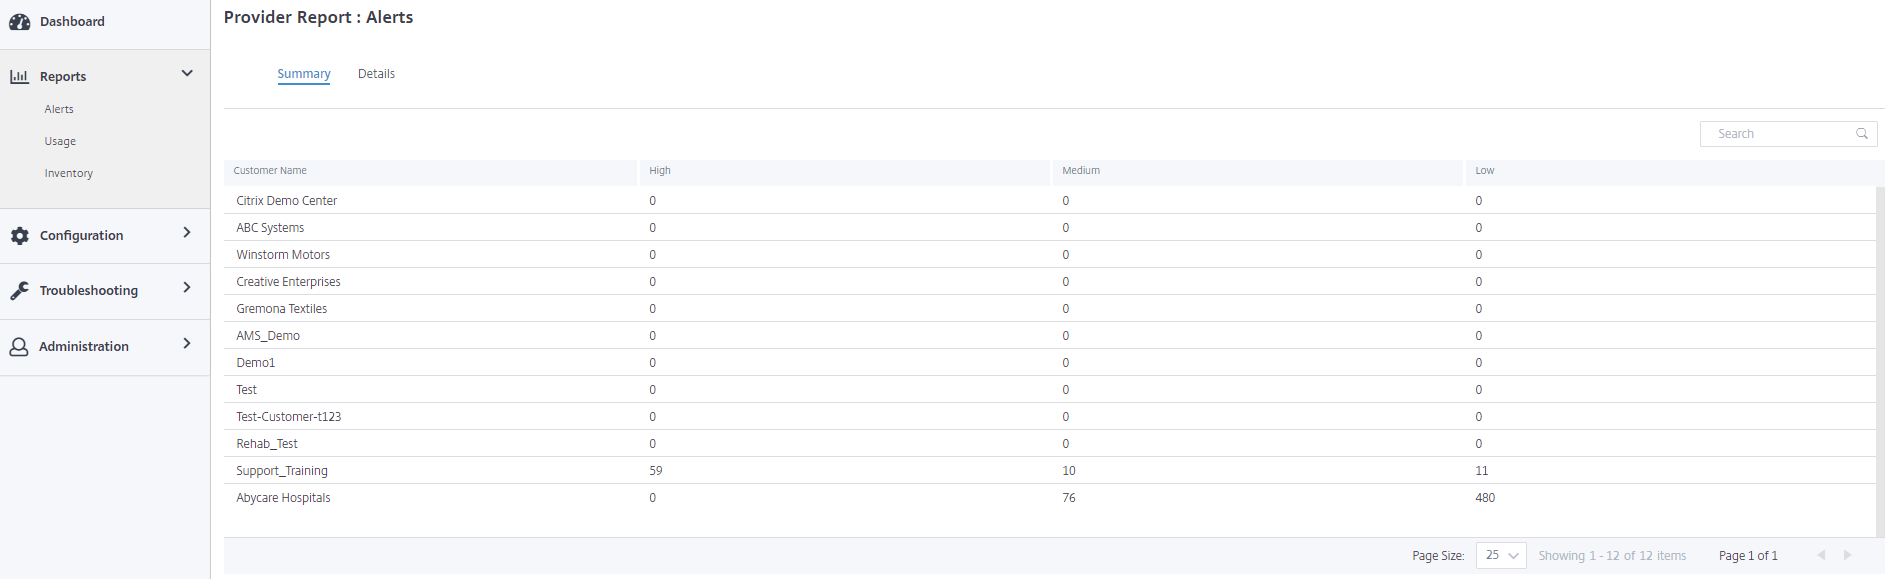
The provider can review all the events and alerts generated across all the customer networks.
The Summary view displays the number of high, medium, and low alerts for each customer.
You can also view the severity, site at which the alert originated, alert message, time, and other information under Details.
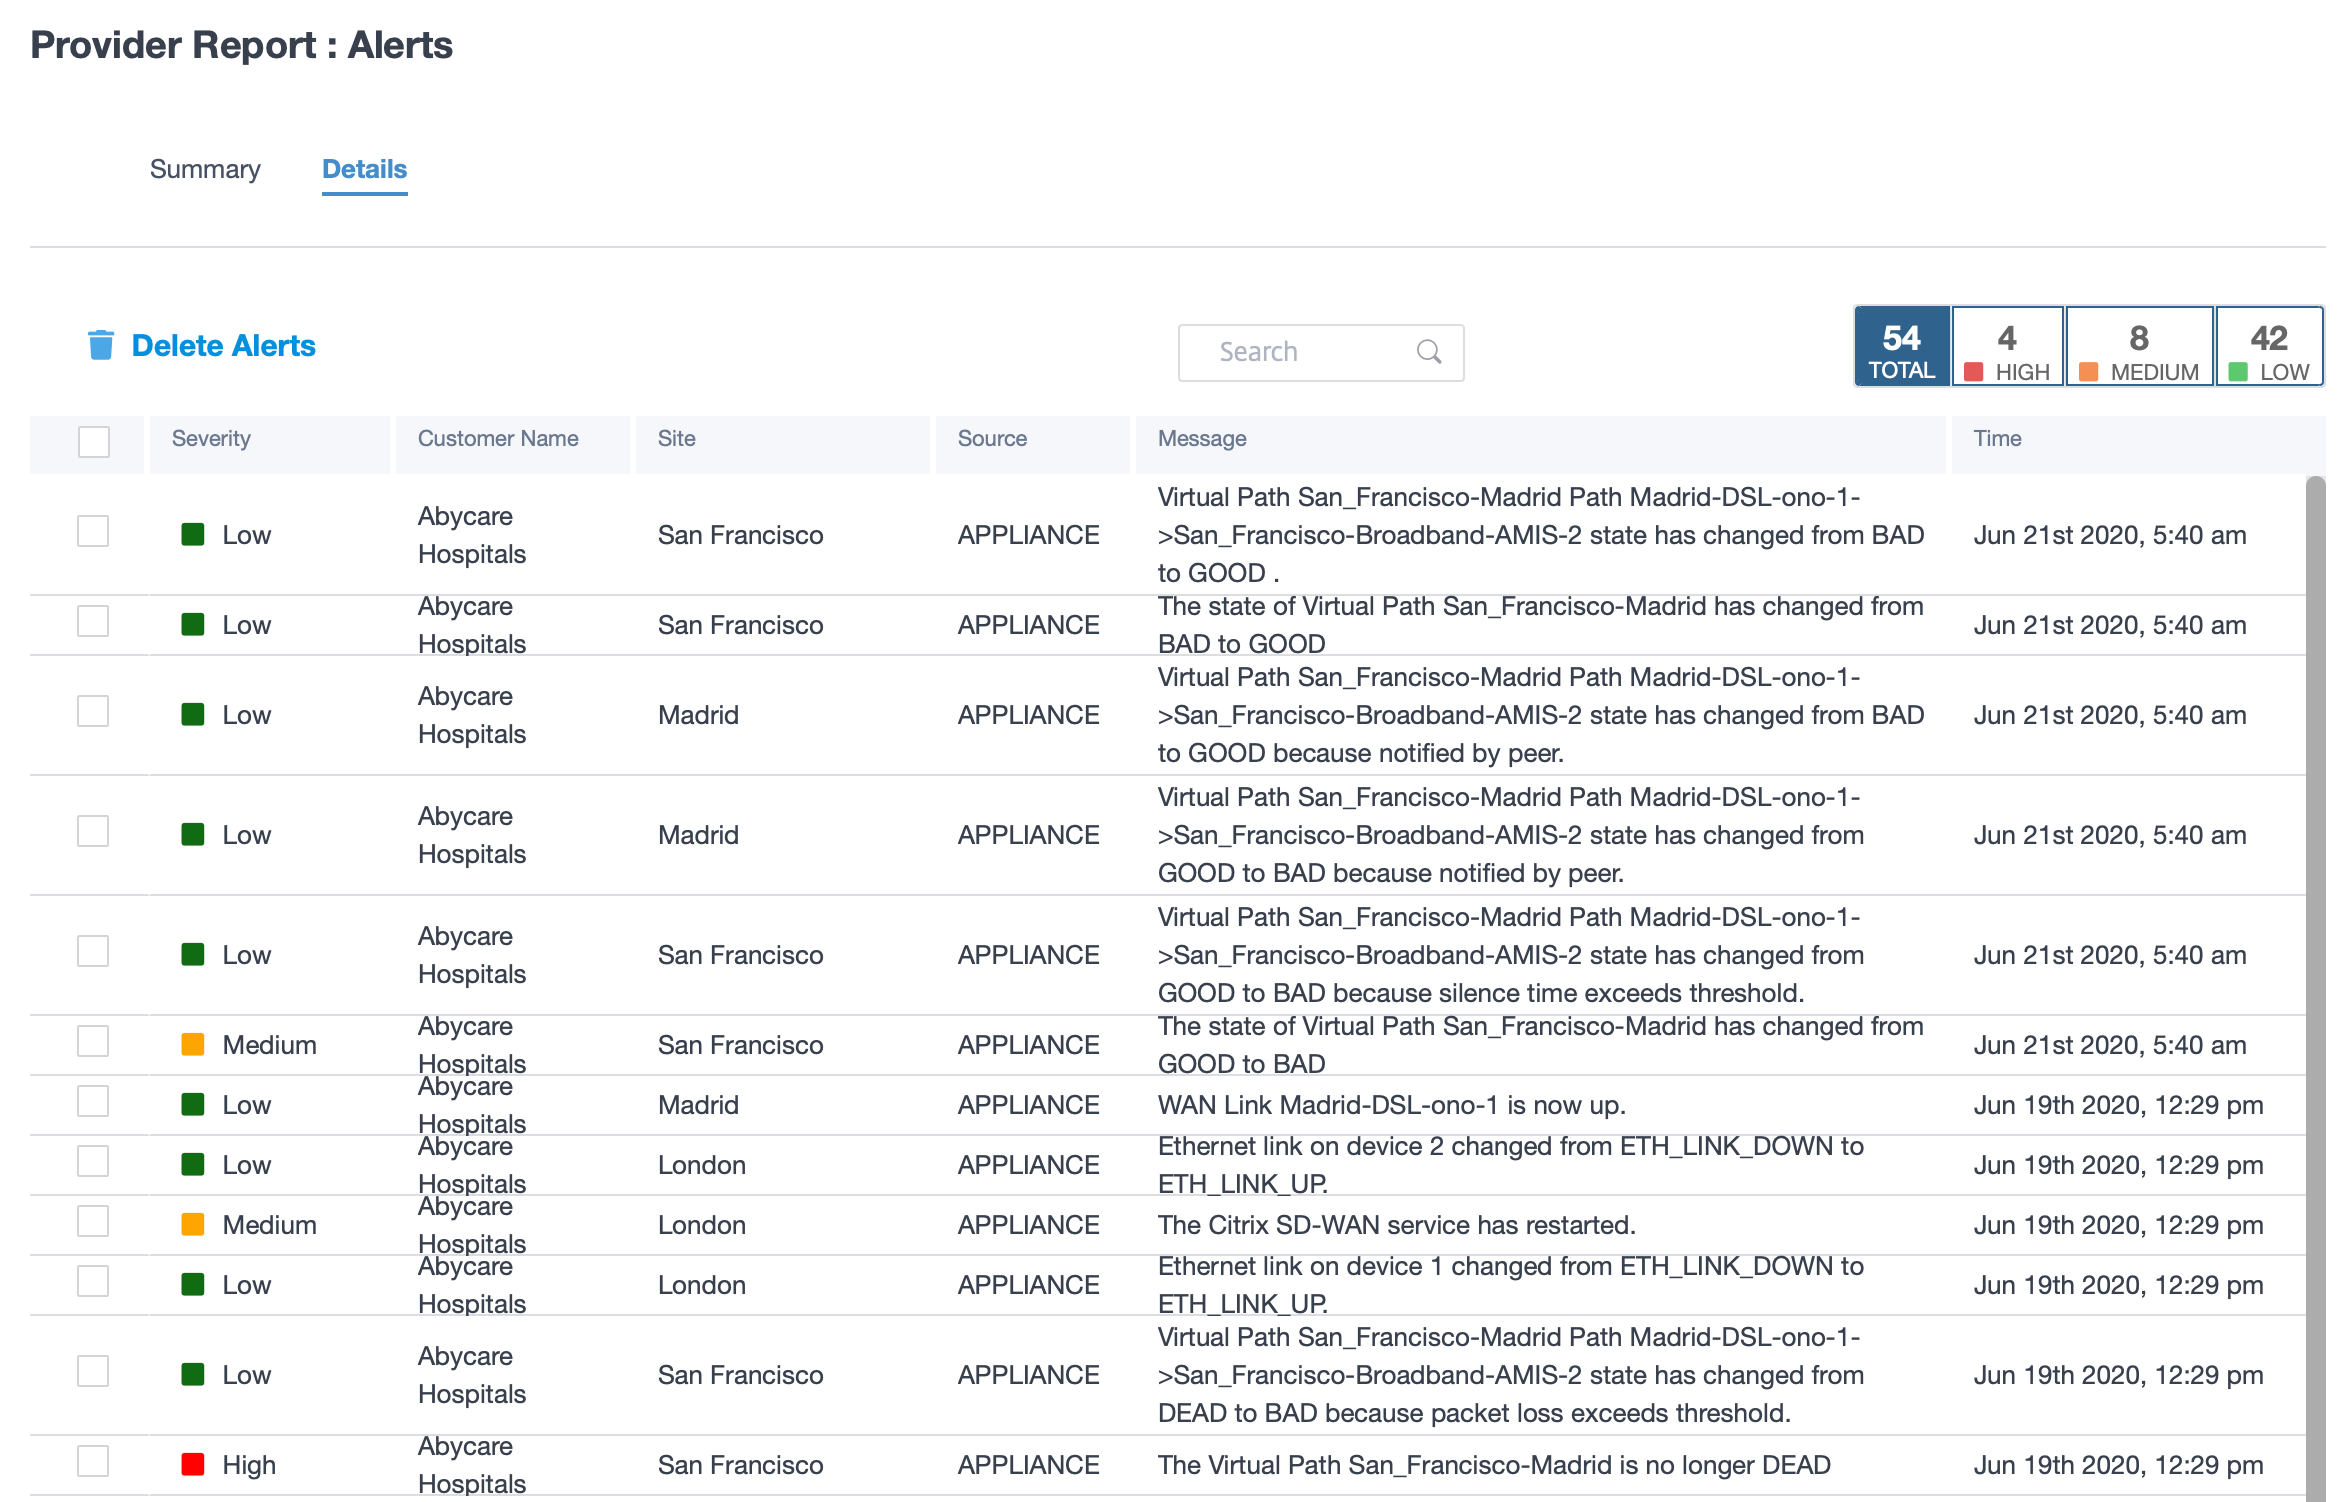
Suitable filtering options can be used as needed for example: Look for the high severity alerts across all the customers, or the alerts for a given customer and so on.
You can also select and delete alerts.
Usage
The provider can review cross-customer usage trends such as Top Applications, Top Application Categories, Application Bandwidth, and Top Sites.
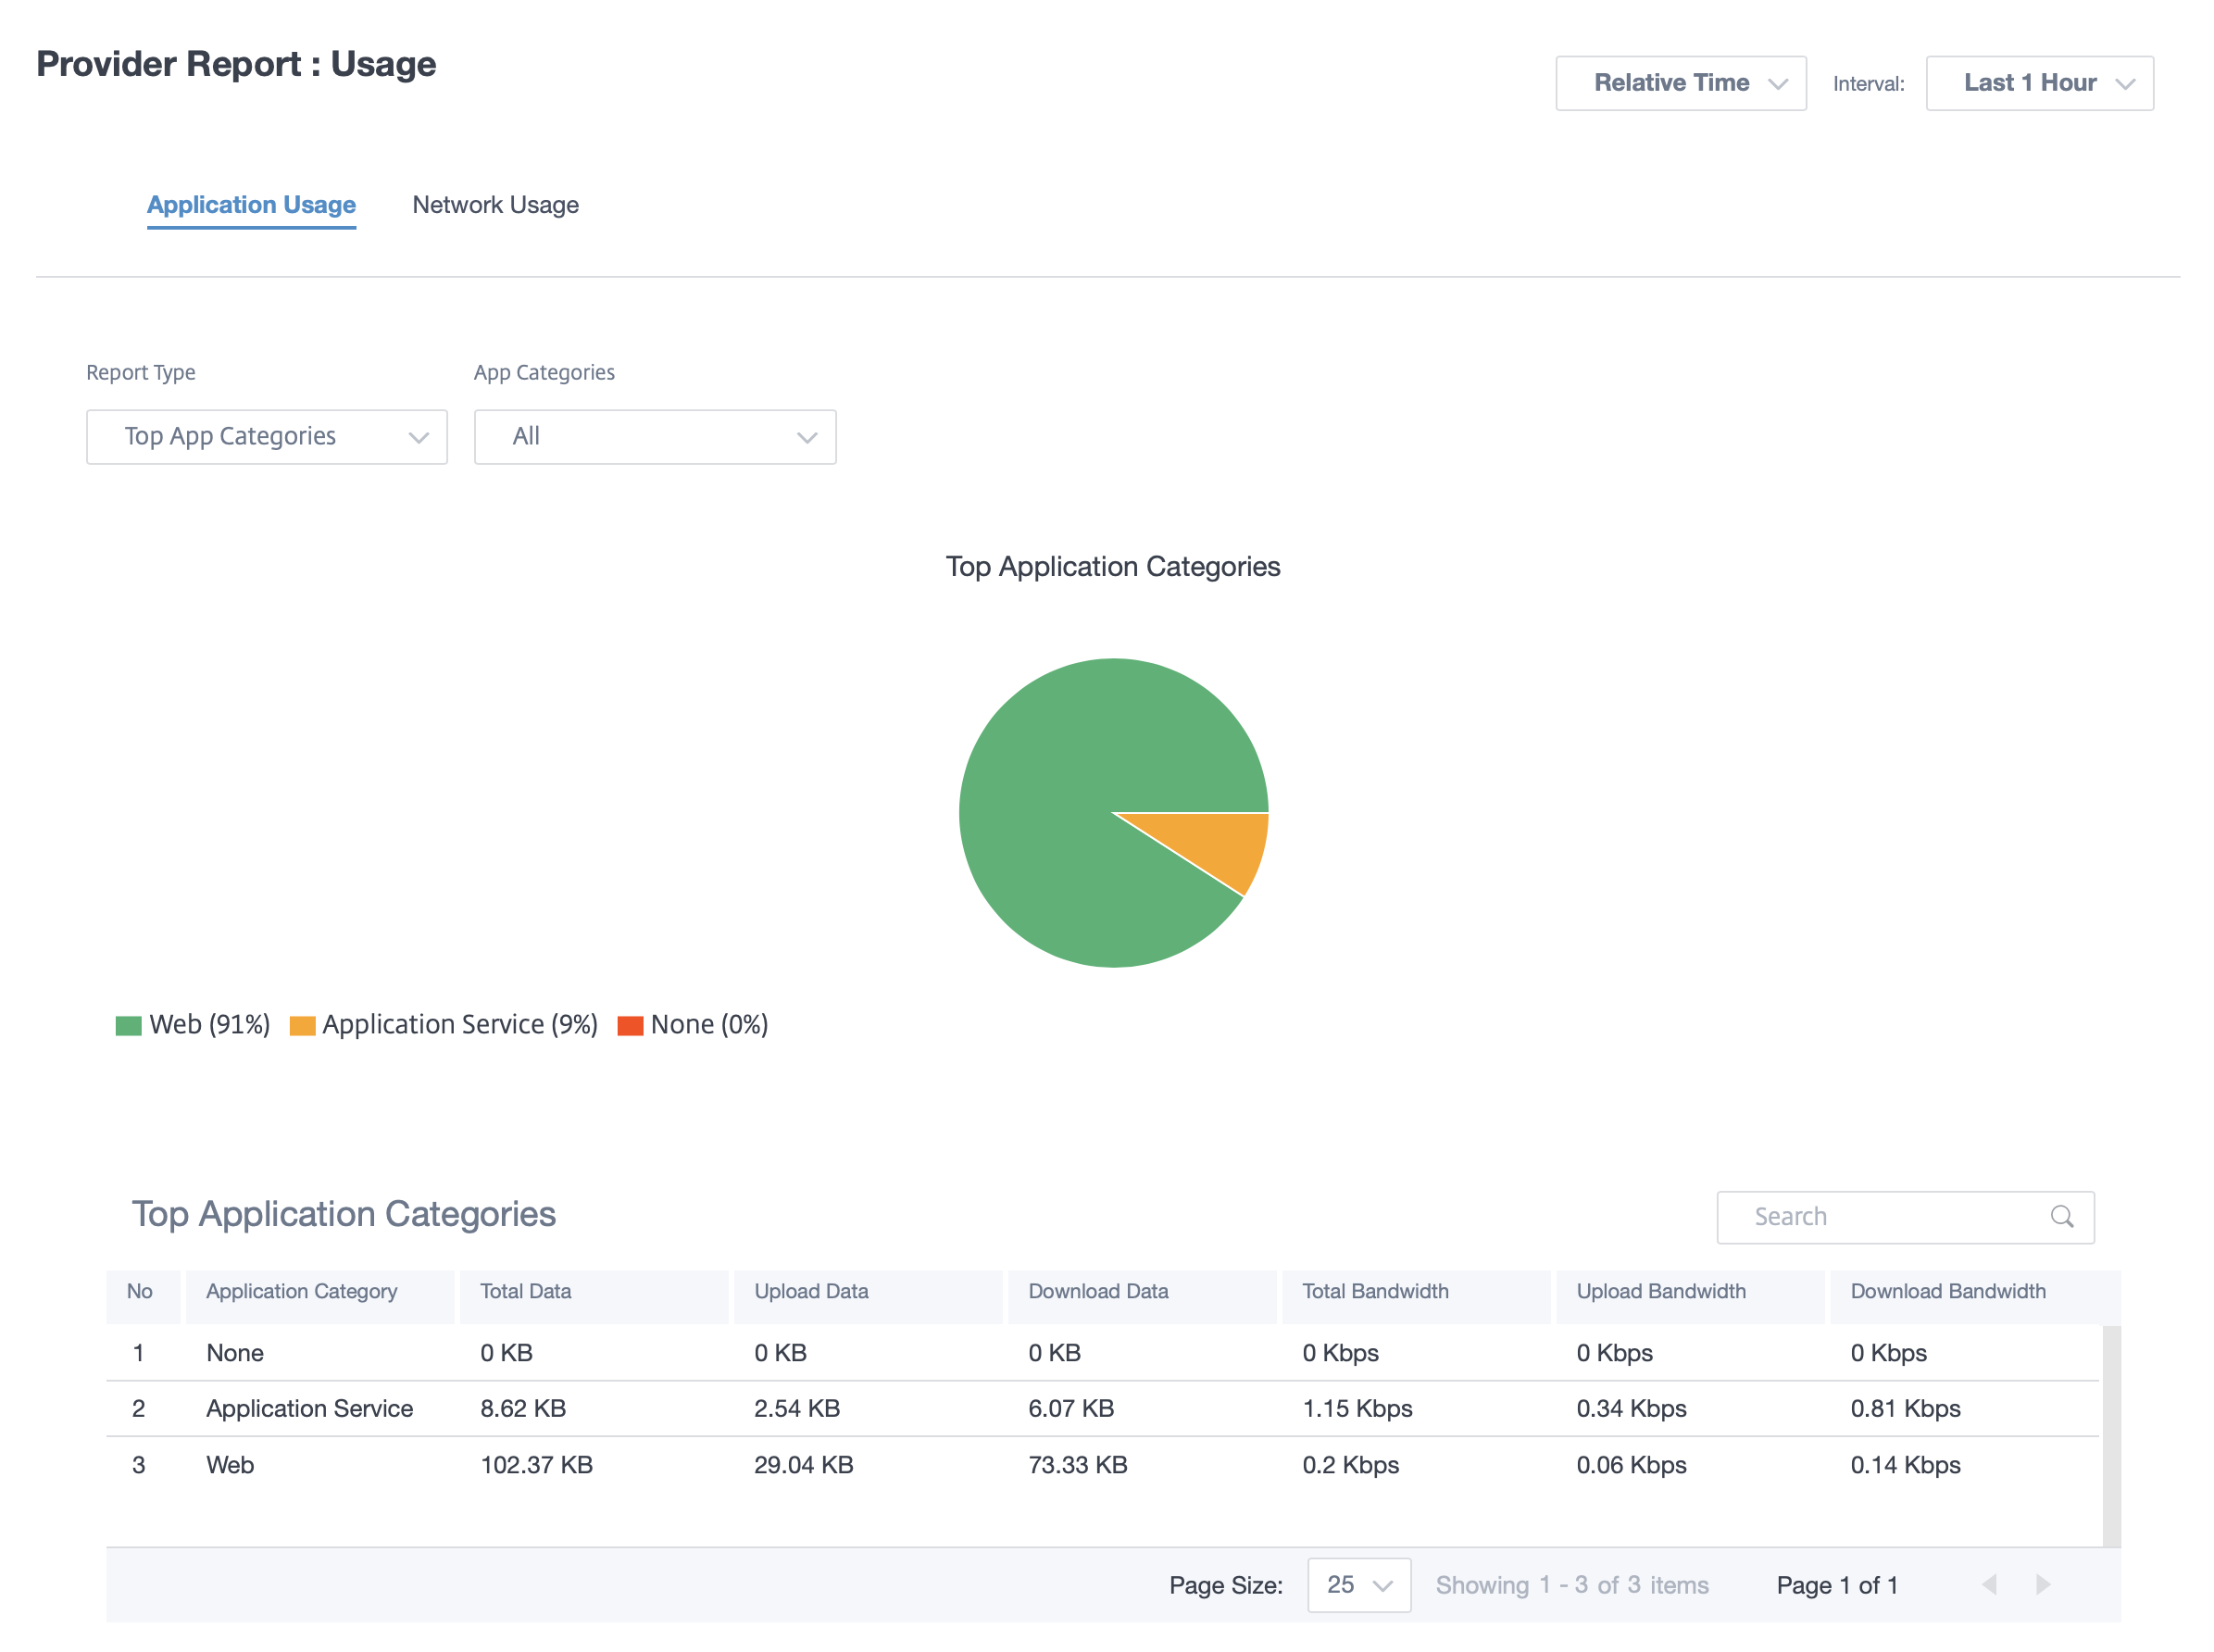
Top application and application categories
The Top Applications and Top Application Categories chart shows the applications and application families that are widely used across all customer networks. This allows you to analyze the data consumption pattern and reassign the bandwidth limit for each class of data, if necessary.
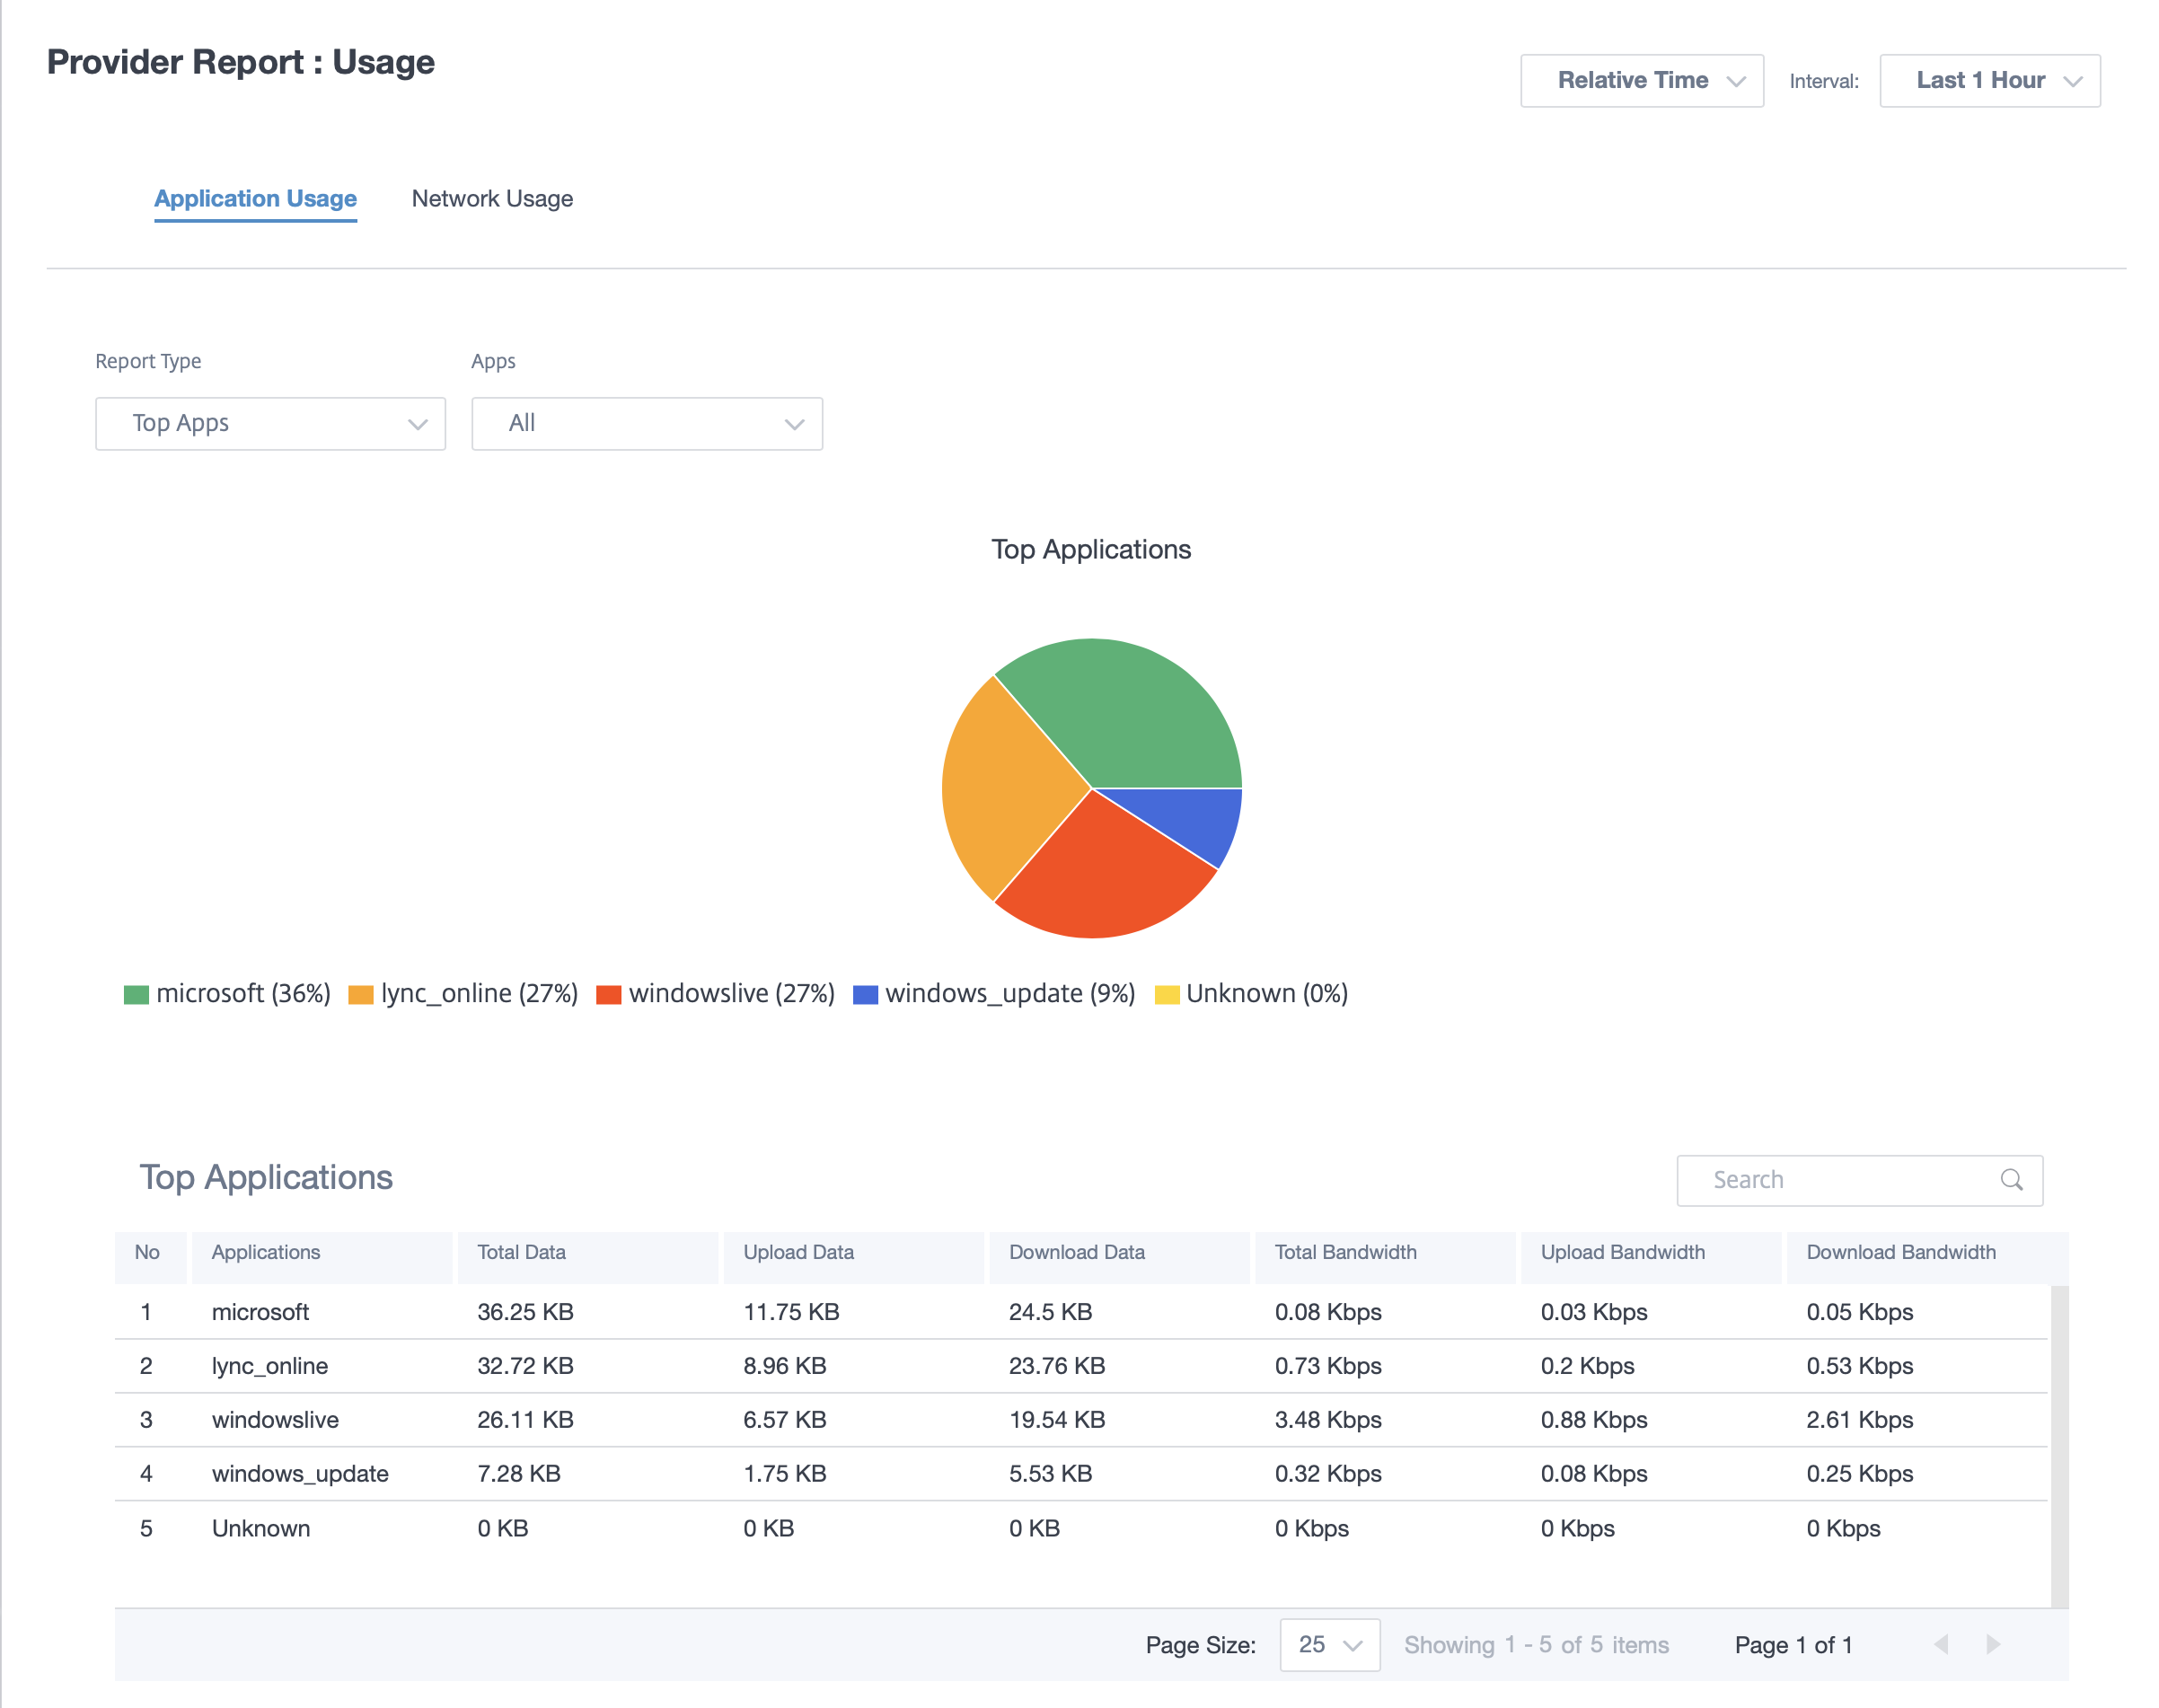
You can view the bandwidth usage statistics. The bandwidth statistics are collected for the selected time interval. You can filter the statistics report based on the Report Type, Apps or Apps Categories, and Metrics.
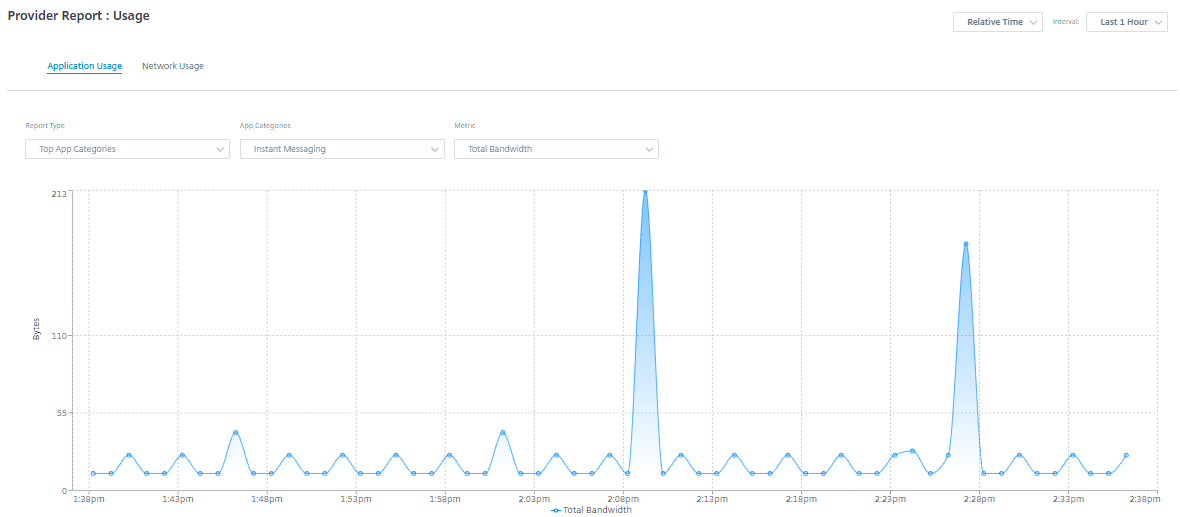
- Report Type: Select Top App or App Categories from the list.
- Apps/App Categories: Select top application or categories from the list.
- Metric: Select the bandwidth metric (such as Total Data, Incoming Data, Total Bandwidth) from the list.
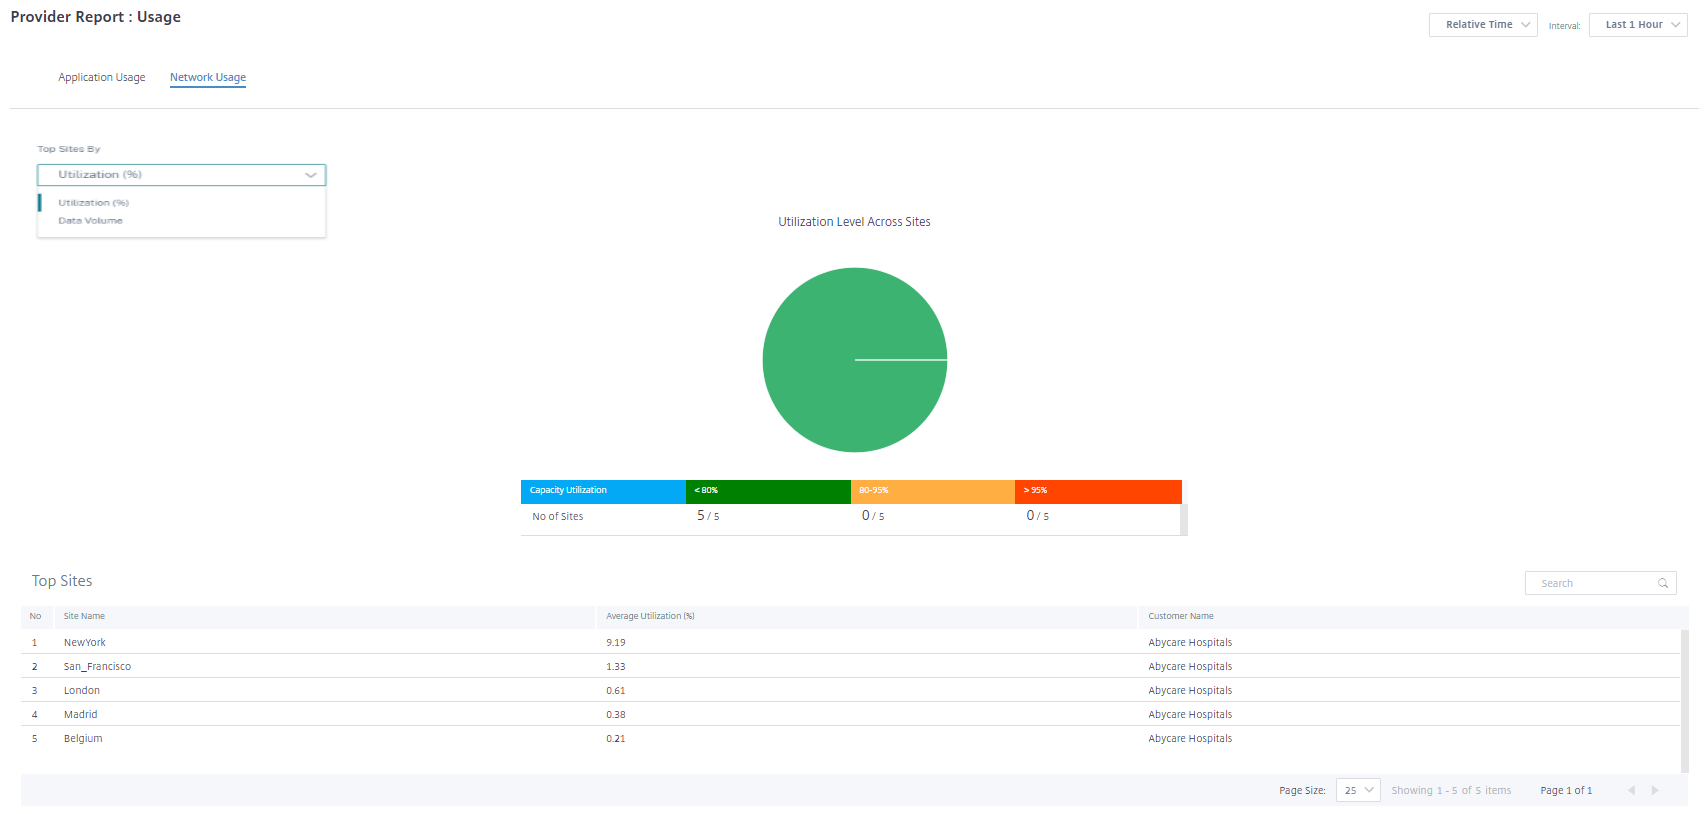
Network usage
The network usage chart depicts the top 10 sites across all the customers that have the highest bandwidth usage. You can view the Sites by Utilization (%) or Data Volume (MB).
Inventory
The provider can view the entire device inventory across all the customers. You can choose to view an inventory summary or a detailed view.
The inventory summary view provides a chart of the inventory spread, depicting the various appliance models and the number of each type of appliances used across customer networks.
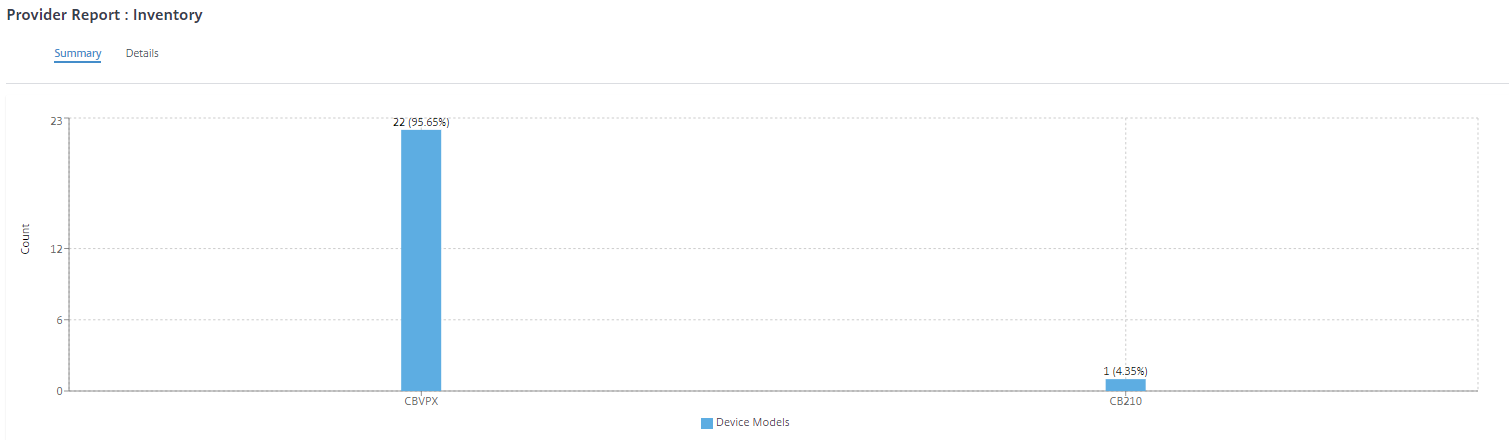
Suitable filtering options can be used as needed for example: Look for all appliances belonging to a specific customer, or all appliances with a certain device model and so on
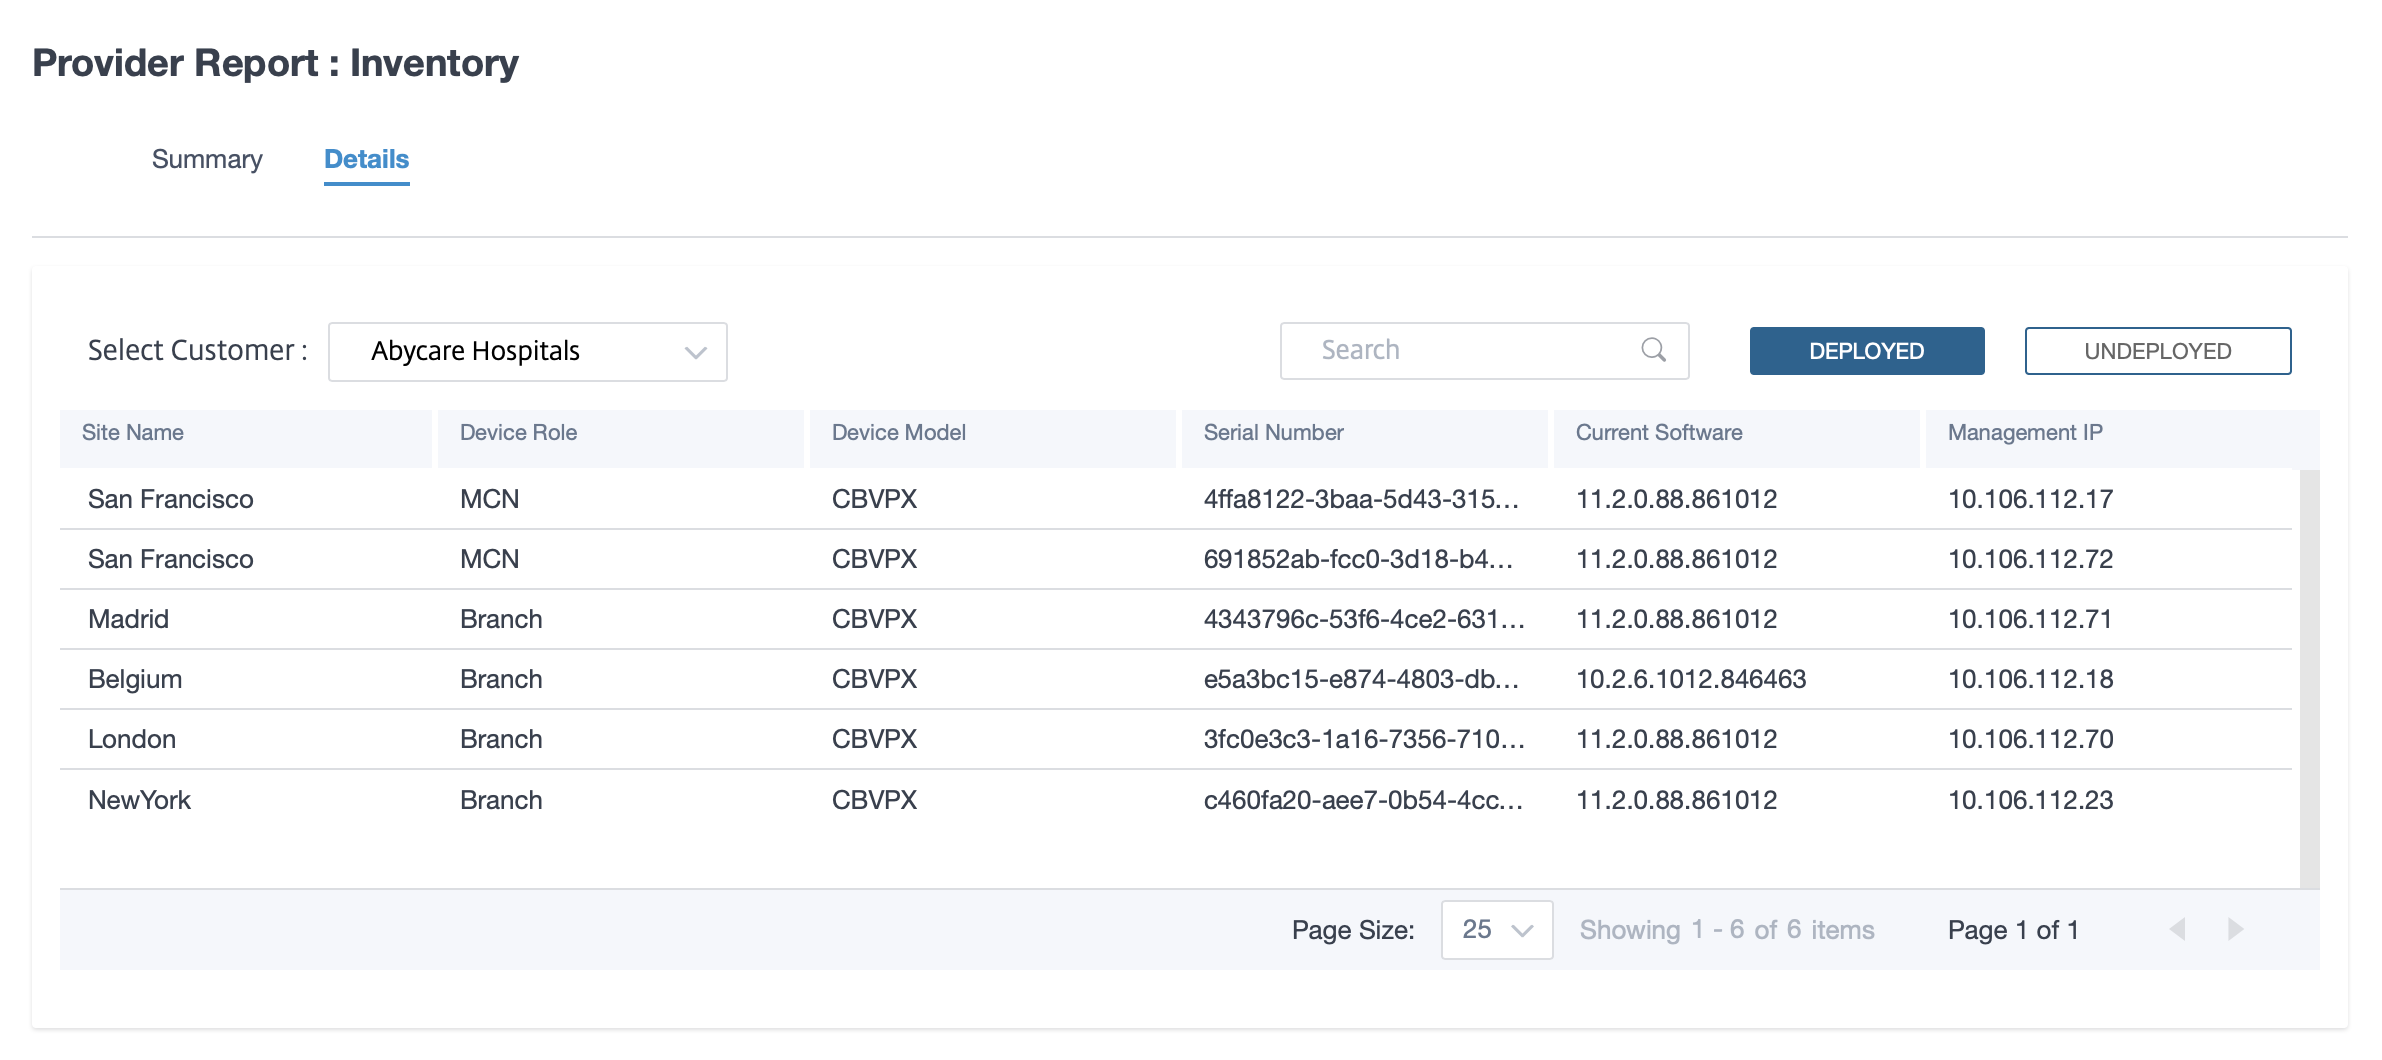
The inventory detailed view provides a list of all the appliances that are deployed and those appliances that are configured but not deployed yet. Choose a customer from the Select Customer drop-down list. You can view the site name, device role, device model, device serial number, current software, and device management IP address.
Share
Share
This Preview product documentation is Cloud Software Group Confidential.
You agree to hold this documentation confidential pursuant to the terms of your Cloud Software Group Beta/Tech Preview Agreement.
The development, release and timing of any features or functionality described in the Preview documentation remains at our sole discretion and are subject to change without notice or consultation.
The documentation is for informational purposes only and is not a commitment, promise or legal obligation to deliver any material, code or functionality and should not be relied upon in making Cloud Software Group product purchase decisions.
If you do not agree, select I DO NOT AGREE to exit.