Network Troubleshooting
Customers can view logs of all the network appliances, enabling quick troubleshooting.
Audit logs
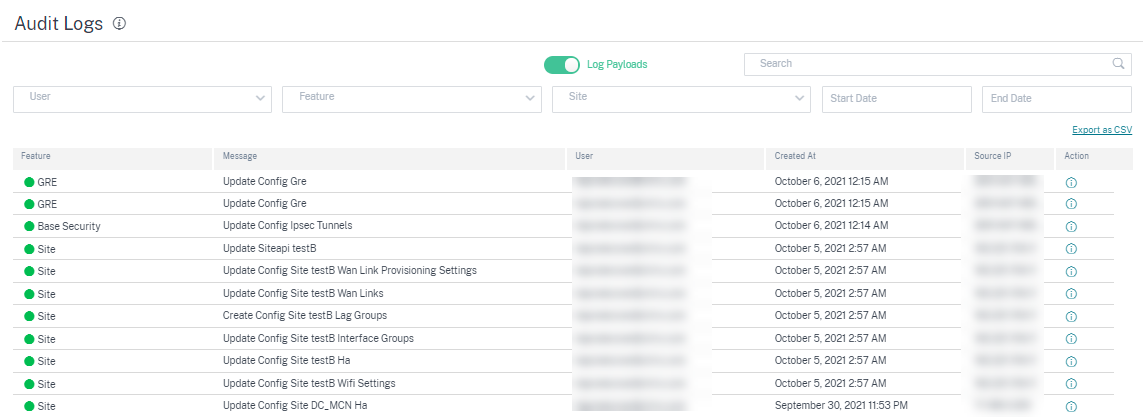
Audit logs capture the action, time, and result of the action performed by users on a customer network. Navigate to Troubleshooting > Audit Logs to view the Audit Logs page.
The Audit logs page displays the following information:
- Search bar: Search for an audit activity based on a keyword.
-
Filtering options: Run an audit log search by filtering based on the following criteria:
- User
- Feature
- Site
- Time range
- Export as CSV: When you click this option, the audit log entries are exported to a CSV file.
-
Audit Info: Click the icon on the Action column to navigate to the Audit Info section. This section provides the following information:
- Method: HTTP request method of the invoked API.
- Status: Result of the API request. You see the following error response when the API request fails.
- Response: Error response when the API request fails. This field is displayed only when the API request fails.
- Payload: Body of the request sent through API.
-
URL: HTTP URL of the revoked API.
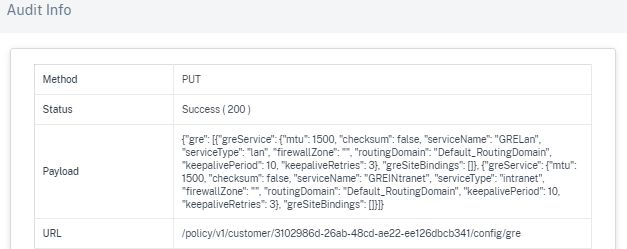
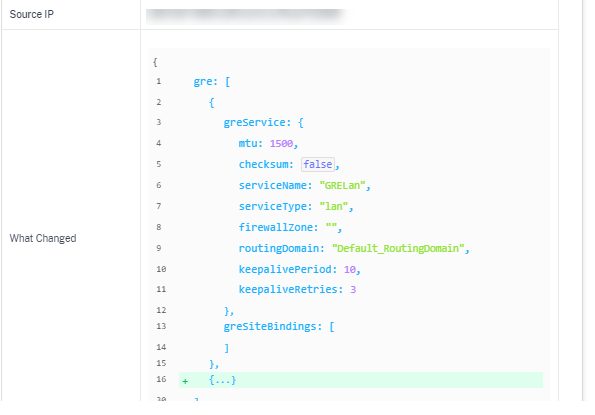
- Source IP: The IP address of the endpoint from which the SD-WAN features are configured. This field is available on the Audit logs page and the Audit Info page.
-
What Changed: This section displays the logs of all the changes made to the SD-WAN features through the UI. Enable the Log Payloads toggle button to view the changes on the Audit Info page.
-
Log payloads: By default, this option is disabled. When enabled, the request body of the API message is displayed in the Audit Info section. For more information about API, see API guide for Citrix SD-WAN Orchestrator.
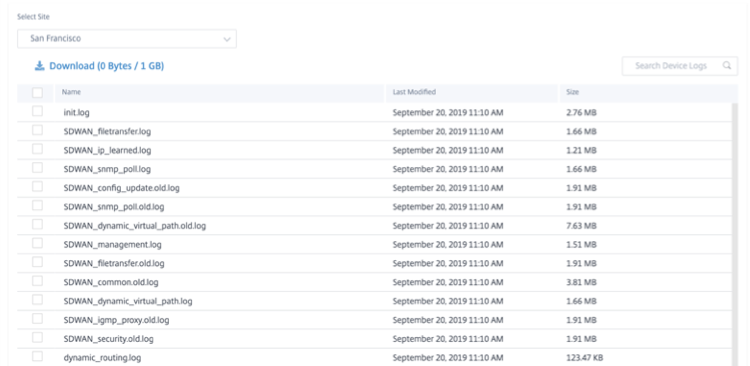
Device logs
Customers can view the device logs that are specific to sites.
You can select specific device logs, download it, and share it with site admins if necessary.
Security Logs
In the Citrix SD-WAN appliance, the Edge Security events are logged in the SDWAN_advanced_firewall.log file. The log file is periodically rotated based on the size, with up to 23 archives or a day’s worth of logs remaining, whichever is less. For example, consider the following two use cases:
- If the log file fills up at a rate of 1 GB per 20 transactions (log entries), logs for approximately 8 hours is available, in the appliance, at any given time.
- If the log file fills up at a rate of 1 GB per hour or slower, logs for exactly a day are available in the appliance.
Note
- The size threshold for log rotation depends on the appliance. For the Citrix SD-WAN™ 1100 appliance the log rotation size threshold is 1 GB.
- The log file SDWAN_advanced_firewall.log is available for Citrix SD-WAN 1100 appliance only. It is not available on Citrix SD-WAN 210 SE and Citrix SD-WAN 210 SE LTE appliances.
To receive the security logs from the Citrix SD-WAN appliance, in the appliance UI, navigate to Configuration > Appliance Settings > Logging/Monitoring > Syslog Server and ensure that the Firewall Logs to Syslog option is enabled.
Retrieval from Citrix SD-WAN Orchestrator service
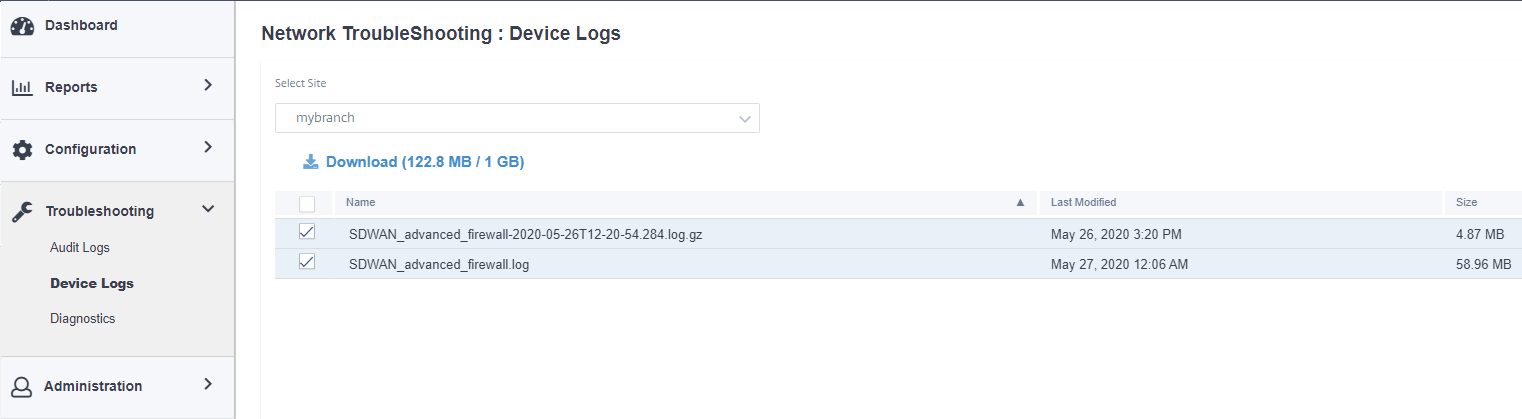
Similar to other appliance log files, you can retrieve the Edge Security firewall logs from the Citrix SD-WAN Orchestrator service. At the network level, navigate to Troubleshooting > Device Logs, select a site with Edge Security enabled, select the Advanced Firewall logs you want to download and click Download.
Exporting to external syslog server
If an external syslog server is configured on the appliance UI (Appliance Settings > Logging/Monitoring > Syslog server) Edge Security logs are generated and offloaded to this server.
Log entries
Edge Security log entries follow the Common Event Format (CEF). CEF is a standard that defines the syntax of log messages and therefore allows the interoperability of multiple devices generating log messages in a solution.
CEF consists of a standard header and a variable extension. The header format is as follows:
Timestamp host CEF:Version|Device Vendor|Device Product|Device Version|Device Event Class ID|Name|Severity|[Extension]
<!--NeedCopy-->
Example:
Jan 18 11:07:53 sd-wan CEF:0|Citrix|SD-WAN|11.2.2.7|EdgeSec|Name|Severity|Extension
<!--NeedCopy-->
The following fields are common to all edge security logs generated by SD-WAN:
-
Timestamp: The time when the log message is generated.
Note
This time can be different from the time of the event the message corresponds to.
-
Host: The name of the host that generates the log file. For example, mybranch.
-
CEF: A fixed string, indicating that the remainder of the message follows the CEF format.
Note
No other format is supported.
-
Version: Identifies the version of the CEF format. The current CEF version is 0.
-
Device Vendor: The vendor of the instance or appliance generating the CEF message. The field is always Citrix®.
-
Device Product: The product, SD-WAN.
-
Device Version: The software version of the SD-WAN appliance in major.minor.patch.buildnumber format. For example, 11.2.0.88.
-
Device Event Class ID: A unique identifier for every event-type. For Edge security logs, it is always EdgeSec.
-
Name: A human-readable description of the Edge Security event-type. For example, HTTP, FTP, and so on.
-
Severity: Reflects the security criticality of the event. The severity levels defined in the CEF standard are as follows:
- 0-3=Low
- 4-6=Medium
- 7-8=High
- 9-10=Very-High
For Citrix SD-WAN Edge Security events, the following criteria are used to determine the severity level:
Severity level Description 0 All SESSION events and all allowed HTTP Web filtering events 3 All clean (allowed) FTP, SMTP, and HTTP Anti-Malware events 4 Logged IPS events 6 Blocked HTTP Web filtering events 7 Blocked IPS events 8 Blocked (infected) FTP, SMTP, and HTTP Anti-Malware events - Extensions: A collection of key-value pairs that provide more details on the event. For example, “rt=Aug 13 2020 11:46:55”, where “rt” is the key for the event timestamp and “Aug 13 2020 11:46:55” is the value. The key-value pairs used depend on the event type the CEF message corresponds to. The detailed descriptions of the event types are provided in the following sections.
HTTP(S)
HTTP(S) log entries capture events related to HTTP or HTTPS traffic. Such events can be generated by either the web-filtering component, which performs URL categorization on HTTP(S) requests, or the Anti-Malware component, which scans HTTP responses for malware infections. The following table describes the various extensions in an HTTP log entry:
| Field | Description |
|---|---|
| rt | The time of the event, without time zone. The time is expressed in UTC. |
| cn1 | The session identifier, allows correlation with session events |
| cn1Label | Descriptive text for the cn1 field. The value is session_Id. |
| cs1 | The configured security policy |
| cs1Label | Descriptive text for the cs1 field. The value is Security profile. |
| src | The source IP address (client-side) |
| spt | The source port (client-side) |
| dst | The destination IP address (server-side) |
| dpt | The destination port address (server-side) |
| requestMethod | The HTTP request (for example, GET, POST) |
| request | The HTTP URL |
| dhost | The HTTP host name |
| act | The action for the HTTP event. For an allowed HTTP event, the value is allowed and for a blocked HTTP event, the value is blocked. |
| reason | The component that generated the event. Valid values are web_filter and anti_malware. |
| cs2 | The category name of the URL category matched |
| cs2Label | Descriptive text for the cs2 field. The value is URL Category. |
| cs3 | The name of the malware identified in the payload (if any) |
| cs3Label | Descriptive text for the cs3 field. The value is Malware name. |
HTTP events can be generated by either the web-filtering or Anti-Malware components. For web-filtering events, the value for cs3 key is blank, whereas for Anti-Malware events, the value for cs2 key is blank.
A typical log entry for an allowed HTTP web-filtering event is as follows:
Oct 8 2020 09:51:01 mybranch CEF:0|Citrix|SD-WAN|11.2.2.2|EdgeSec|HTTP|0|rt=Oct 8 2020 09:51:01 cn1=104946811893306 cn1Label=session_id cs1=Test_Prof1 cs1Label=Security profile src=192.168.0.2 spt=54749 dst=192.168.1.2 dpt=80 requestMethod=GET request=http://192.168.1.2/eicar.exe dhost=192.168.1.2 act=allowed reason=web_filter cs2=Uncategorized cs2Label=URL Category cs3= cs3Label=Malware name
<!--NeedCopy-->
A typical log entry for a Blocked HTTP web-filtering event is as follows:
Oct 8 2020 09:46:57 mybranch CEF:0|Citrix|SD-WAN|11.2.2.2|EdgeSec|HTTP|6|rt=Oct 8 2020 09:46:57 cn1=104946811893249 cn1Label=session_id cs1=Test_Prof1 cs1Label=Security profile src=192.168.0.2 spt=59543 dst=192.168.1.2 dpt=443 requestMethod=GET request=http://www.randomadultsite.com/ dhost=www.randomadultsite.com act=blocked reason=web_filter cs2=Adult and Pornography cs2Label=URL Category cs3= cs3Label=Malware name
<!--NeedCopy-->
A typical log entry for an allowed HTTP Anti-Malware event is as follows:
Oct 8 2020 11:49:09 mybranch CEF:0|Citrix|SD-WAN|11.2.2.2|EdgeSec|HTTP|3|rt=Oct 8 2020 11:49:08 cn1=104946811893527 cn1Label=session_id cs1=Test_Prof1 cs1Label=Security profile src=192.168.0.2 spt=34143 dst=192.168.1.2 dpt=80 requestMethod=GET request=http://192.168.1.2/harmless.exe dhost=192.168.1.2 act=allowed reason=anti_malware cs2= cs2Label=URL Category cs3= cs3Label=Malware name
<!--NeedCopy-->
A typical log entry for a blocked HTTP Anti-Malware event is as follows:
Oct 8 2020 11:45:43 mybranch CEF:0|Citrix|SD-WAN|11.2.2.2|EdgeSec|HTTP|8|rt=Oct 8 2020 11:45:43 cn1=104946811893520 cn1Label=session_id cs1=Test_Prof1 cs1Label=Security profile src=192.168.0.2 spt=37702 dst=192.168.1.2 dpt=80 requestMethod=GET request=http://192.168.1.2/eicar.exe dhost=192.168.1.2 act=blocked reason=anti_malware cs2= cs2Label=URL Category cs3=EICAR-Test-File cs3Label=Malware name
<!--NeedCopy-->
FTP events
The FTP log entries capture user activity related to FTP requests. The following table describes the various fields in an FTP log entry:
| Field | Description |
|---|---|
| rt | The time of the event, without Time Zone |
| cn1 | The session identifier, allows correlation with session events |
| cn1Label | Descriptive text for the cn1 field. The value is session_Id. |
| cs1 | The configured security policy |
| cs1Label | Descriptive text for the cs1 field. The value is Security profile. |
| src | The source IP address (client-side) |
| dst | The destination IP address (server-side) |
| request | The FTP URI |
| act | The action for the FTP event. For an allowed FTP event, the value is allowed and for a blocked FTP event, the value is blocked. |
| reason | The component that generated the event. The only component generating FTP events are currently anti_malware. |
| cs3 | The name of the malware identified in the payload (if any) |
| cs3Label | Descriptive text for the cs3 field. The value is Malware name. |
A typical log entry for an allowed FTP Anti-Malware event is as follows:
Oct 8 2020 09:49:56 mybranch CEF:0|Citrix|SD-WAN|11.2.2.2|EdgeSec|FTP|3|rt=Oct 8 2020 09:49:56 cn1=104946811893256 cn1Label=session_id cs1=Test_Prof1 cs1Label=Security profile src=192.168.0.2 dst=192.168.1.2 request=harmless.exe act=allowed reason=anti_malware cs3= cs3Label=Malware name
<!--NeedCopy-->
A typical log entry for a blocked FTP Anti-Malware event is as follows:
Oct 8 2020 09:50:06 mybranch CEF:0|Citrix|SD-WAN|11.2.2.2|EdgeSec|FTP|8|rt=Oct 8 2020 09:50:06 cn1=104946811893276 cn1Label=session_id cs1=Test_Prof1 cs1Label=Security profile src=192.168.0.2 dst=192.168.1.2 request=eicar.exe act=blocked reason=anti_malware cs3=EICAR-Test-File cs3Label=Malware name
<!--NeedCopy-->
SMTP events
The SMTP log entries capture user activity related to unencrypted email, sent using the SMTP protocol. The following table describes the various fields in an SMTP log entry:
| Field | Description |
|---|---|
| rt | The time of the event, without Time Zone |
| cn1 | The session identifier, allows correlation with session events |
| cn1Label | Descriptive text for the cn1 field. The value is session_Id. |
| cs1 | The configured security policy |
| cs1Label | Descriptive text for the cs1 field. The value is Security profile. |
| src | The source IP address (client-side) |
| spt | The source port (client-side) |
| dst | The destination IP address (server-side) |
| dpt | The destination port address (server-side) |
| cn2 | The message identifier |
| cn2Label | Descriptive text for the cn2 field. The value is Message identifier. |
| cs4 | The email subject |
| cs4Label | Descriptive text for the cs4 field. The value is Message subject. |
| suser | The address of the sender |
| duser | The address of the receiver |
| act | The action for the SMTP event. The value is allowed, for an allowed SMTP email message, blocked, for a blocked SMTP email message, and remove for an SMTP email message that was allowed after a malware payload was removed. |
| reason | The reason for the action. The value is anti_malware. |
| cs3 | The name of the malware identified in the payload (if any) |
| cs3Label | Descriptive text for the cs3 field. The value is Malware name. |
A typical log entry for an SMTP event with virus is as follows:
Oct 8 2020 11:51:31 mybranch CEF:0|Citrix|SD-WAN|11.2.2.2|EdgeSec|SMTP|8|rt=Oct 8 2020 11:51:31 cn1=104946811893617 cn1Label=session_id cs1=Test_Prof1 cs1Label=Security profile src=192.168.0.2 spt=36097 dst=192.168.1.2 dpt=25 cn2=104946811893546 cn2Label=message identifier cs4=Test email cs4Label=subject suser=sender@sender.com suserLabel=sender duser=receiver@receiver.com duserLabel=receiver act=remove reason=anti_malware cs3=EICAR-Test-File cs3Label=Malware name
<!--NeedCopy-->
A typical log entry for an SMTP event without virus is as follows:
Oct 8 2020 11:50:50 mybranch CEF:0|Citrix|SD-WAN|11.2.2.2|EdgeSec|SMTP|3|rt=Oct 8 2020 11:50:50 cn1=104946811893573 cn1Label=session_id cs1=Test_Prof1 cs1Label=Security profile src=192.168.0.2 spt=52737 dst=192.168.1.2 dpt=25 cn2=104946811893537 cn2Label=message identifier cs4=Test email cs4Label=subject suser=sender@sender.com suserLabel=sender duser=receiver@receiver.com duserLabel=receiver act=allowed reason=anti_malware cs3= cs3Label=Malware name
<!--NeedCopy-->
IPS/IDS
| Field | Description |
|---|---|
| rt | The time of the event, without Time Zone |
| cn3 | The IPS/IDS signature identifier that triggered the event |
| cn3Label | Descriptive text for cn3. The value is signature_id. |
| src | The source IP address of the packet |
| spt | The source port of the packet (if applicable) |
| dst | The destination IP address of the packet |
| dpt | The destination port of the packet (if applicable) |
| proto | The protocol of the packet (TCP, UDP) |
| act | The action for the IPS/IDS event. For an allowed IPS/IDS event the value is logged, whereas for a blocked IPS/IDS event, the value is blocked. |
| cs5 | The class-type of the IPS/IDS signature that triggered the event |
| cs5Label | Descriptive text for cs5. The value is class-type |
| msg | The IPS message associated with the event |
A typical log entry for a blocked IPS event is as follows:
Aug 14 2020 14:58:59 mybranch CEF:0|Citrix|SD-WAN|11.2.2.53|EdgeSec|HTTP|7|rt=Aug 14 2020 14:58:59 cn3=2210051 cn3Label=signature_id src=192.168.0.2 spt=1944 dst=192.168.1.2 dpt=22 proto=TCP act=blocked cs5=protocol-command-decode cs5Label=class-type msg=SURICATA STREAM Packet with broken ack
<!--NeedCopy-->
A typical log entry for a logged IPS event is as follows:
Oct 8 2020 12:57:36 mybranch CEF:0|Citrix|SD-WAN|11.2.2.2|EdgeSec|IPS|4|rt=Oct 8 2020 12:57:36 cn3=2210051 cn3Label=signature_id src=192.168.0.2 spt=1076 dst=192.168.1.2 dpt=22 proto=TCP act=logged cs5=protocol-command-decode cs5Label=class-type msg=SURICATA STREAM Packet with broken ack
<!--NeedCopy-->
Session Events
The Session log entries capture user activity at the TCP layer. They complement HTTP, FTP, and SMTP events by providing insight about TCP session duration, and start and stop timestamps. Session log entries can refer to session start, session end, or update events.
| Field | Description |
|---|---|
| rt | The time of the event, without Time Zone. For session start events, the timestamp is when the session was established. |
| cn1 | The session identifier |
| cn1Label | Descriptive text for the cn1 field. The value is session_Id. |
| cs1 | The configured security policy |
| cs1Label | Descriptive text for the cs1 field. The value is Security profile. |
| src | The source IP address (client-side) |
| spt | The source port (client-side) |
| dst | The destination IP address (server-side) |
| dpt | The destination port address (server-side) |
| act | The type of the session event. It can be new_session for events referring to a newly established session, session_update, for events referring to existing long-lived sessions, and session_closed, for events referring to sessions closing. |
| end | The time the session closed without time zone. The field is only applicable to session_closed events. |
A typical log entry for a session start event is as follows:
Oct 7 2020 23:46:44 mybranch CEF:0|Citrix|SD-WAN|11.2.2.2|EdgeSec|Session|0|rt=Oct 7 2020 23:46:44 cn1=104946811892916 cn1Label=session_id cs1=Test_Prof1 cs1Label=Security profile src=192.168.0.2 spt=43838 dst=10.78.242.11 dpt=53 act=new_session
<!--NeedCopy-->
A typical log entry for a session end event is as follows:
Oct 7 2020 23:46:46 mybranch CEF:0|Citrix|SD-WAN|11.2.2.2|EdgeSec|Session|0|rt=Oct 7 2020 23:46:45 cn1=104946811892917 cn1Label=session_id cs1=1 cs1Label=Security profile end=1602114405989 src=192.168.0.2 spt=42253 dst=10.78.242.11 dpt=53 act=session_closed
<!--NeedCopy-->
Session Updates
The Session updates log entries capture user activity at the TCP layer for long-running sessions on a per-minute basis. Session updates help identify existing log entries (HTTP, SMTP, FTP, and session events) that correspond to still open sessions. The corresponding events can either be ignored, or treated as tentative, since session closure might update certain attributes (that is, session end time). Contrary to session_start and session_closed events, the session_update events only have a limited subset of the fields.
| Field | Description |
|---|---|
| rt | The time of the event, without Time Zone |
| cn1 | The session identifier |
| cn1Label | Descriptive text for the cn1 field. The value is session_Id. |
| act | The action for the IPS/IDS event. For a session update, the value is session_update. |
A typical log entry for a session update event is as follows:
Oct 7 2020 23:47:00 mybranch CEF:0|Citrix|SD-WAN|11.2.2.2|EdgeSec|Session|0|rt=Oct 7 2020 23:47:00 cn1=104946811892912 cn1Label=session_id act=session_update
<!--NeedCopy-->
Show Tech Support Bundle
The Show Tech Support (STS) Bundle contains important real-time system information such as access logs, diagnostics logs, firewall logs. The STS bundle is used to troubleshoot issues in the SD-WAN appliances. You can create, download the STS bundle, and share it with Citrix Support Representatives.
Select a site for which to create or download the STS bundle. If a site is configured in HA deployment mode, you can select the active or standby appliance for which to create or download the STS bundle.
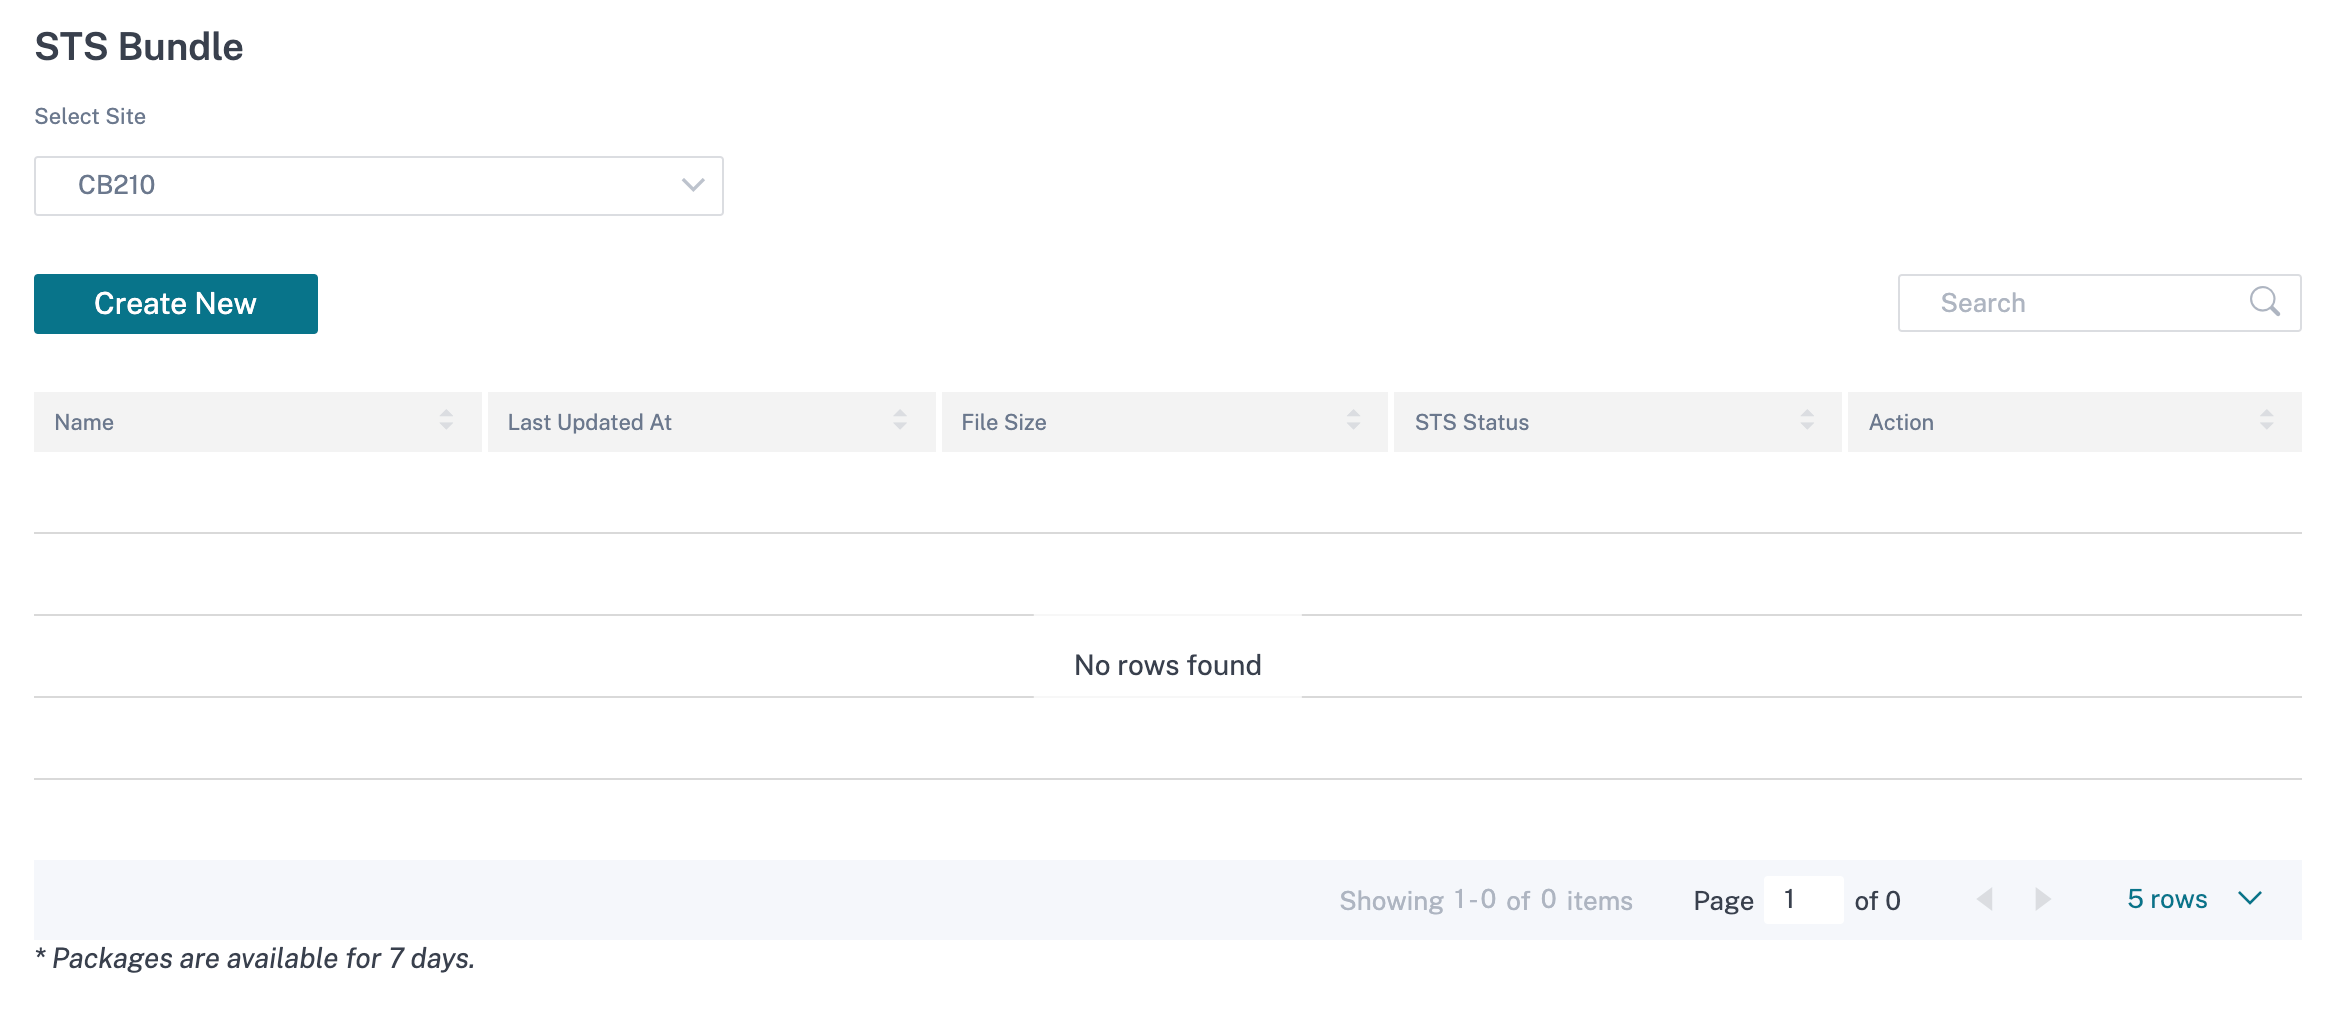
To create an STS bundle, at the network level, navigate to Troubleshooting > STS Bundle, select a site, and click Create New.
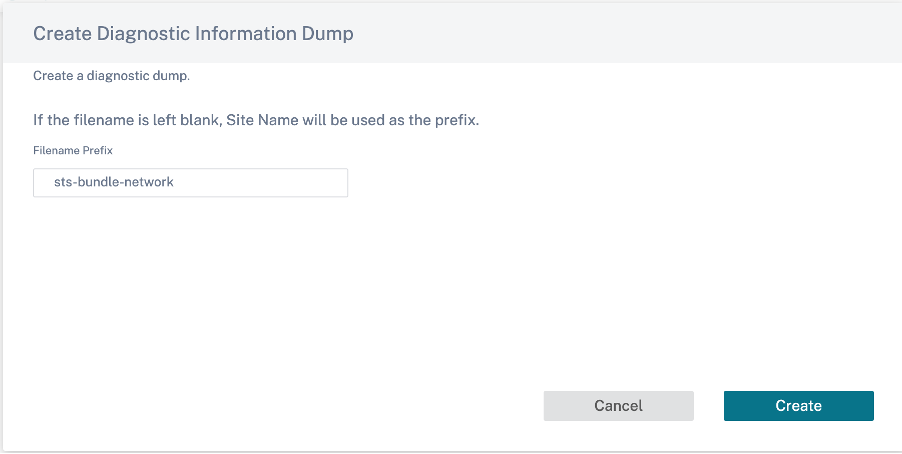
Provide a name for the STS bundle. The name must begin with a letter and can contain letters, numbers, dashes, and under-scores. The maximum allowed length of the name is 32 characters. The user provided name is used as a prefix in the final name. To ensure that the file names are unique (timestamp) and to help recognize the device from the STS package (serial number), the service generates a full name. If no name is provided, a name is auto-generated while creating the bundle.
You can request for a new STS only when the device is online and no STS process is running on the appliance. You can download an already available STS from the Citrix SD-WAN Orchestrator service even if the device is offline.
At any given time, the STS process is in one of the following states:
| STS Status | Description |
|---|---|
| Requested | A new STS bundle is requested. The request takes a few minutes to get processed. You can choose to cancel the STS creation process, if necessary. |
| Uploading | The created STS package is uploaded to the cloud service. The duration depends on the size of the package. The status is updated every 5 seconds. You cannot cancel the STS upload process. |
| Failure | The STS process has failed during creation or upload. You can delete the entries of failed STS operations. |
| Available for download | The STS creation and upload process are successful. You can now download or delete the STS packages. |
Once the STS process starts on the appliance, the progress is updated under the status column at regular intervals. For example, Requested (Collecting log files).
The STS bundles and failure records are maintained for 7 days, post which they are auto-deleted.