This content has been machine translated dynamically.
Dieser Inhalt ist eine maschinelle Übersetzung, die dynamisch erstellt wurde. (Haftungsausschluss)
Cet article a été traduit automatiquement de manière dynamique. (Clause de non responsabilité)
Este artículo lo ha traducido una máquina de forma dinámica. (Aviso legal)
此内容已经过机器动态翻译。 放弃
このコンテンツは動的に機械翻訳されています。免責事項
이 콘텐츠는 동적으로 기계 번역되었습니다. 책임 부인
Este texto foi traduzido automaticamente. (Aviso legal)
Questo contenuto è stato tradotto dinamicamente con traduzione automatica.(Esclusione di responsabilità))
This article has been machine translated.
Dieser Artikel wurde maschinell übersetzt. (Haftungsausschluss)
Ce article a été traduit automatiquement. (Clause de non responsabilité)
Este artículo ha sido traducido automáticamente. (Aviso legal)
この記事は機械翻訳されています.免責事項
이 기사는 기계 번역되었습니다.책임 부인
Este artigo foi traduzido automaticamente.(Aviso legal)
这篇文章已经过机器翻译.放弃
Questo articolo è stato tradotto automaticamente.(Esclusione di responsabilità))
Translation failed!
Diagnostics
The diagnostic feature allows you to run diagnostics test that helps in understanding SD-WAN deployments in the network. You can test the bandwidth usage, ping, and perform traceroute for the WAN links configured at different sites in the SD-WAN network. It provides information which helps in troubleshooting issues in existing configuration.
Diagnostic feature benefits
- The diagnostics tool offers single click for important statistics of end-to-end connectivity.
- You can use traceroute or ping or both for “A path” or multiple paths or ALL possible Paths.
- You can set user settings before running tests (like port, bandwidth, packet count, length of the packet). The tests display live progress for review and assessment. Ability to select and de-select all paths
- Ability to run one or a combination of tests on one or multiple paths of a VP.
- Display Interface/Path status and the actual results based on ping/traceroute/bandwidth.
- Displays VNI state, mac addr/status of port, part of the link in path under test.
- Displays important details of private/public/gateway ip of local target site running diagnostics and the private/public ip of the partner site hosting the receiver side link of the path under test.
- Evaluate traffic Underlay vs Overlay: Ability to compute test results between use of OVERLAY (SD-WAN Encapsulation) and underlay without encapsulation but still between same endpoints.
- Bandwidth tests (Comprehensive Upload/Download statistics per path): Provides detailed reports per path on upload and download speeds in kbps for both single and both directions in the same test.
- Ability to perform timed tests for upload/download per direction (in minutes) for both TCP/UDP.
- MPLS QOS policy validation by traffic through DSCP tag based queue paths.
- Enable MTU detection per path tests provide MTU detected in the path to indicate possible fragmentation or drops due to MTU as a potential reason.
- Download entire test results at once for future reference.
Diagnostics tool and site diagnostics
The Diagnostic Tool has two modes (CONTROL/DATA).
- Control – where only path capacity is captured in the path and no other paths are chosen without going through the schedulers or path selection algorithm
- Data – Can send traffic that goes through path selection/schedulers.
Site Diagnostics – Internally only has CONTROL mode but not data mode.
The Diagnostic tool can operate control mode only on one PATH whereas Site Diagnostics can perform it on ONE/ALL/AS many paths.
To run tests in the Diagnostics Tool page:
-
In the SD-WAN GUI, navigate to Configuration > System Maintenance > Diagnostics > Diagnostics Tool.
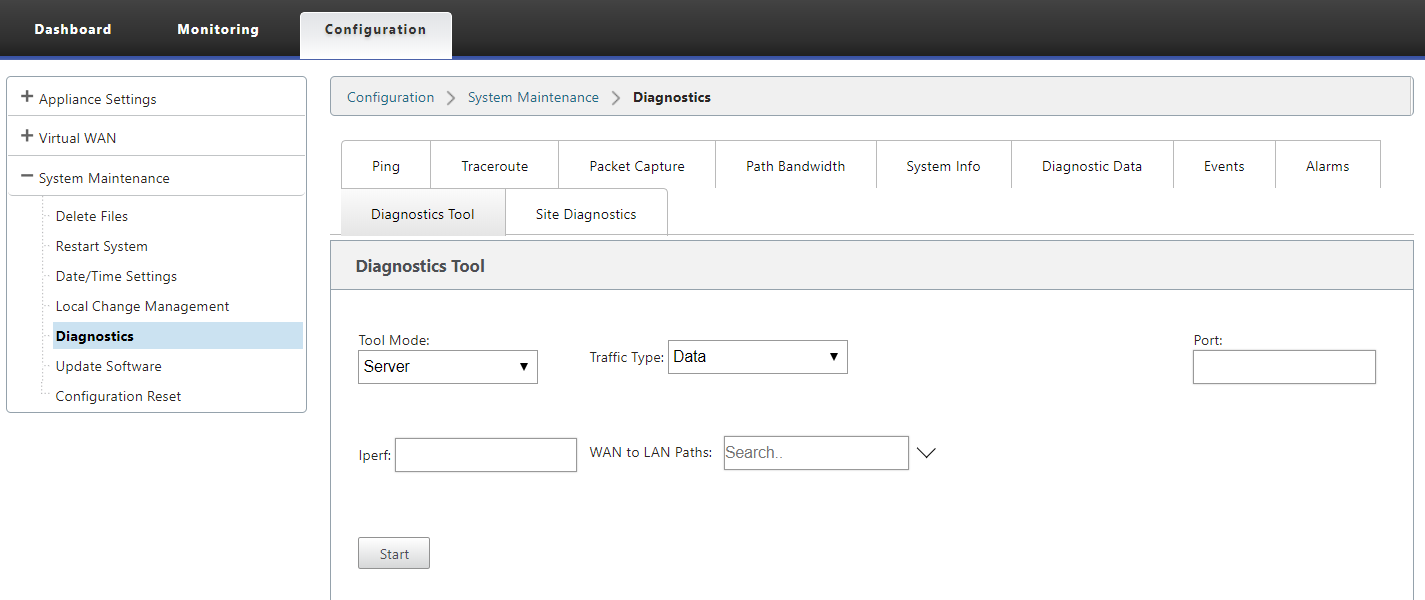
- Select either Server or Client in the Tool Mode drop-down list.
- Select either Data or Control from the Traffic Type drop-down list.
- Enter the Port number and Ipref information.
- Select the virtual paths. This is auto-populated based on the Tool mode selected.
- Server: WAN to LAN paths.
- Client: LAN to WAN paths.
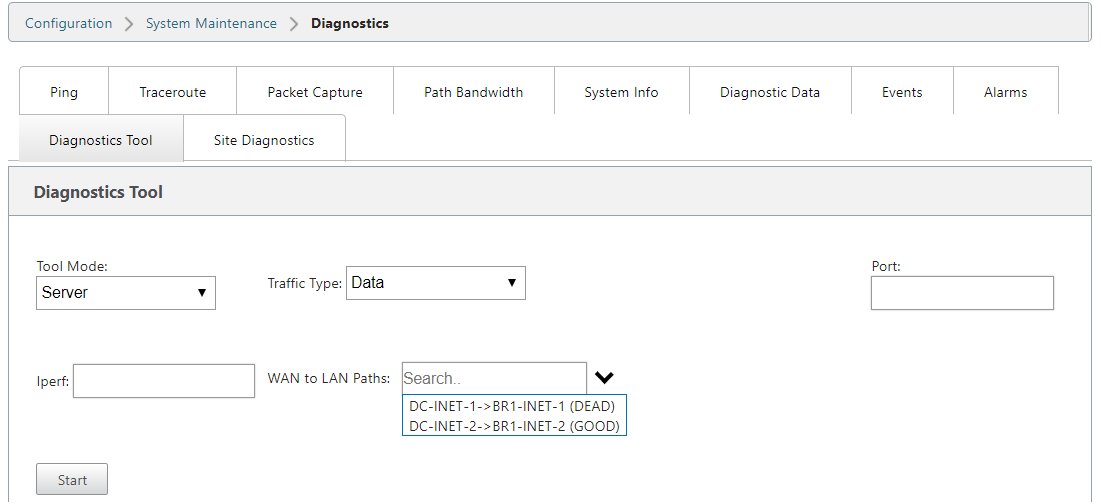
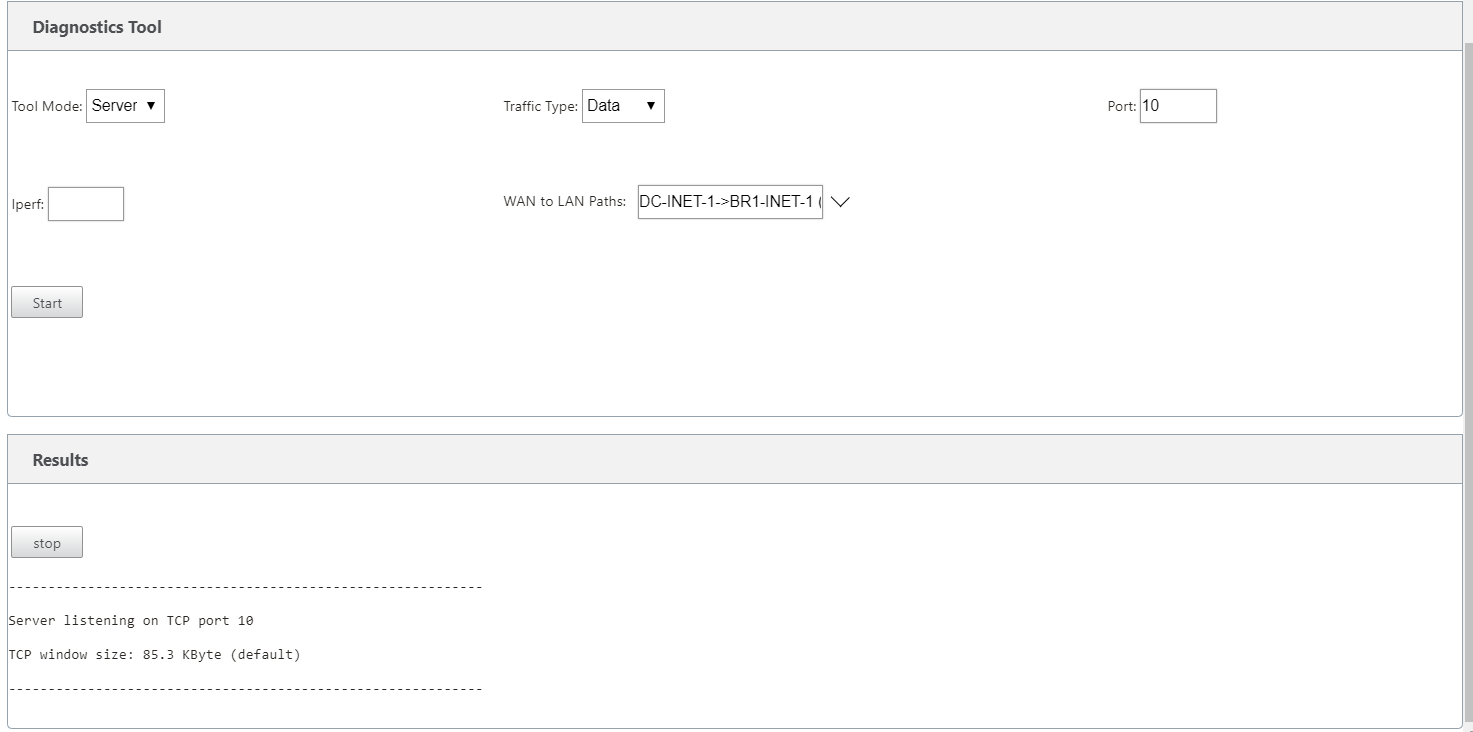
- Click **Start. The results page is displayed.
Site Diagnostics
To view diagnostics for a site:
-
Select the Virtual Path and WAN Links associated with the selected site is displayed.

-
Choose Ping, Traceroute, or Bandwidth Test options to run the diagnostics test. Click Run.

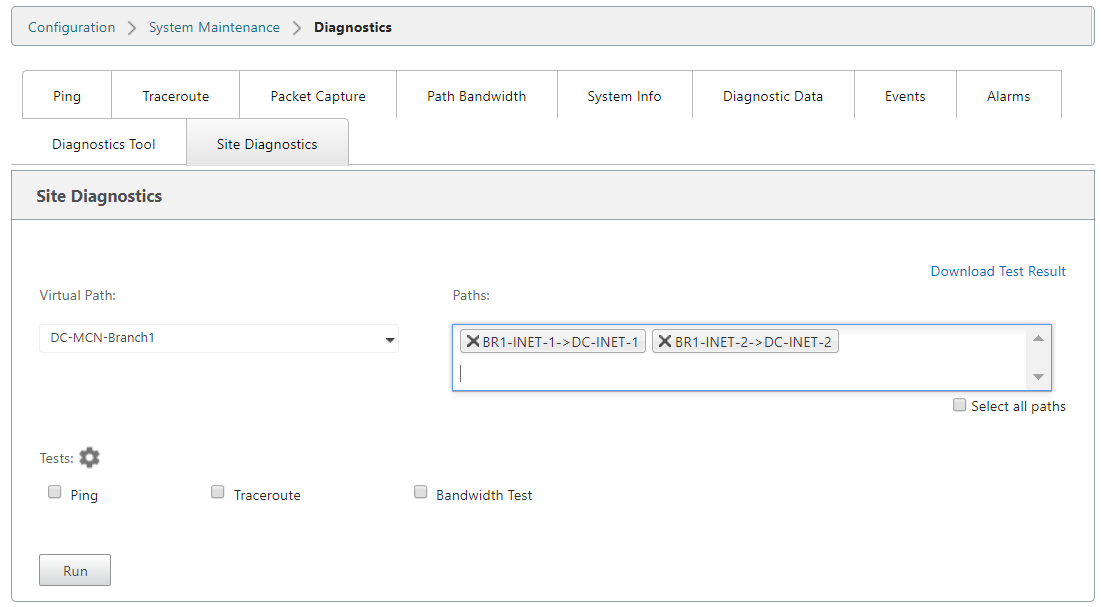
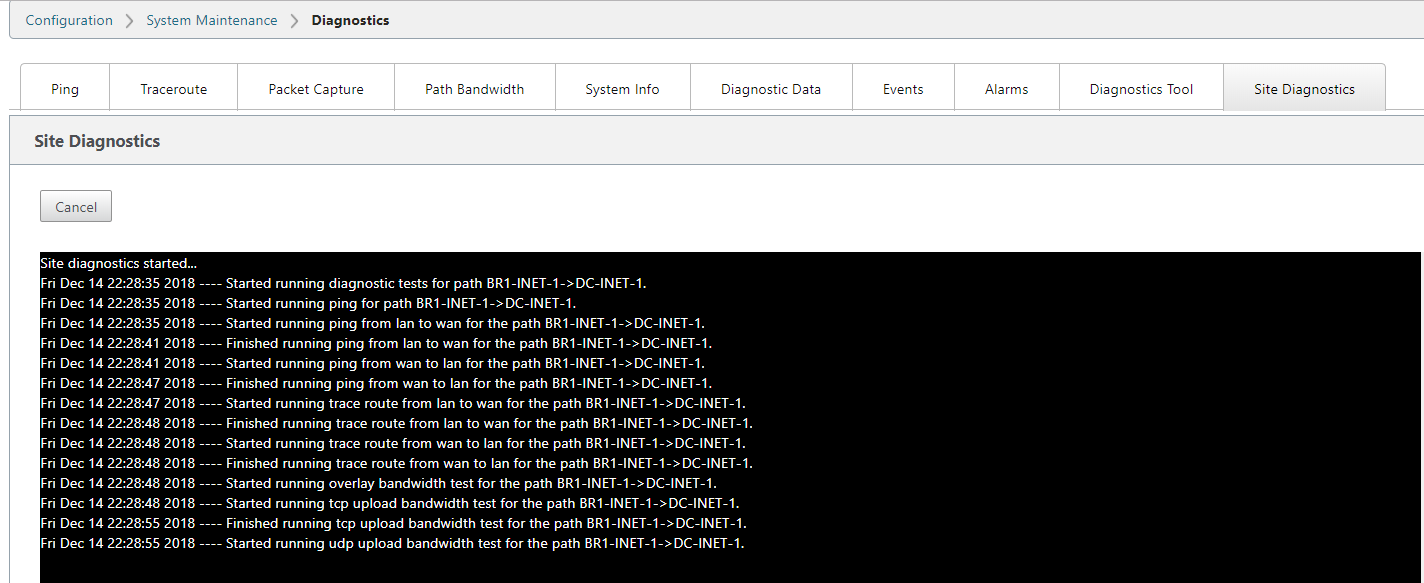
The results page displays the following.
Interface status result:
- Shows the interface status and speeds (configured vs detected).

Path status result:
- Shows the path status, gateway IP, and MTU.

Trace route result:
- There is no difference between the basic traceroute and site diagnostic traceroute options. However, the site diagnostic traceroute helps run multiple tests on a path that gets more insights.

Ping result:
The Basic Ping feature versus the Site diagnostics Ping feature:
- Use quick ping to a destination ip address, which could be a VIP of the remote or another IP reachable through a particular gateway.
- Site Diagnostics ping uses a path if ping is only between source and destination VIPs of the local and remote appliance (Pure SD-WAN endpoints reachability).
- Basic ping allows interface based ping and routing domain based ping where choice of gateway to ping an ip address is present.
- Site Diagnostics is purely only PATH based with no reference to gateway selection. You can Ping a public ip (Internet host) or a private IP (Intranet host).

Bandwidth result:
- Shows bandwidth supported for each of the paths.
- Shows TCP and UDP status.

Use cases for SD-WAN diagnostics
Following are some of the use cases for which you can use the SD-WAN diagnostics feature:
- Link speed incorrectly set in configuration (under-configured or over configured).
- Firewall drops UDP 4980.
- Path down - Remote IP not pingable (NIC down or immediate Next hop down or interim Next Hop Down).
- Test throughput for a particular application with persistence set on a particular path.
- UDP 4980 loss.
- UDP traffic is rate-limited specifically.
- SD-WAN throughput low due to incorrect MPLS QOS Mapping.
- SD-WAN throughput low due to wrong QOS policies on the upstream/adjacent router.
- Path MTU setting is incorrect.
- Public ip learning issues.
- Stale NAT issues.
- QOS/BW provisioning issues.
- PBR per path bandwidth or Incorrectly accounted links (No SD-WAN share provided).
Share
Share
This Preview product documentation is Cloud Software Group Confidential.
You agree to hold this documentation confidential pursuant to the terms of your Cloud Software Group Beta/Tech Preview Agreement.
The development, release and timing of any features or functionality described in the Preview documentation remains at our sole discretion and are subject to change without notice or consultation.
The documentation is for informational purposes only and is not a commitment, promise or legal obligation to deliver any material, code or functionality and should not be relied upon in making Cloud Software Group product purchase decisions.
If you do not agree, select I DO NOT AGREE to exit.