Customer/Network reports
The Customer Reports provide visibility into network-wide alerts, usage trends, inventory, quality, diagnostics, and firewall status aggregated across all the sites in a customer network.
To view the reports, navigate to Partner > Provider > Customer > Reports.
Alerts
The customer can review a detailed report of all the events and alerts generated across all the sites in the network.
It includes the severity, site at which the alert originated, alert message, time, and other details.
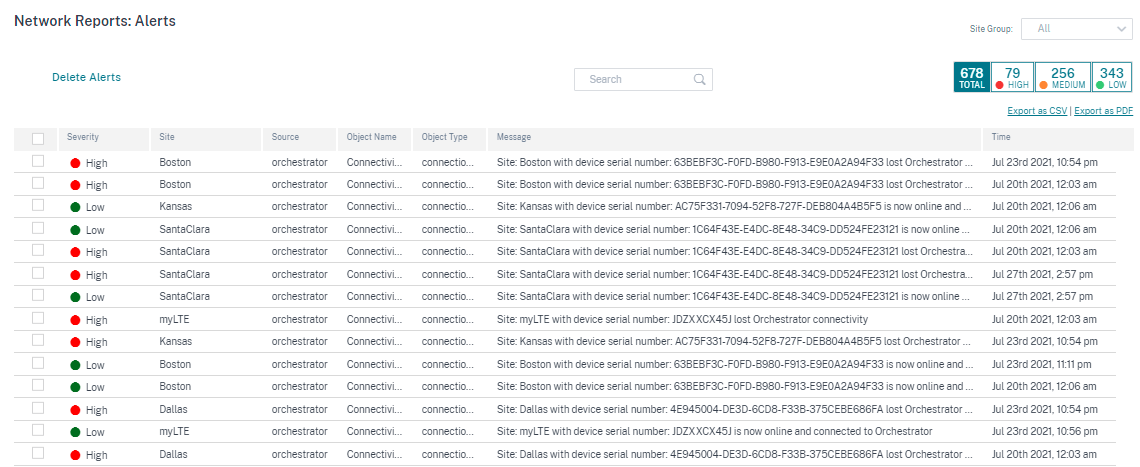
Suitable filtering options can be used as needed for example: Look for all the high severity alerts across all the sites, or all the alerts for a particular site and so on.
You can export the filtered results in to a CSV or PDF file by using the Export as CSV and Export as PDF options. The CSV and PDF file name is prefixed with Alerts List followed by the date and time when the file is exported.
The maximum events that each page can contain is 100. For example, if 9 events are available on the table, all the 9 events are exported to PDF or CSV. However, if more than 100 events are available on the table, you will still be able to export only 100 events each time because of the page capacity.
You can also select and clear alerts.
Security alerts
Edge Security resource alerts
A set amount of system resources such as CPU, Memory, and Hard disk is allocated to the Edge security subsystem. Whenever a resource usage exceeds the set amount, the respective alerts are generated every minute. The following are the Edge security resource alerts:
- Edge security subsystem exceeds typical CPU allotment
- Edge security subsystem exceeds typical Memory allotment
- Edge security subsystem exceeds typical Hard Disk allotment
If one of these alerts is encountered consider revising the Intrusion Prevention settings to exclude low-priority rules and free up resources.
Edge Security system alert
The following Edge Security system alerts are generated:
- State changed to UP: When the Edge Security processing state is changed to UP.
- State changed to DOWN: When the Edge Security processing state is changed to DOWN.
- State changed to DISABLED: When the Edge Security is disabled.
- Policies are configured but service is not initialized: When the Edge Security is not initialized but INSPECT policies are configured.
Wi-Fi alerts
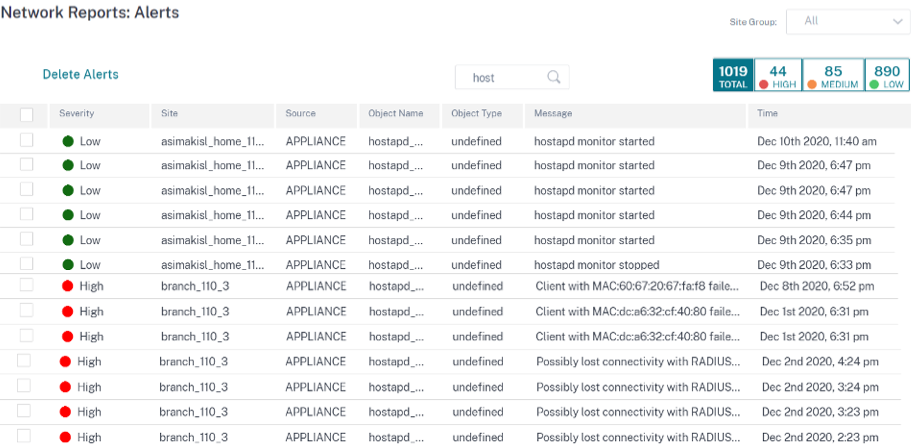
The customer can review a detailed report of all Wi-Fi events and alerts generated across all the sites in the network. It includes the severity, site at which the alert originated, alert message, time, and other details. To view the Wi-Fi alerts, at the network level, navigate to Reports > Alerts and search for hostapd.
The following Wi-Fi alerts are generated:
-
hostapd monitor started: When the Wi-Fi service starts. -
hostapd monitor stopped: When the Wi-Fi service stops. -
Client with MAC:<MAC> failed to authenticate with RADIUS on SSID:<SSID>: When a client fails to get authenticated using WPA2 Enterprise security protocol. -
Client with MAC:<MAC> failed to authenticate on SSID:<SSID>: When a client fails to get authenticated using WPA2 Personal security protocol. -
Possibly lost connectivity with RADIUS <IP>:<Port> on SSID:<SSID>: When network connectivity with the RADIUS server is lost. -
RADIUS bad authenticators on SSID:<SSID>: When bad authenticators are received from a RADIUS server. -
RADIUS malformed packets on SSID:<SSID>: When malformed packets are received from a RADIUS server.
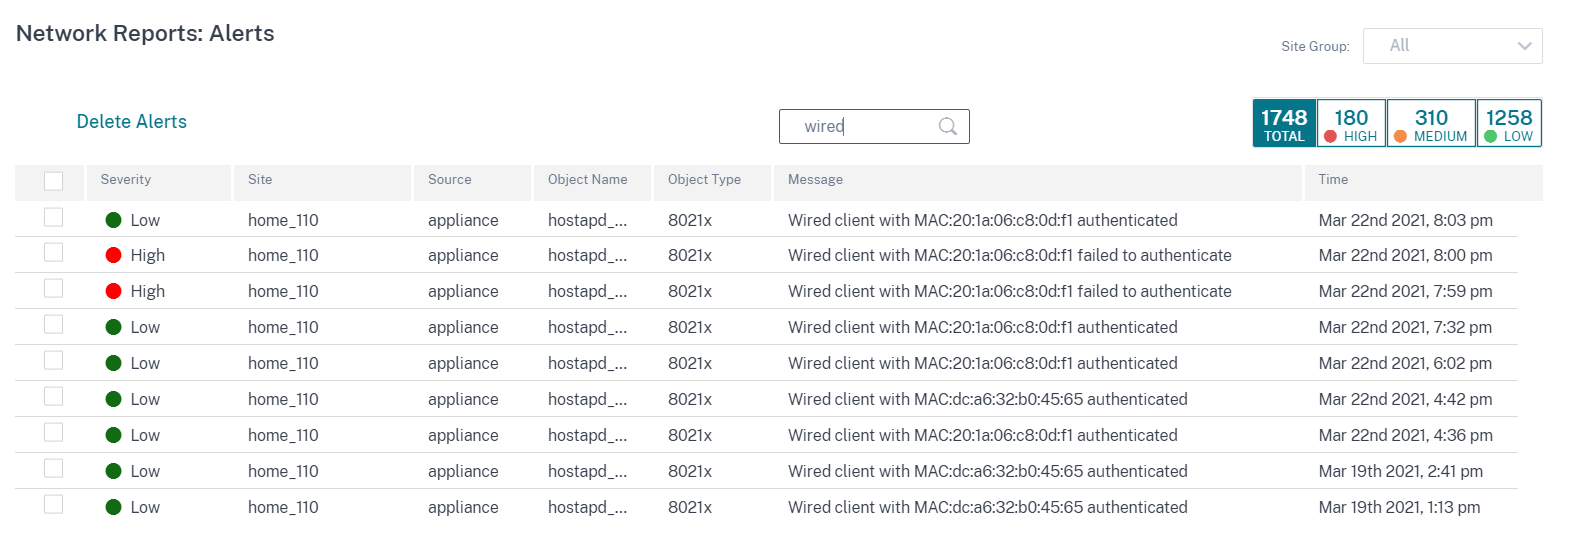
Wired 802.1X alerts
The customers can view a detailed report of all the unique wired 802.1X authentication attempts across all the sites in the network. In 90 seconds, a client can try as many authentications attempts as possible. All the attempts create the following alerts. The alerts include the severity, site at which the alert originated, alert message, time, and other details. To view the wired 802.1X alerts, at the network level, navigate to Reports > Alerts and search for wired.
- Wired client with MAC
<mac address>authenticated: When the authentication attempt is successful. - Wired client with MAC
<mac address>failed to authenticate: When the authentication attempt has failed.
Usage
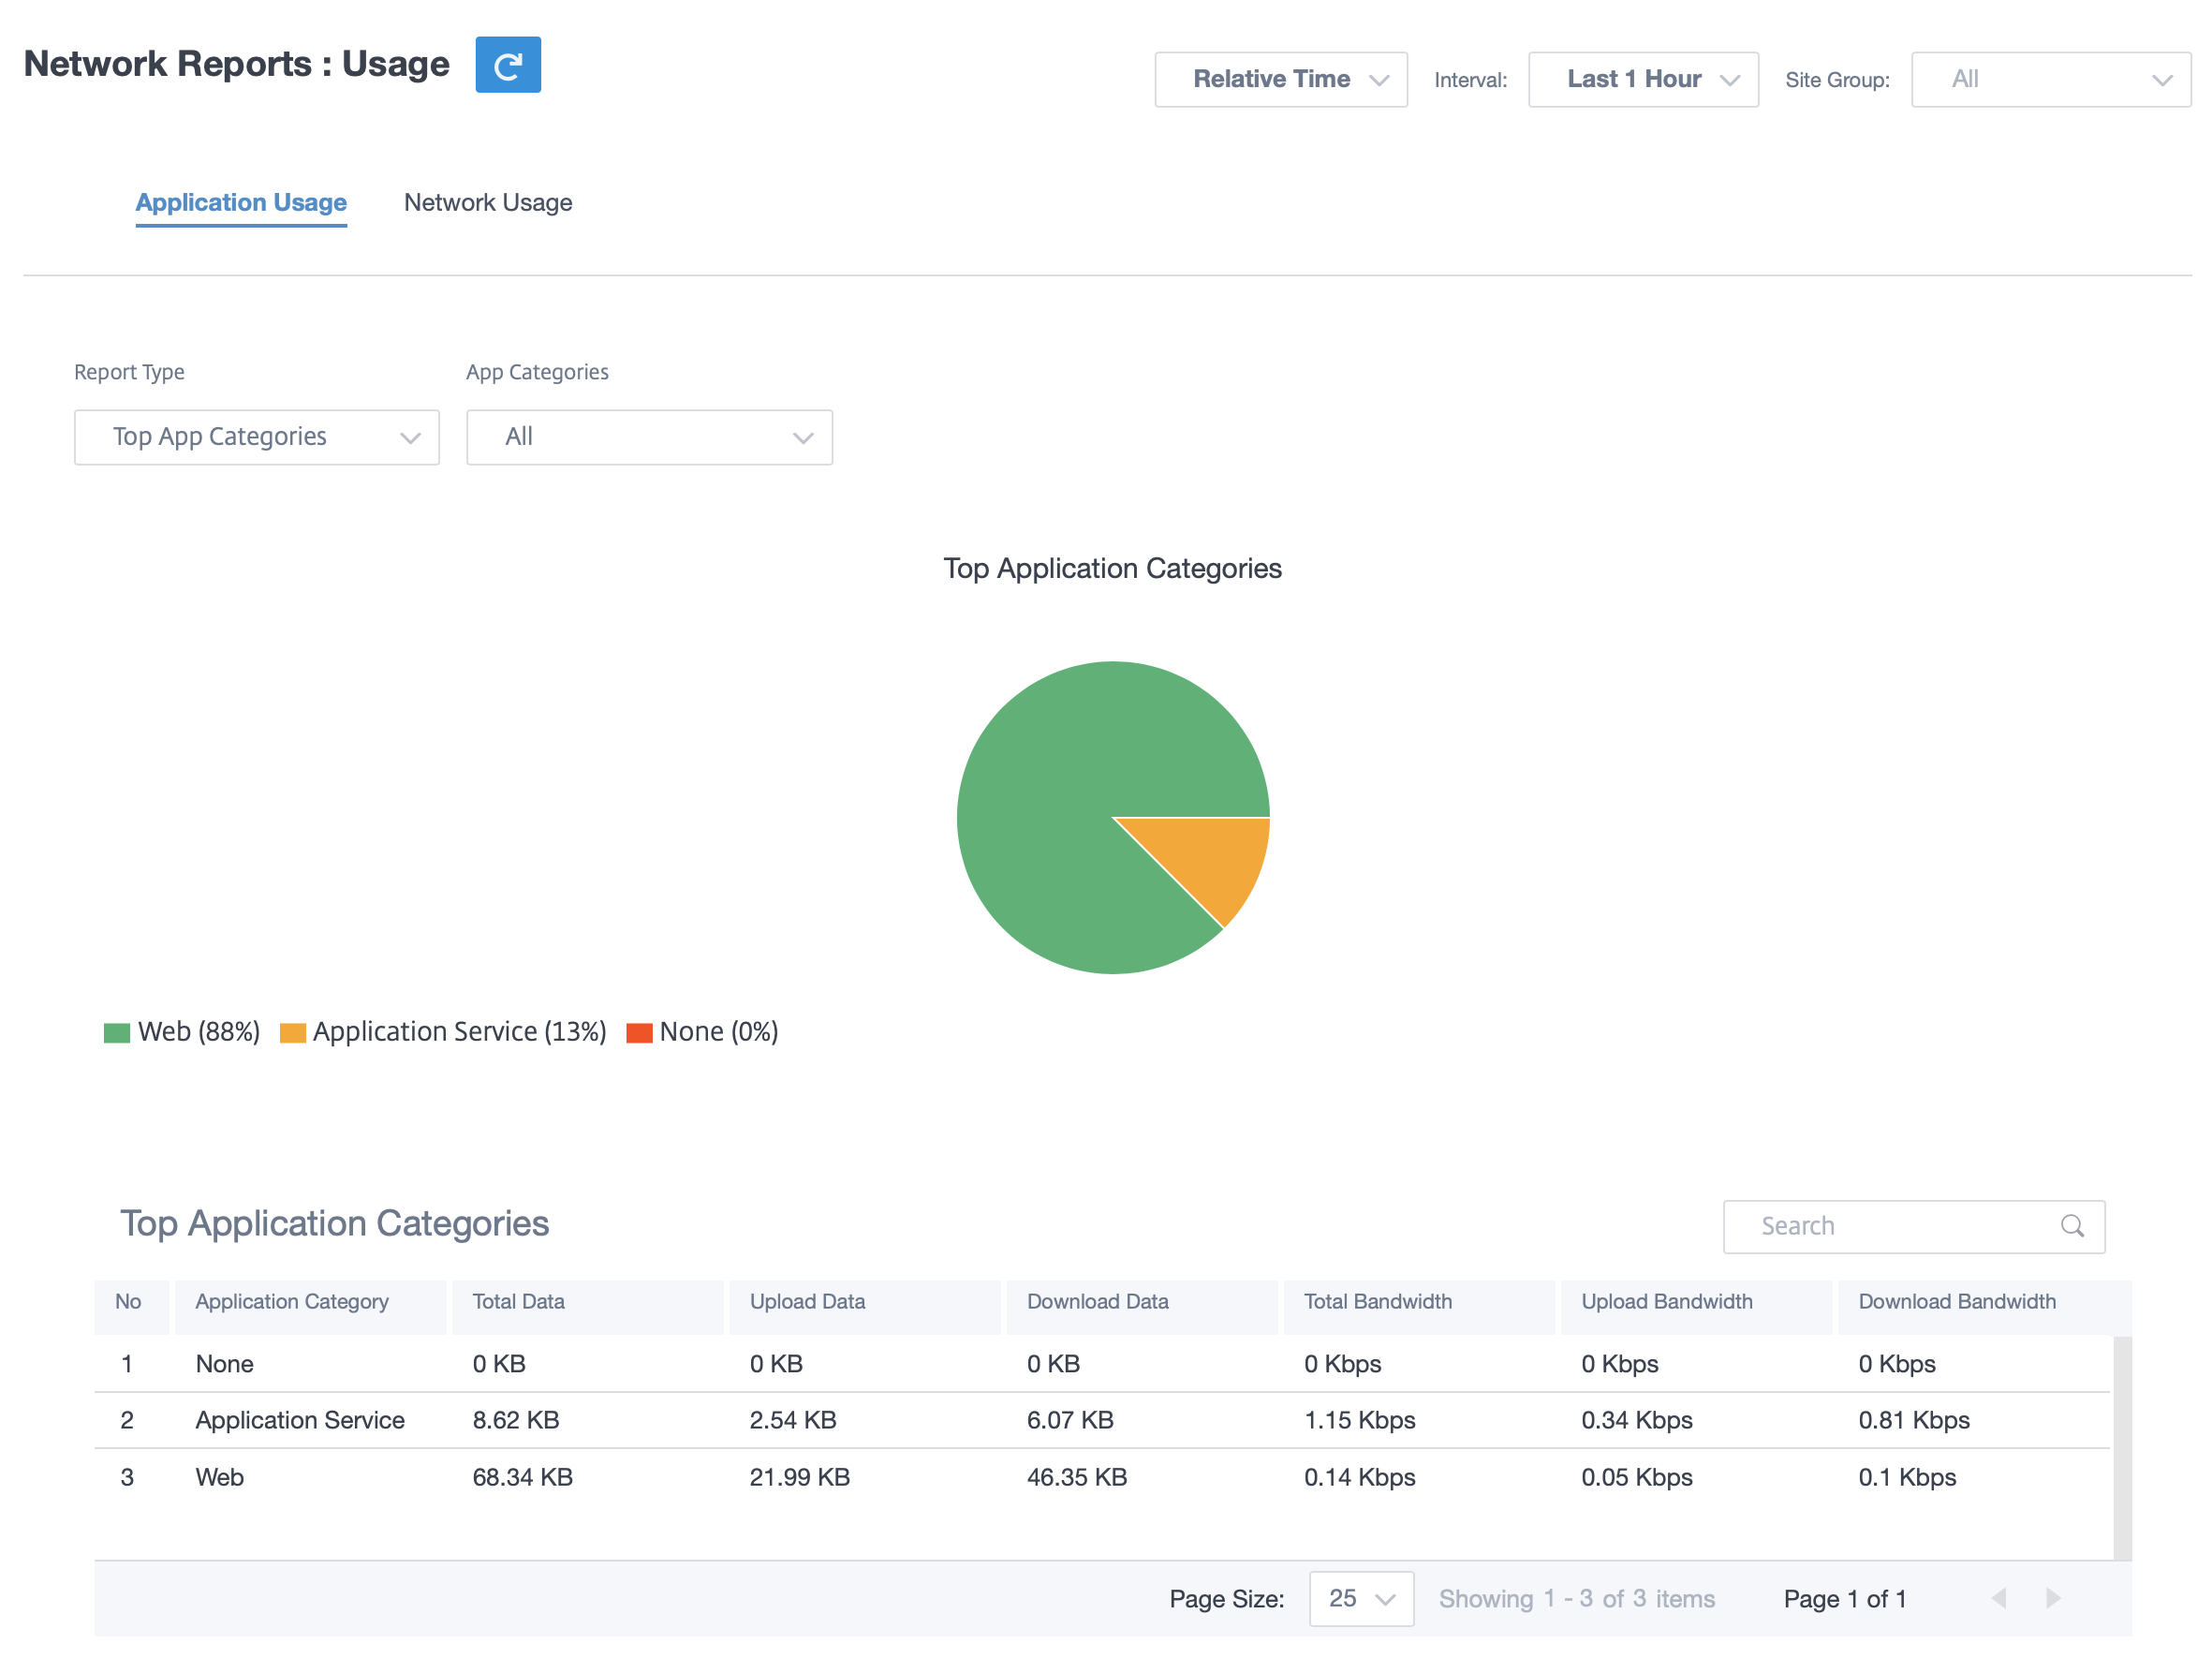
Customers can review usage trends such as Top Applications, Top Application Categories, App Bandwidth, and Top Sites across all the sites in their network.
Top application and application categories
The Top Applications and Top Application Categories chart shows the top applications and top application families that are widely used across all the sites. This allows you to analyze the data consumption pattern and reassign the bandwidth limit for each class of data within the network.
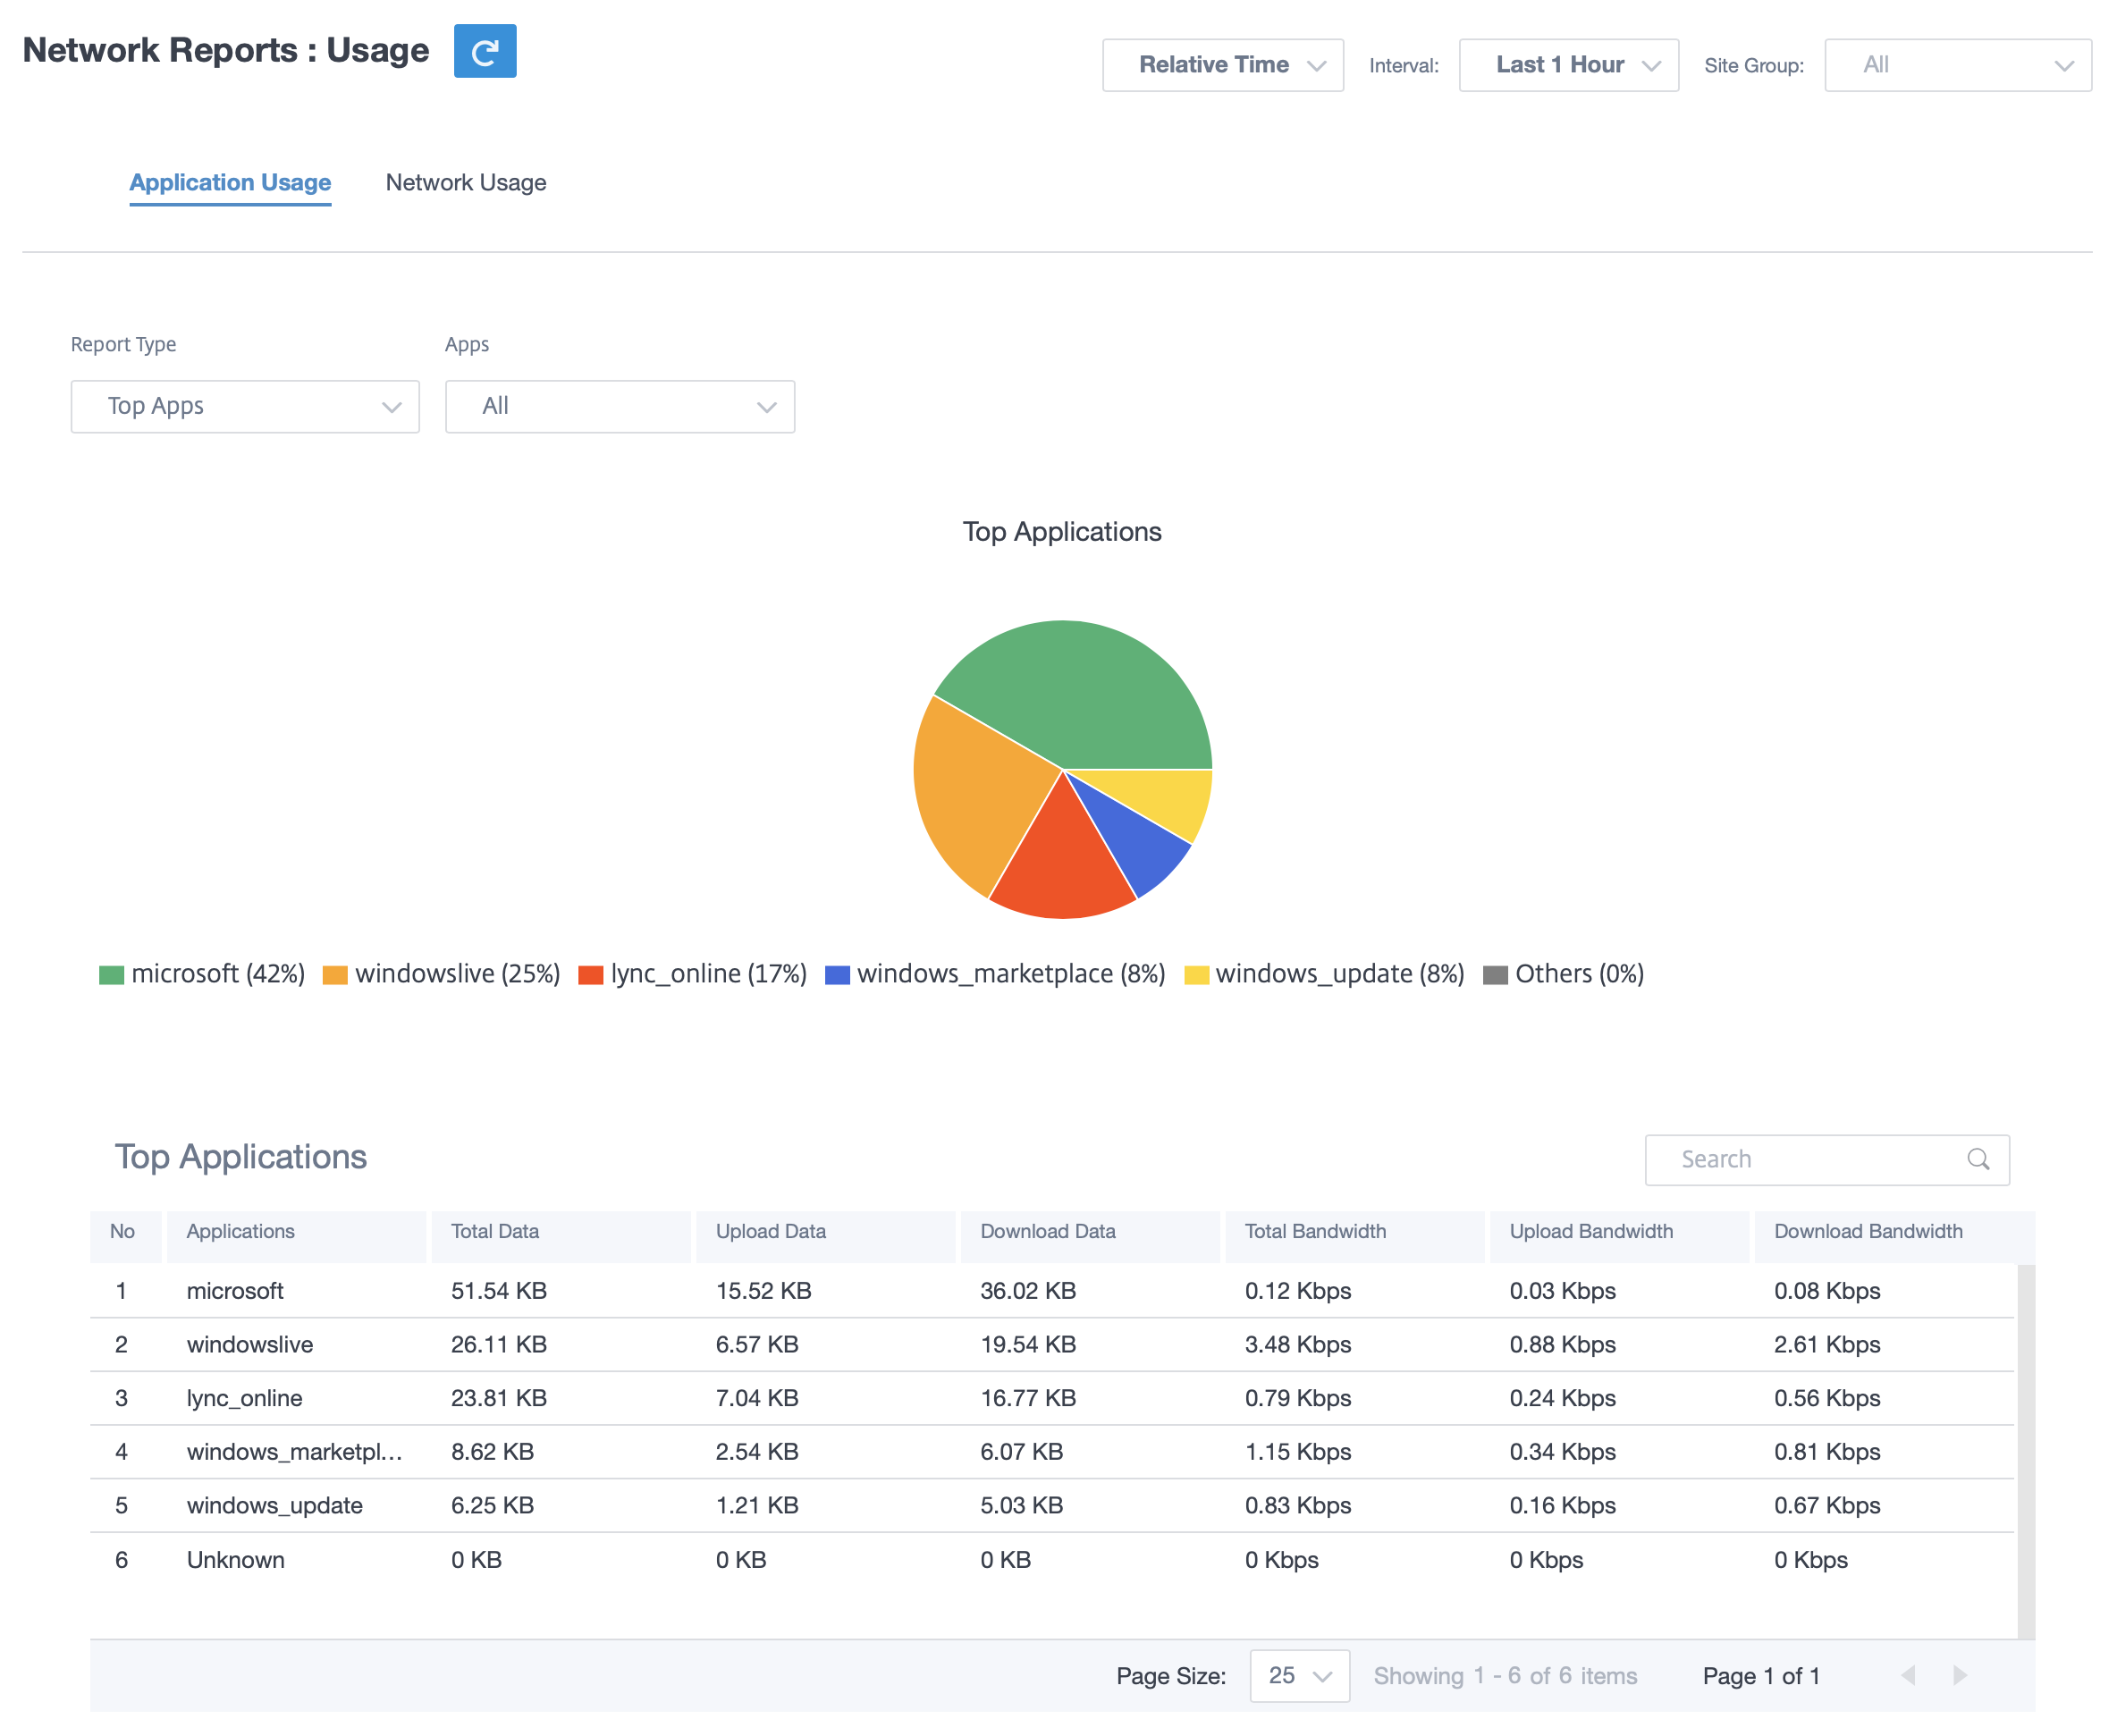
Application bandwidth
You can view the bandwidth usage statistics for the selected site group or for all sites. The bandwidth statistics are collected for the selected time interval. You can filter the statistics report based on the Report Type, Apps or Apps Categories, and Metrics.
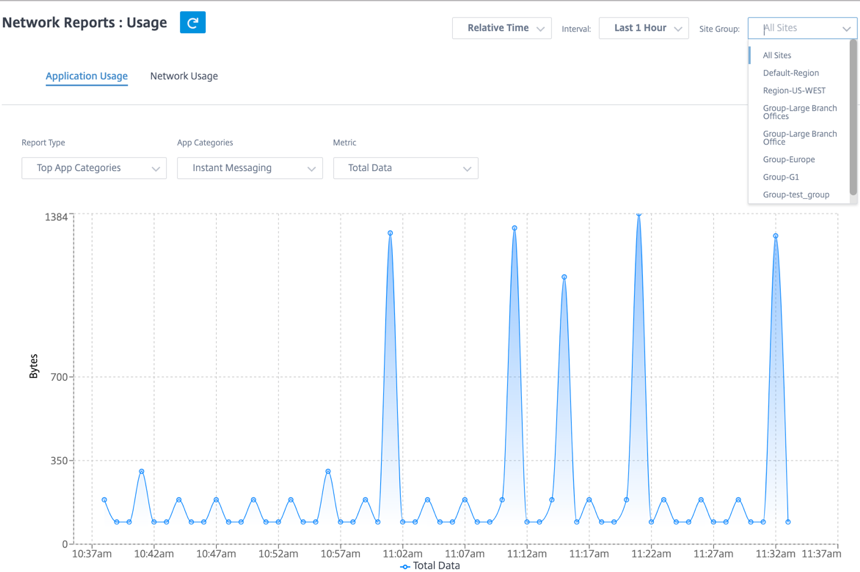
- Report Type: Select Top App or App Categories from the list.
- Apps/App Categories: Select top application or categories from the list.
- Metric: Select the bandwidth metric (such as Total Data, Incoming Data, Total Bandwidth) from the list.
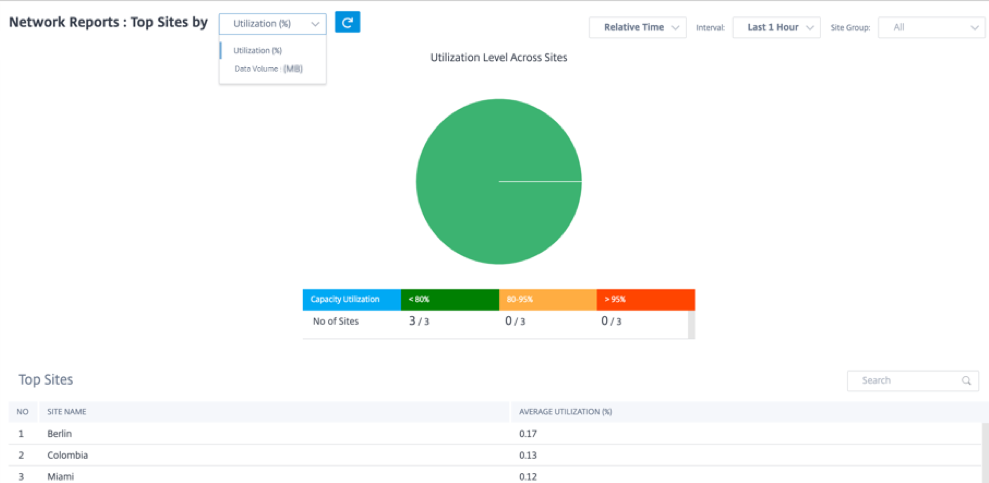
Network usage
The Top Sites chart depicts the top sites in the customer network that have the highest bandwidth usage. You can view the Sites by Utilization (%) or Data Volume (MB).
Wi-Fi
Citrix SD-WAN Orchestrator service allows you to view the Wi-Fi summary reports. It provides an overview of the number of devices connected to Wi-Fi networks and the Wi-Fi data used within your network.
To view a Wi-Fi report, at the network level, navigate to Reports > Wi-Fi.
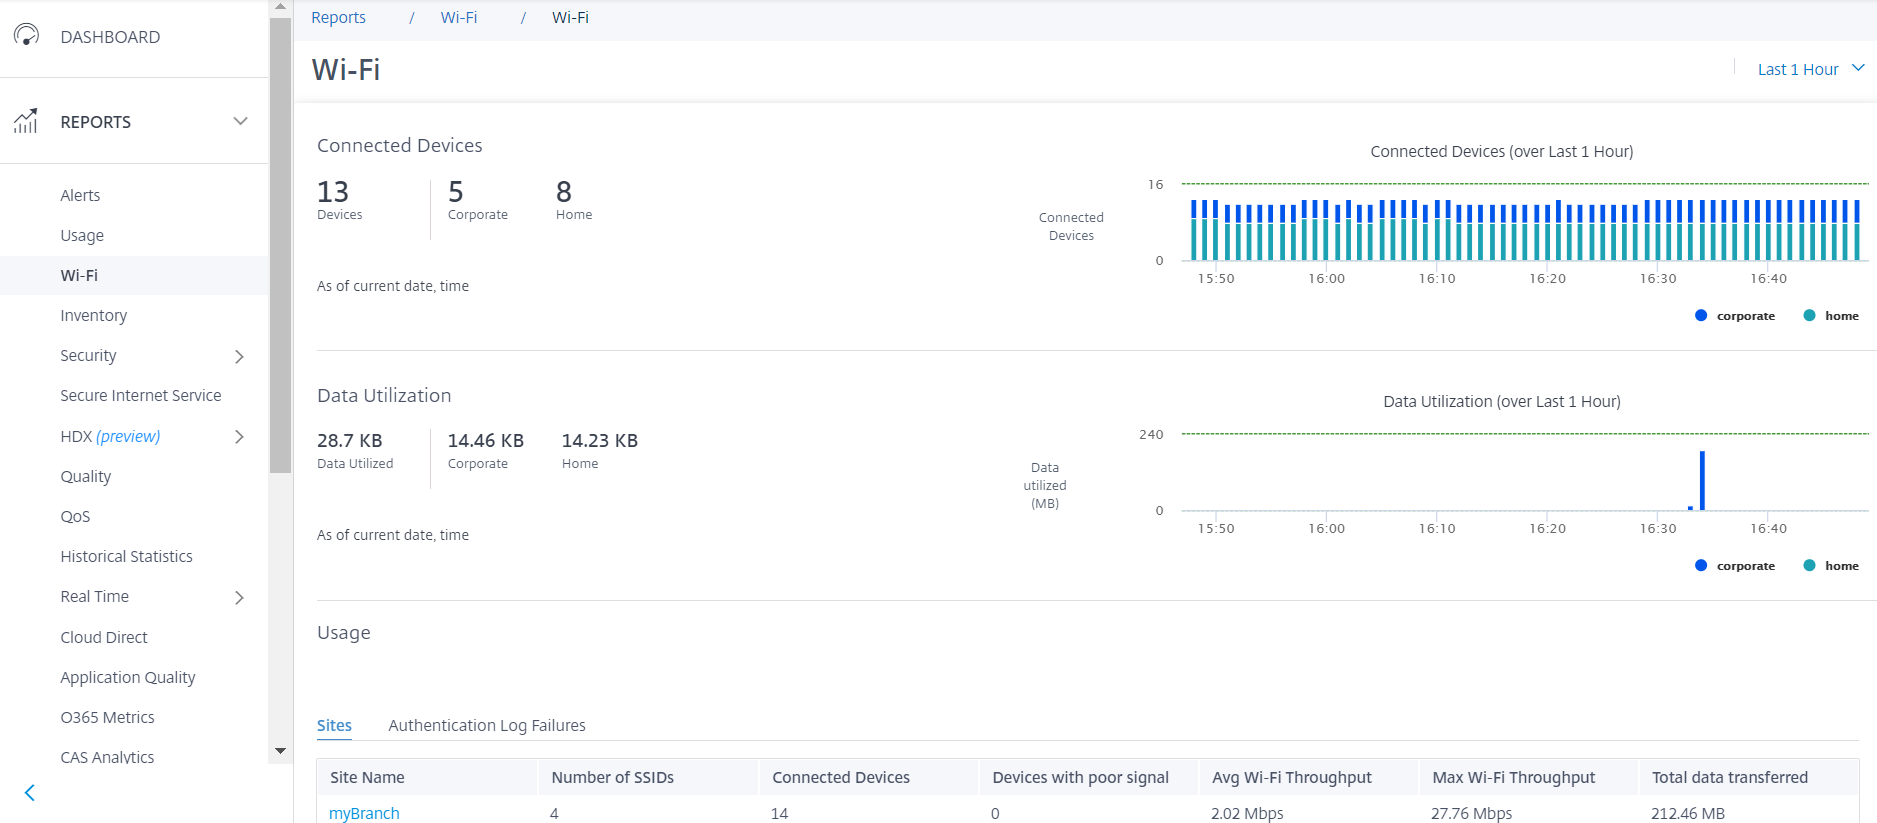
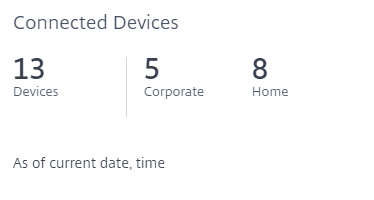
Connected devices
The Connected devices section displays the total number of devices, in your network, that are currently connected to Wi-Fi. You can also see the number of appliances connected to the corporate network or home network based on the SSID it is connected to.
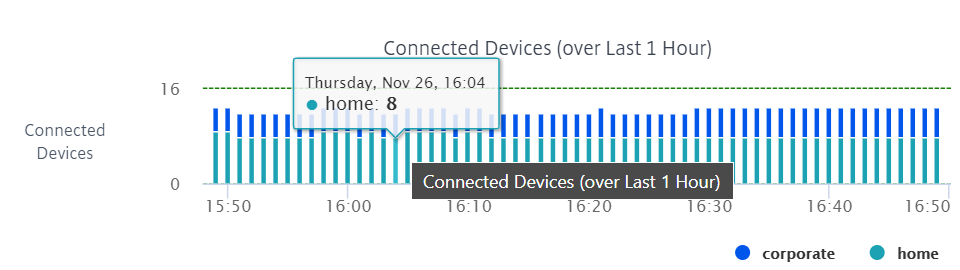
You can also select the timeline to view a graphical representation of the historic data. The graph shows the number of corporate and home devices connected over the selected period. Hover the mouse over a bar to view the exact number of devices connected to corporate and home networks at specific time.
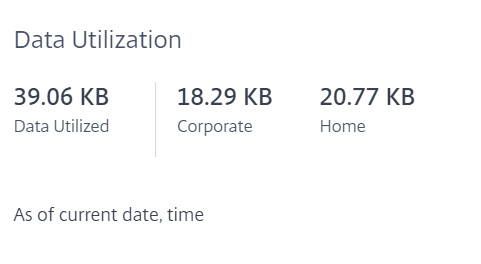
Data utilization
The Data utilization section displays the total amount of Wi-Fi data used by the connected appliances at the current moment. You can also view the data used by devices connected to the corporate or home network.
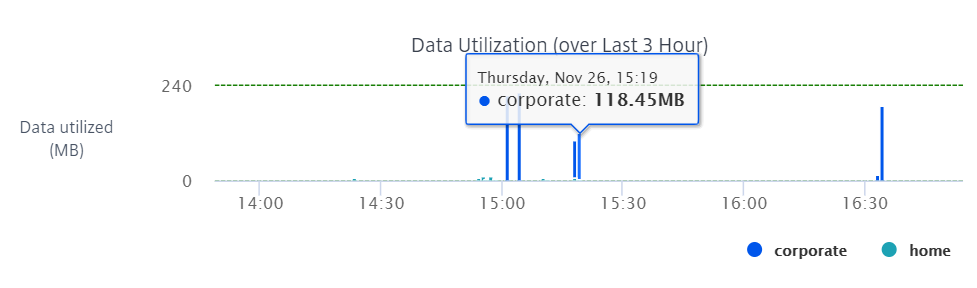
You can also select the timeline to view a graphical representation of the historic data. The graph shows the amount of data used by the corporate and home devices over the selected period. Hover the mouse over a bar to view the exact data utilization of the corporate and home network users at specific time.
Usage
The usage table is a leaderboard that lists the top five Wi-Fi sites and Wi-Fi authentication failure logs in your network.
Sites
The Sites table lists the top five Wi-Fi sites in your network based on the parameters such as average Wi-Fi throughput, maximum Wi-Fi throughput, total data transferred, and devices with poor signal. Click the parameter header to sort the column in descending order.
The network administrator can use this information to identify and troubleshoot issues in the network. For example, you can identify the sites with the most number of devices with poor signal and try to resolve the issue on the SD-WAN appliance at that site.
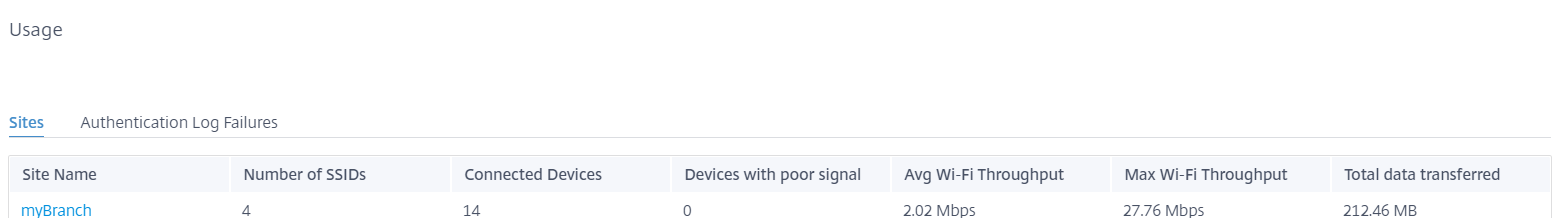
Click View more to view the Wi-Fi details for all the sites in the network. You can select the period or search the list by site name.
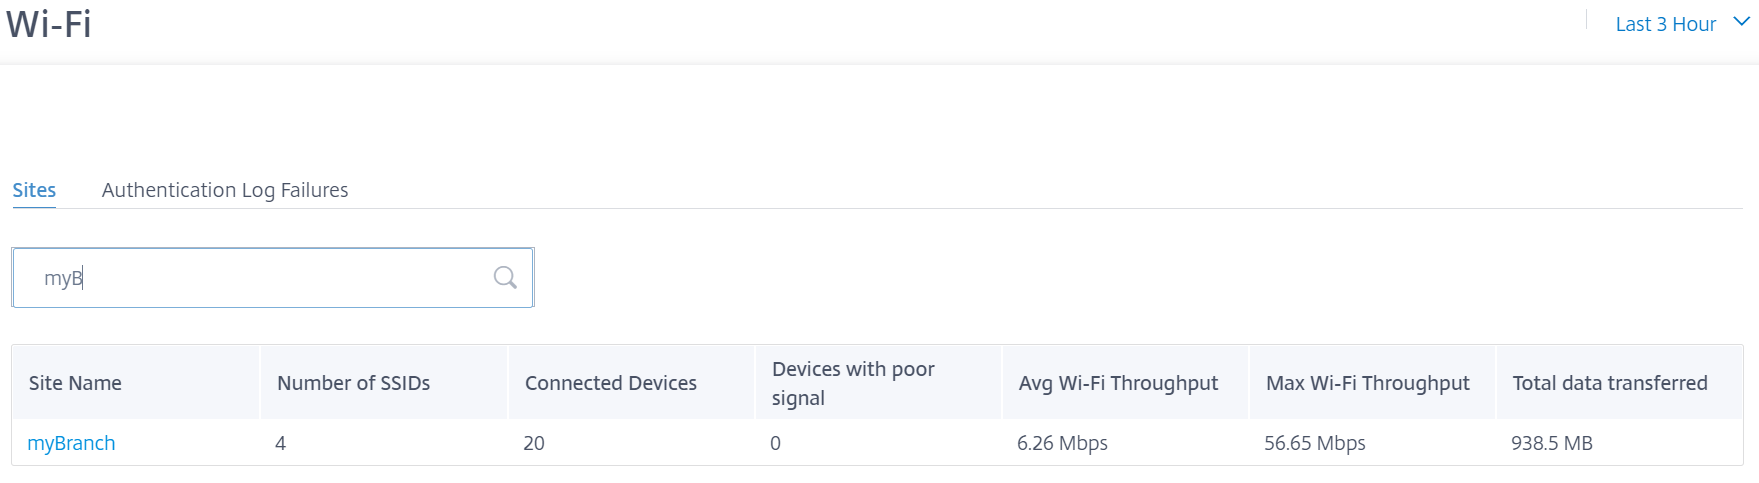
Click a site name to view site level Wi-Fi reports. For more information, see Site Wi-Fi reports.
Authentication failure logs
The authentication failure logs table displays the recent five authentication failures to the Wi-Fi network. You can view the site name, MAC address and IP address of the clients that are trying to connect to specific SSID along with authentication failure time.
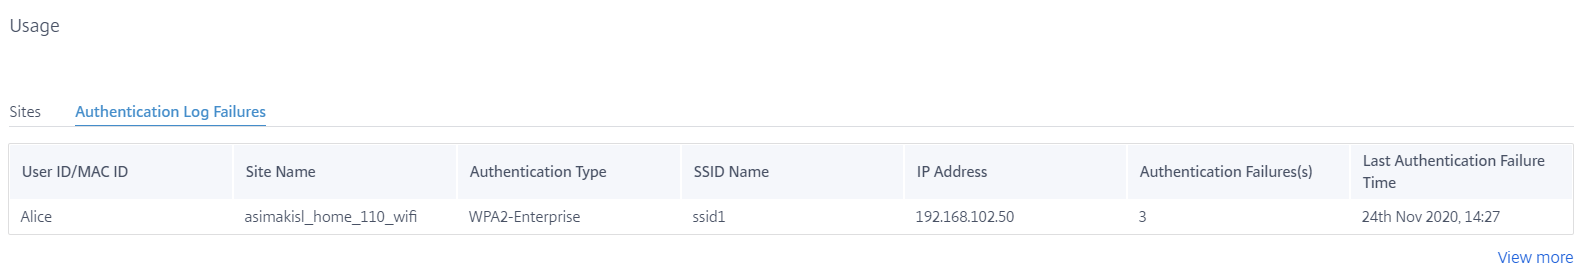
Click View more to view all the authentication failure logs. You can select the period or search the list by site name.
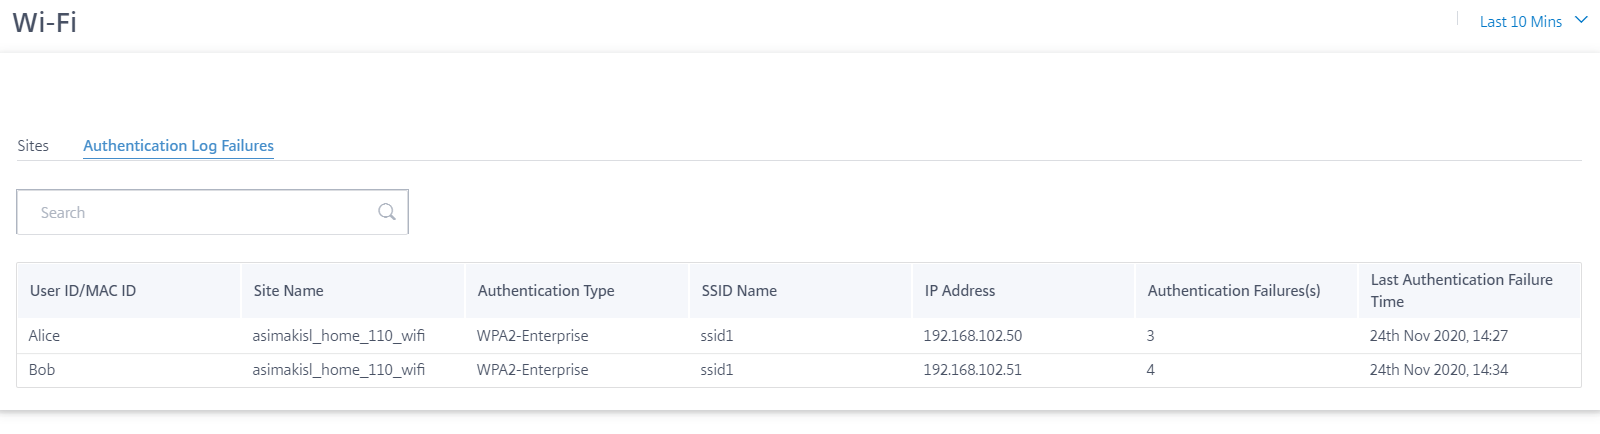
Click a site name to view site level authentication failure logs. For more information, see Site Wi-Fi reports.
Inventory
The customer can view the entire device inventory across all the sites in the network. You can choose to view an inventory summary or a detailed view.
The inventory summary view provides a chart of the inventory spread, depicting the various appliance models and the number of each type of appliances used across all sites in the customer network.
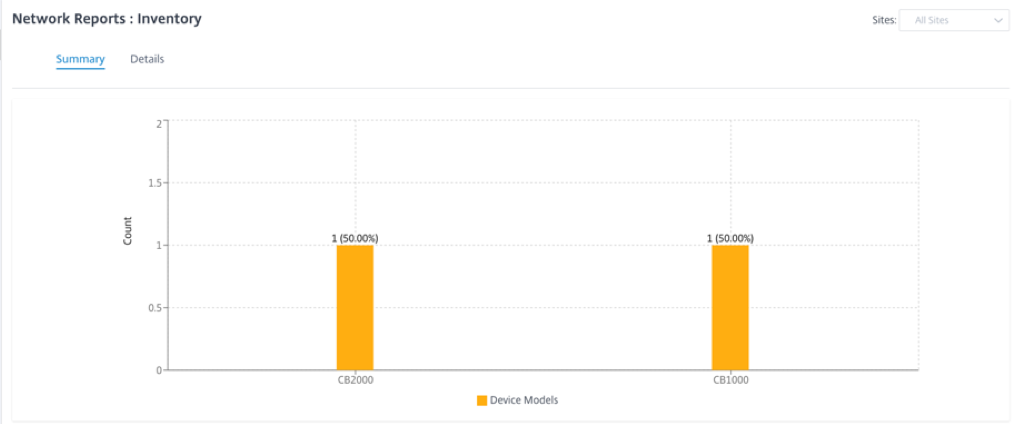
Suitable filtering options can be used as needed for example: Look for all appliances belonging to a specific site, or all appliances with a certain device model and so on
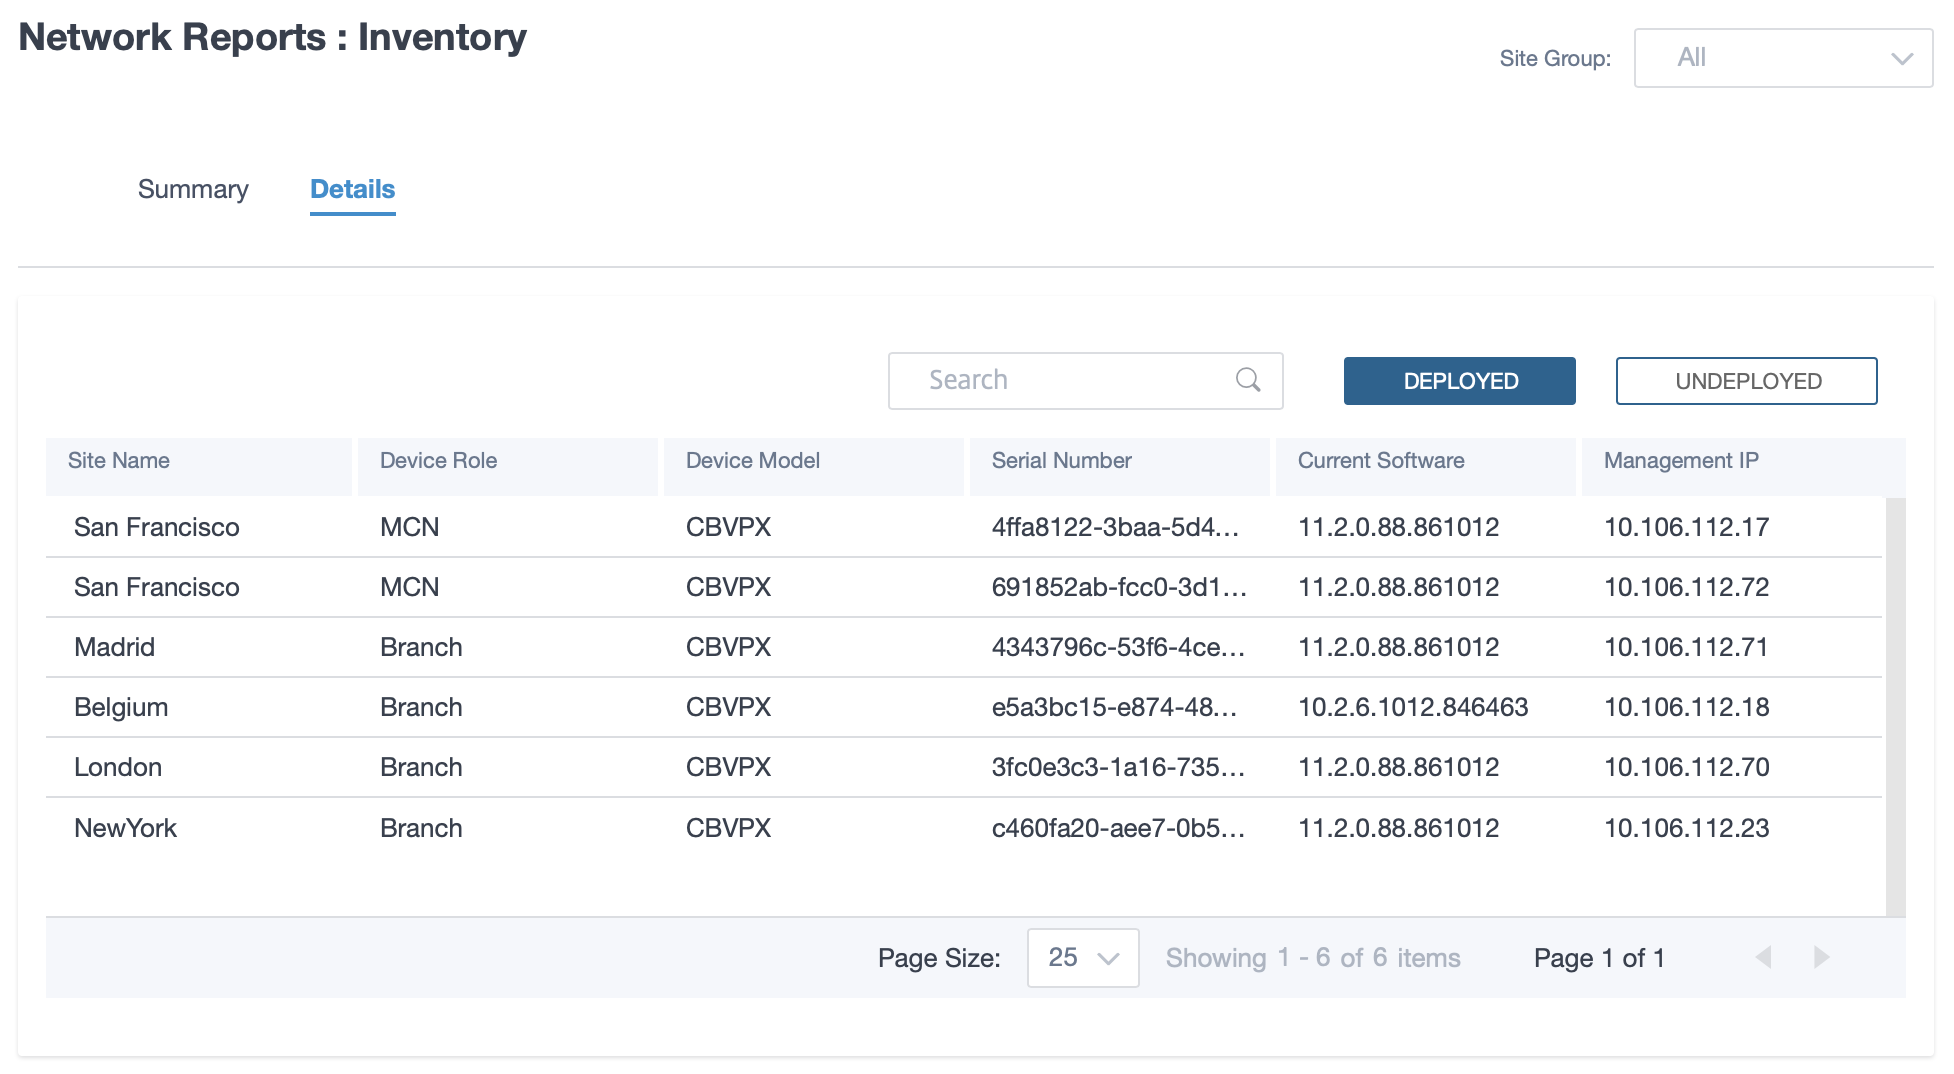
The inventory detailed view provides a list of all the appliances that are deployed and those appliances that are configured but not deployed yet. Along with the customer, site name, device role, device serial number, current software, and device management IP address.
Security reports
Citrix SD-WAN Orchestrator service allows you to view summary reports for the Web filtering, Anti-Malware, and Intrusion Prevention security features. You can view the reports for the last 5 mins, 10 mins, 30 mins, 1 hr., 3 hr., day, week, or month.
Web filtering
To view the web filtering report, at the network level navigate to Reports > Security > Web Filtering and select the timeline for which you want to view the report.
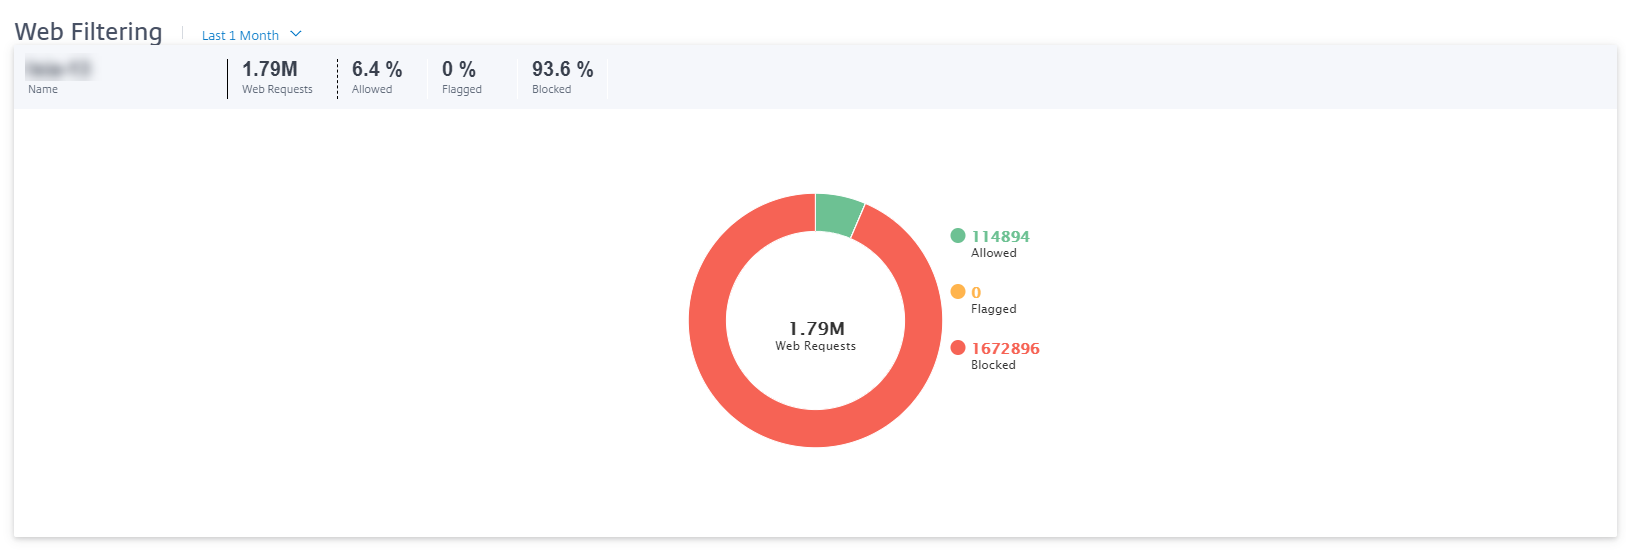
The Web Filtering Distribution section displays the following information:
- Total number of web requests.
- Percentage of web requests allowed.
- Percentage of web requests that were flagged but not blocked.
- Percentage of web requests blocked.
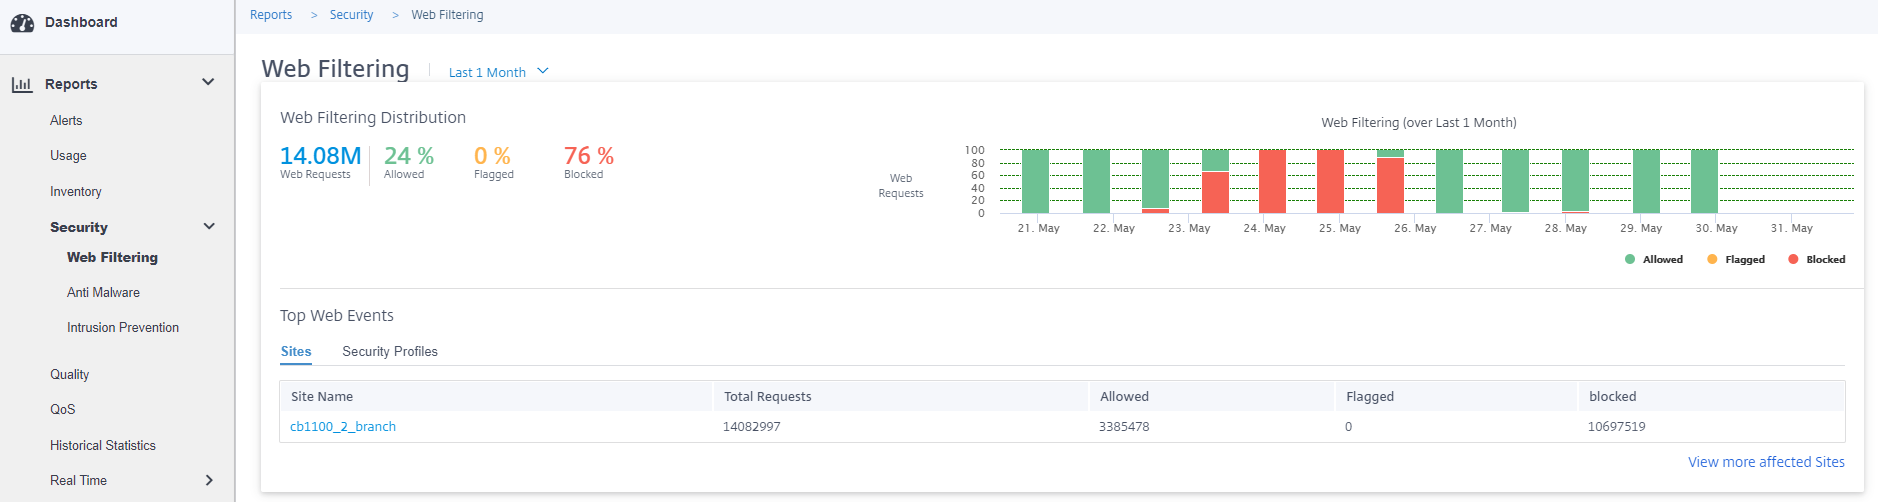
You can also view a graphical representation of the percentage of web requests allowed, flagged, and blocked over the selected time frame.
Top web events
The Top Web Events table provides web filtering details of the top 5 network sites and security profiles.
Sites:
It displays the total number of requests, the number of requests allowed, the number of requests flagged, and the number of requests blocked at the top 5 sites.
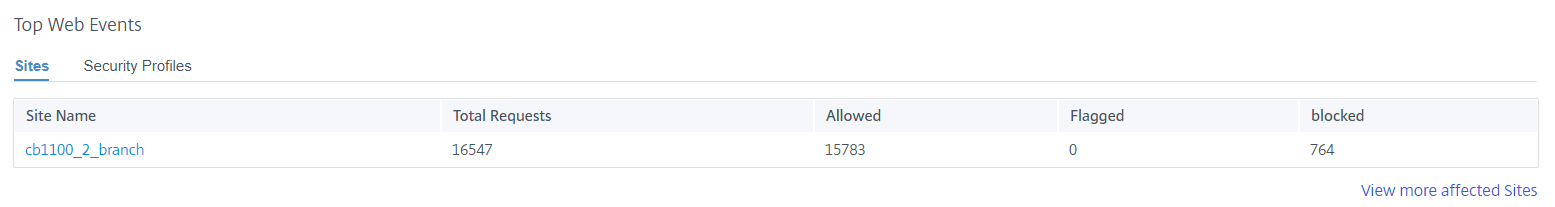
Click View more affected Sites, to view the web filtering details of all the affected sites in the network.
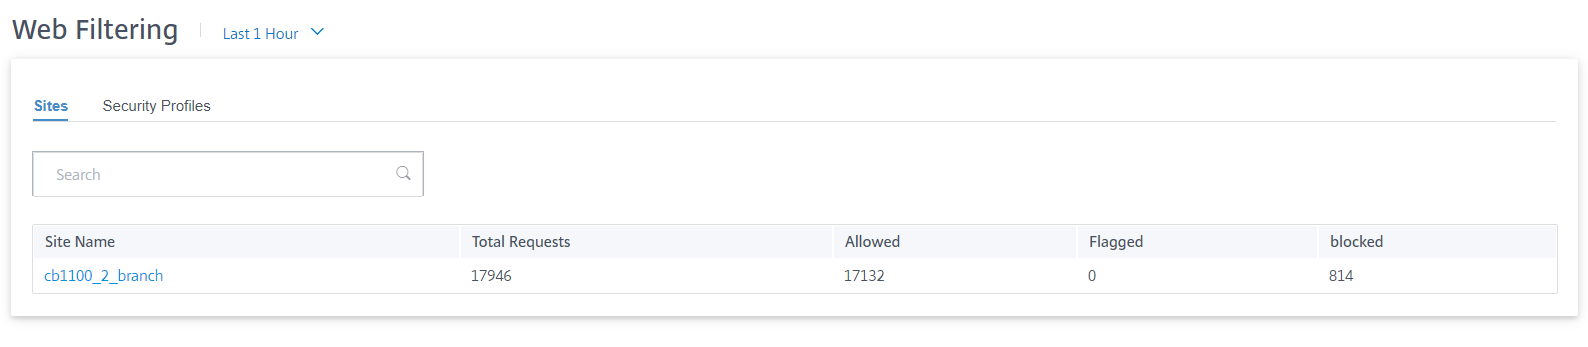
Click an individual site name to view a graphical representation of the web filter details at the site. The Web Filtering of the chosen site also provides the real-time report of the last 1000 web (HTTP, HTTPS) events from the total number of the web requests (for the selected timeline).
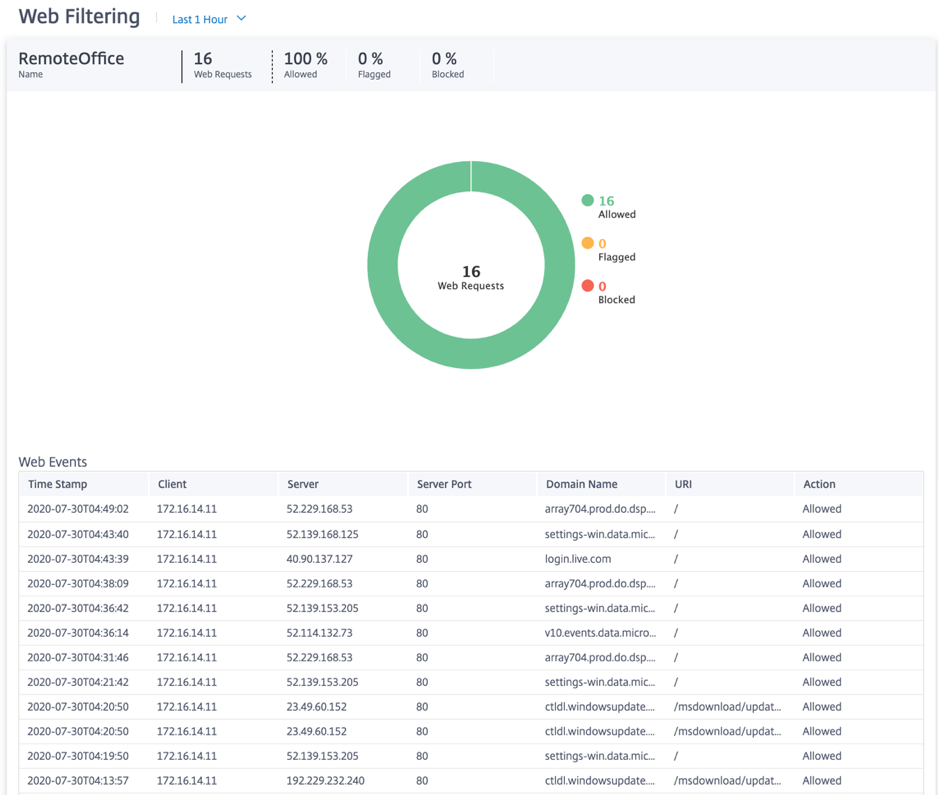
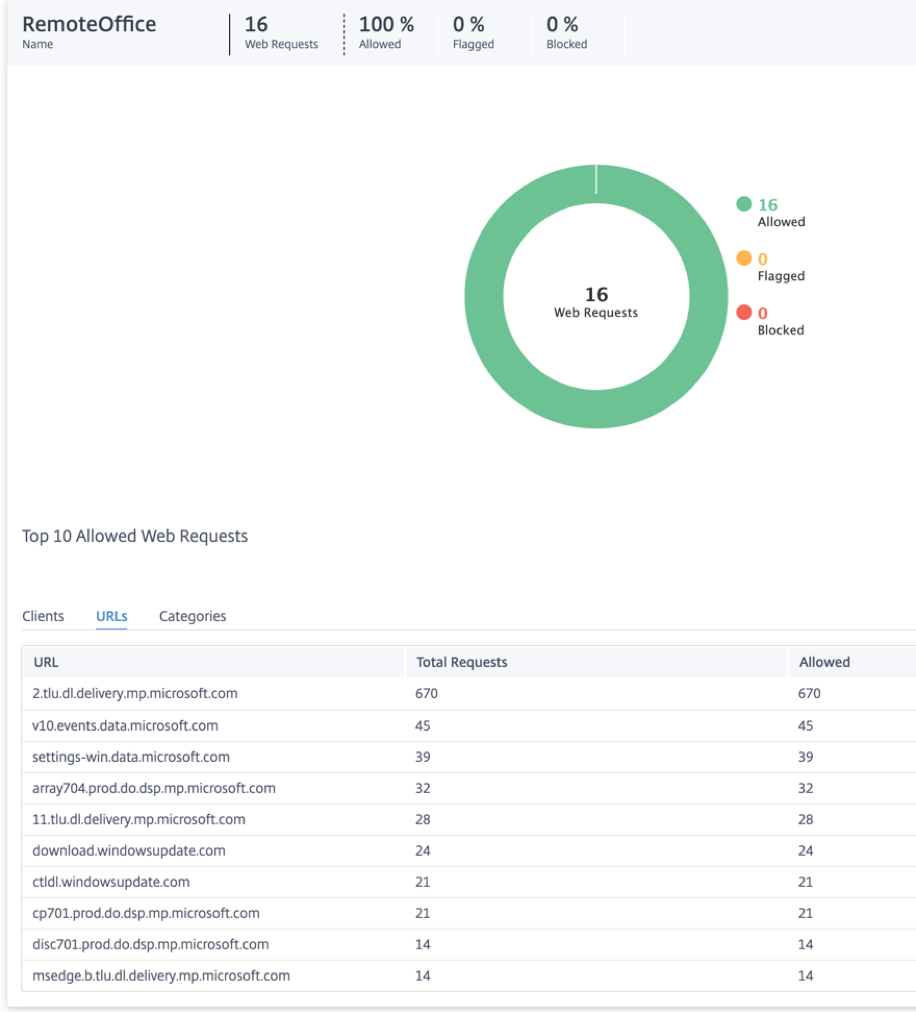
You can click the individual slices of the pie chart (demarcated by the color) or the legends beside the pie chart to view the top-10 allowed, flagged, and blocked web request details for clients, URLs, and categories.
Security profiles:
It displays the total number of requests, the number of requests allowed, the number of requests flagged, and the number of requests blocked by the top 5 Security profiles.
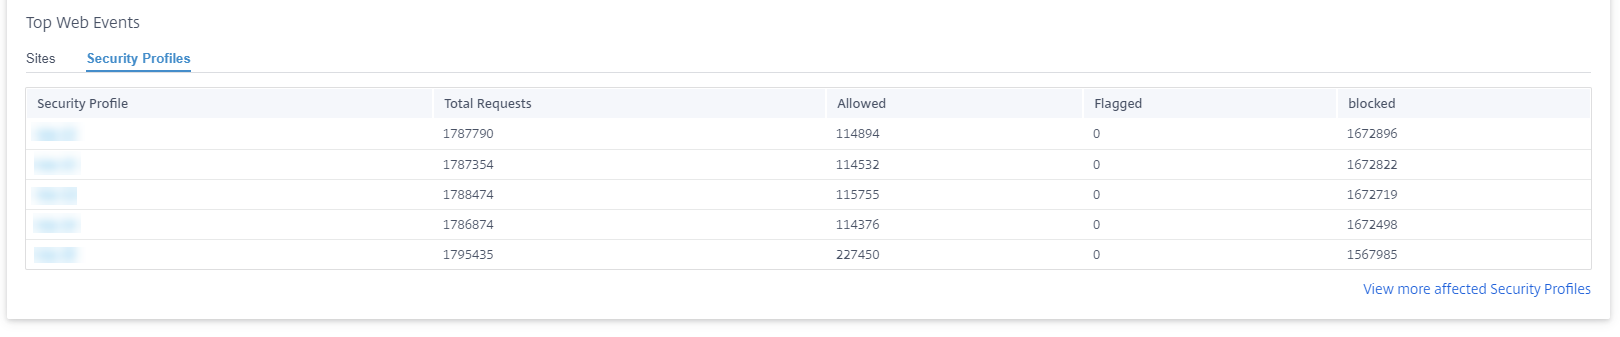
Click View more affected Security Profiles, to view the web filtering details of all the security profiles.
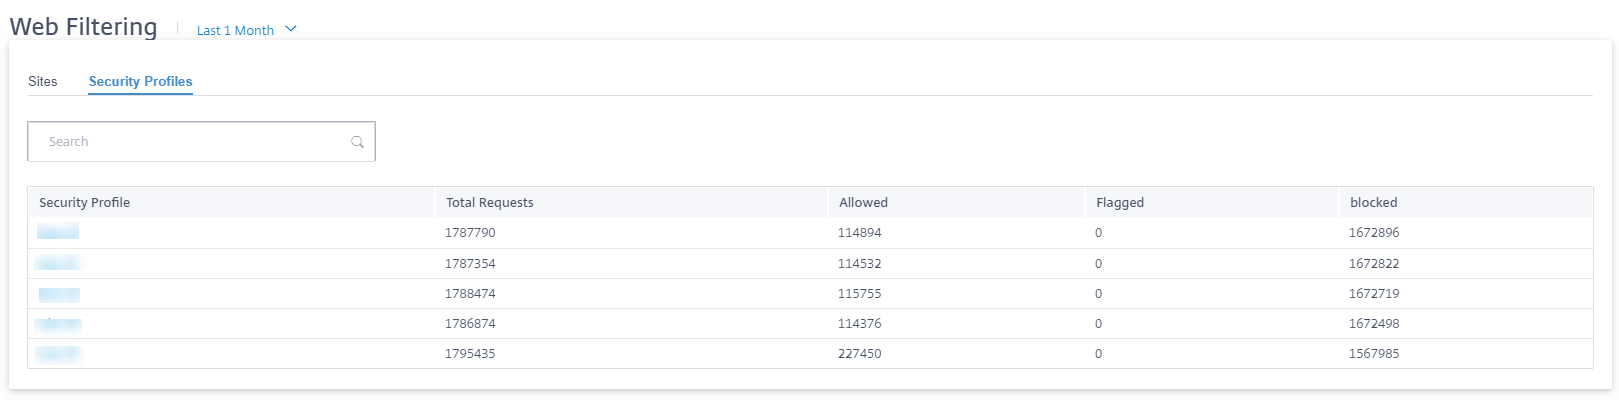
Click an individual Security profile name to view a graphical representation of its web filter details.
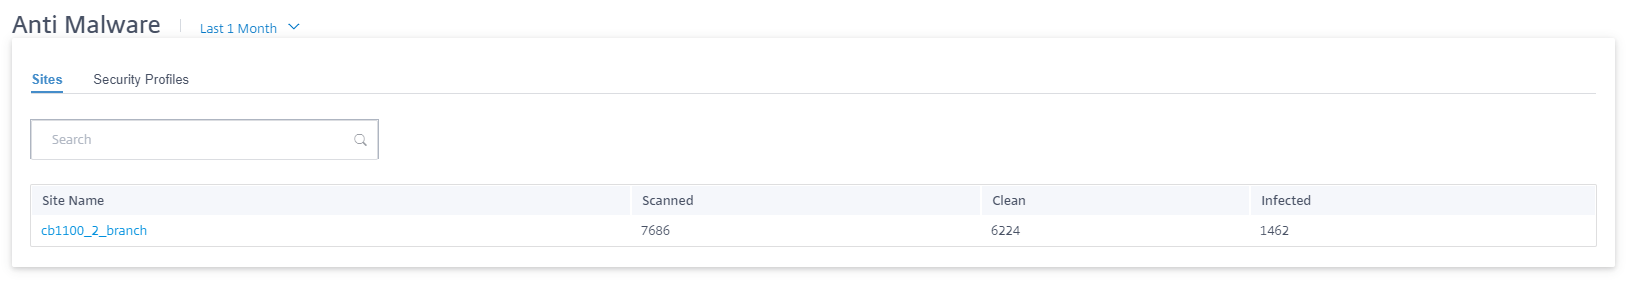
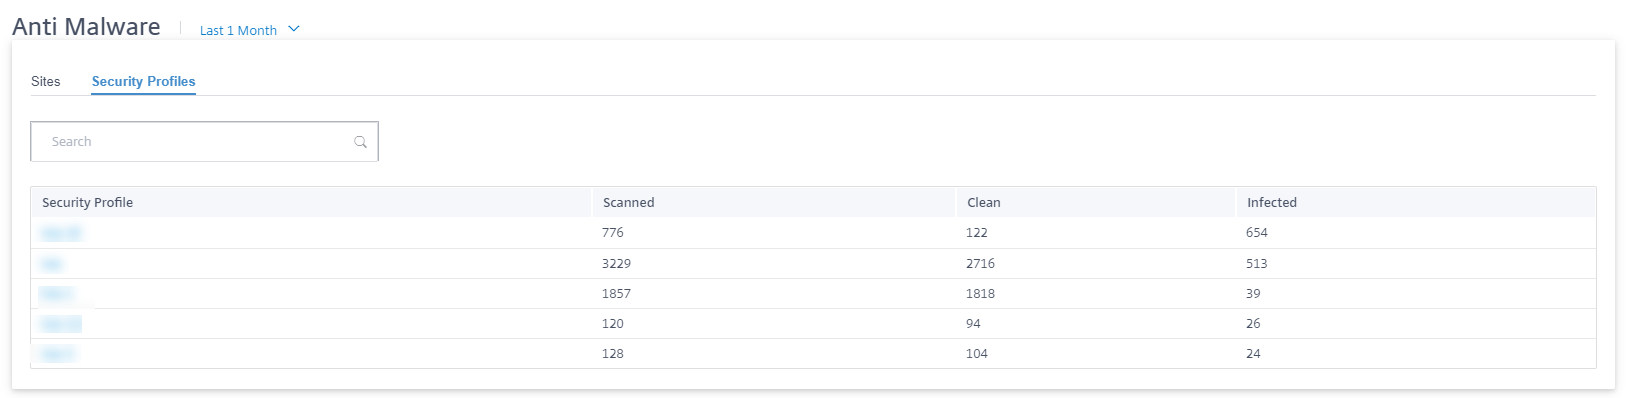
Anti-malware
To view Anti-Malware reports, at the network level navigate to Reports > Security > Anti-Malware and select the timeline for which you want to view the reports.
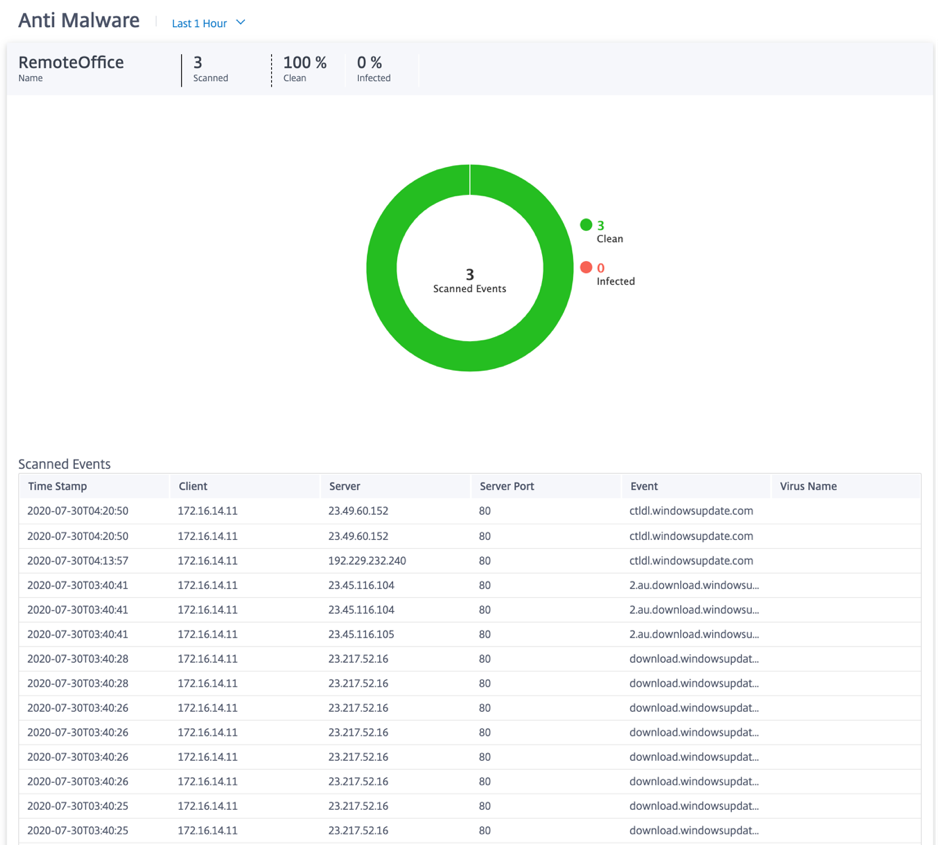
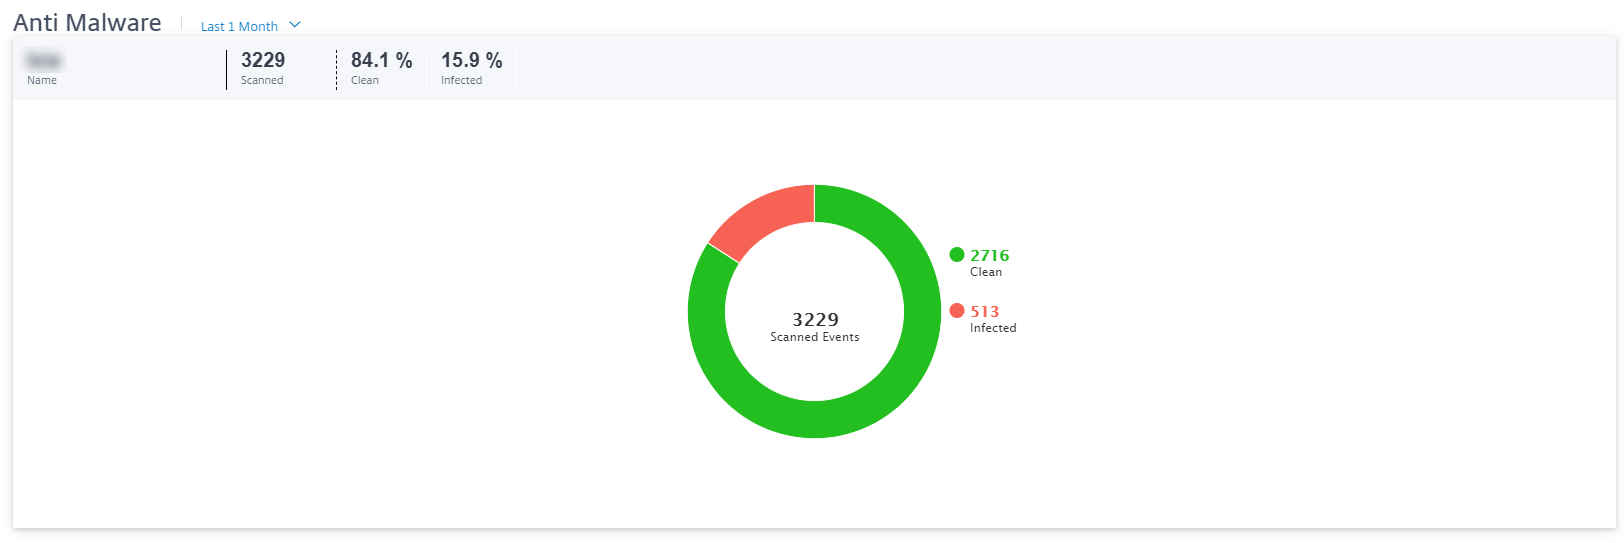
The Event Distribution section displays the following information:
- Total number of files scanned.
- Percentage of files that were clean.
- Percentage of files that were infected.
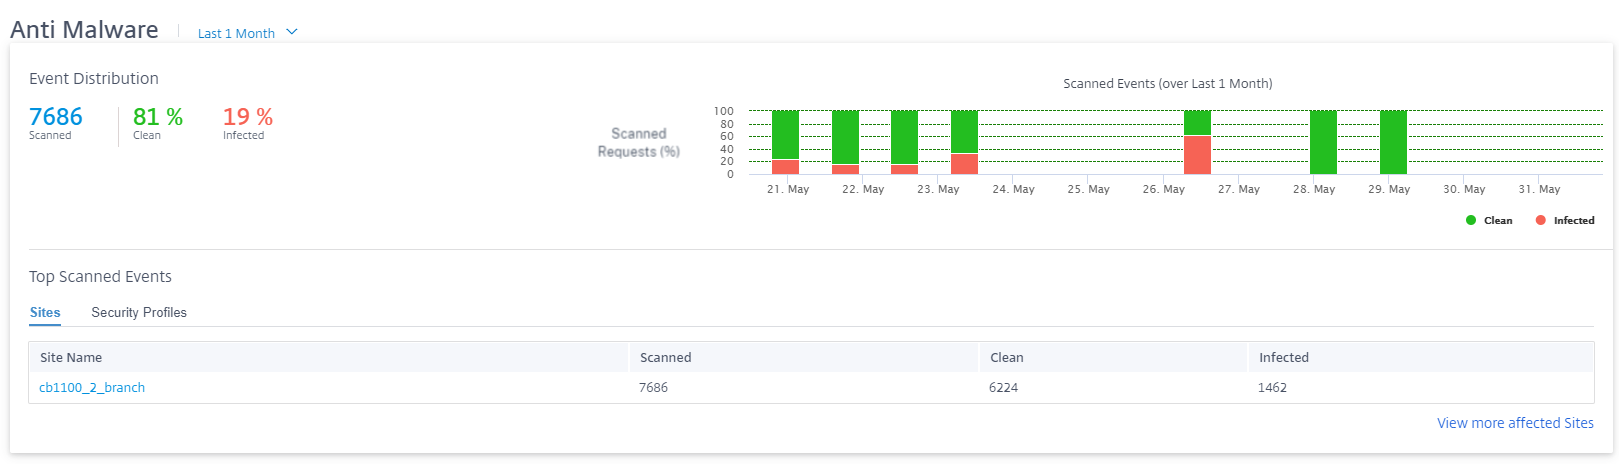
You can also view a graphical representation of the percentage of files that were clean or infected over the selected time frame.
Top scanned events
The Top Scanned Events table provides the Anti-Malware scan details at the top 5 sites and security profiles.
Sites:
It displays the total number of scanned files, the number of clean files, and the number of infected files at the top 5 sites.
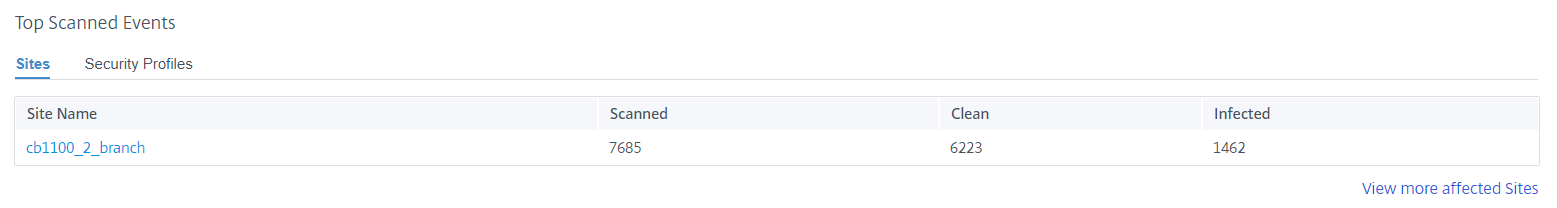
Click View more affected Sites, to view the Anti-Malware scan details of all the affected sites in the network.
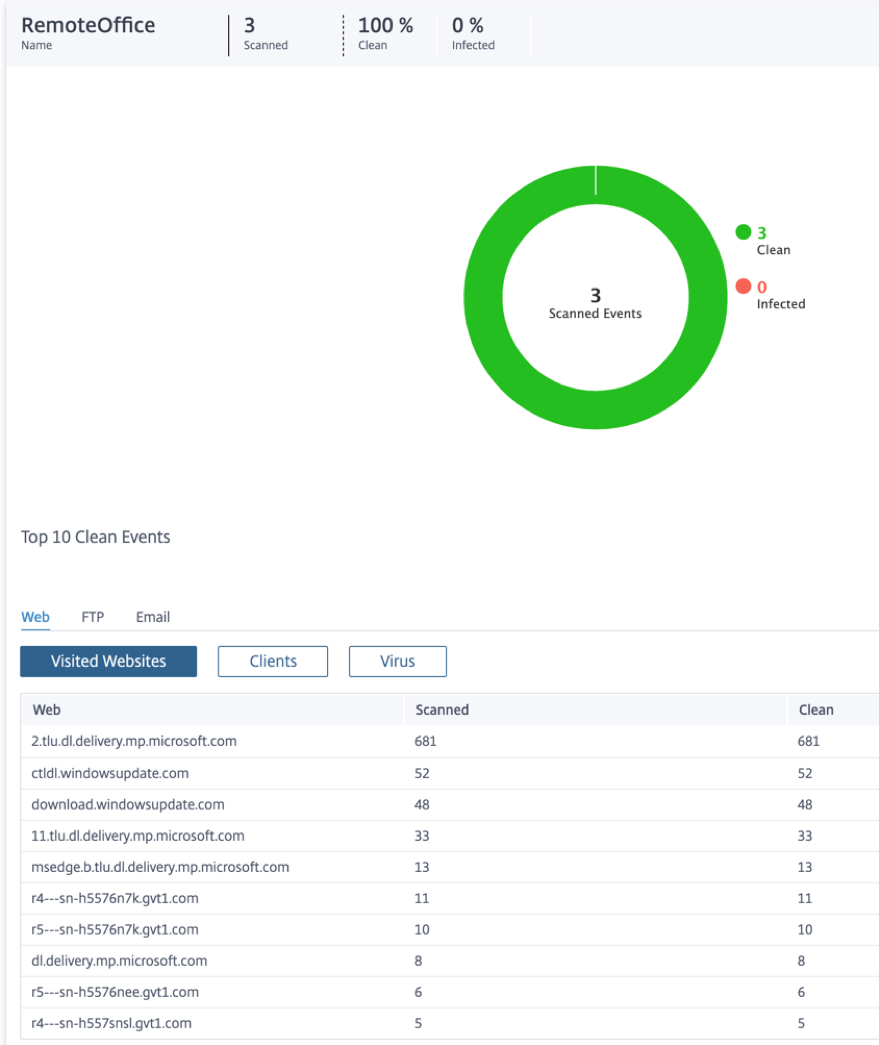
Click an individual site name to view a graphical representation of the Anti-Malware scan details at the site. The Anti-Malware of the chosen site also provides the real-time report of the last 1000 Anti-Malware events from the total number of the files scanned (for the selected timeline).
You can click the individual slices of the pie chart (demarcated by the color) or the legends beside the pie chart to view the top-10 clean and infected event details for Web, FTP, and Email. You can further drilldown to verify the top-10 visited websites / FTP sites / email from, clients, virus.
Security profiles:
It displays the total number of scanned files, the number of clean files, and the number of infected files scanned by the top 5 security profiles.
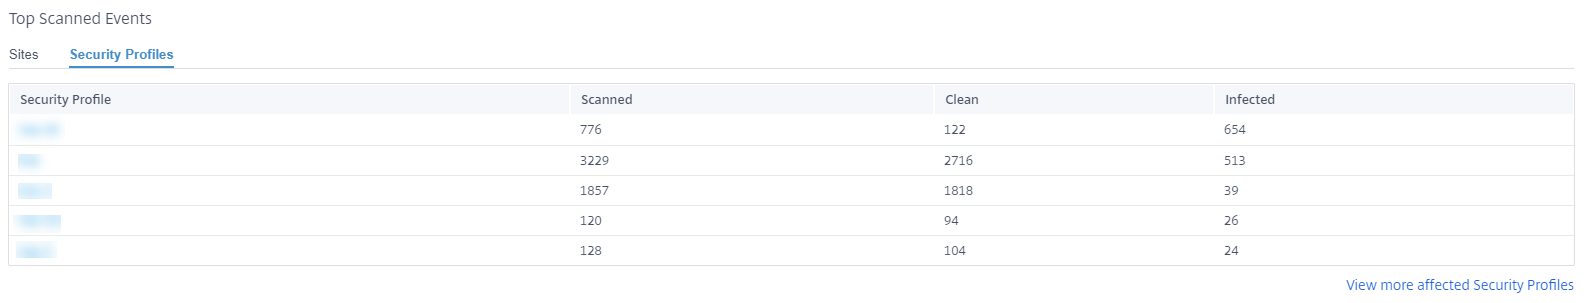
Click View more affected Security Profiles, to view the Anti-Malware scan details of all the security profiles.
Click an individual Security Profile name to view a graphical representation of its Anti-Malware scan details.
Intrusion Prevention
To view the Intrusion Prevention report, at the network level navigate to Reports > Security > Intrusion Prevention and select the timeline for which you want to view the report.
The Intrusion Distribution section displays the following information:
- Total number of intrusion events
- Percentage of intrusion events logged
- Percentage of intrusion events blocked
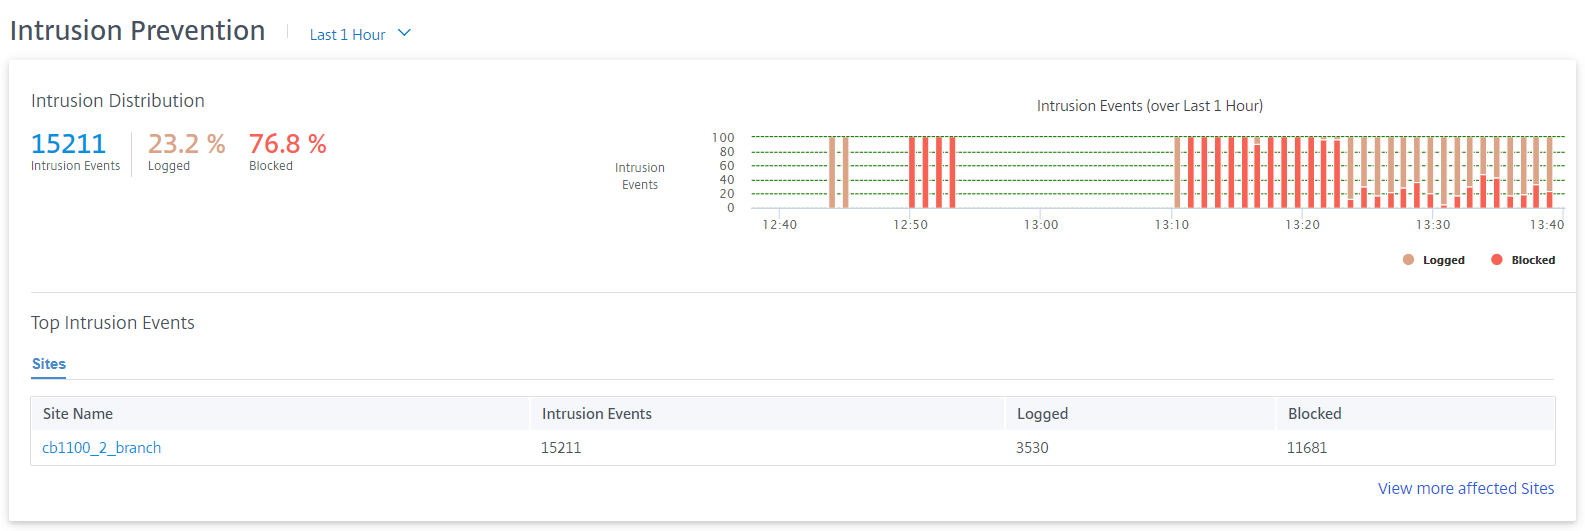
You can also view a graphical representation of the percentage of intrusion events logged or blocked over the selected time frame.
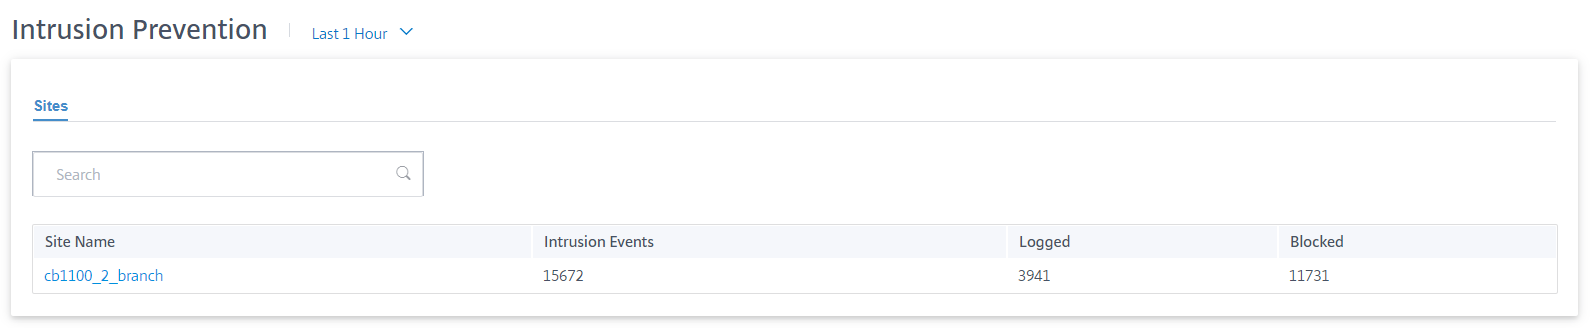
Top intrusion events
The Top Intrusion Events table provides the intrusion prevention details at the top 5 sites. It displays the total number of intrusion events, the number of intrusion events logged, and the number of intrusion events blocked at the top 5 sites.
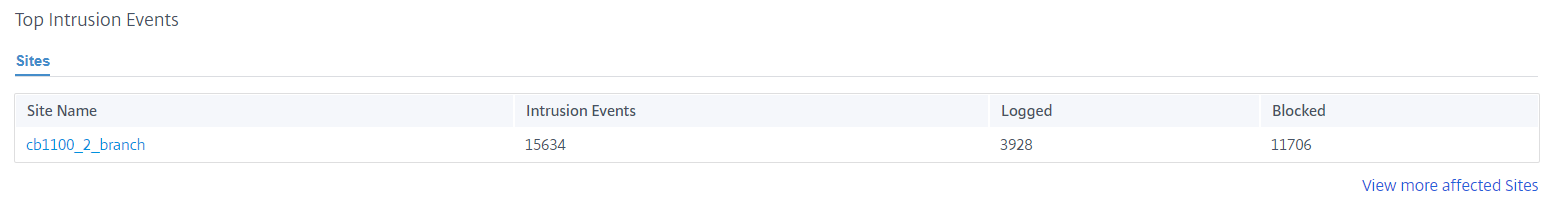
Click View more affected Sites, to view the Intrusion Prevention details of all the affected sites in the network.
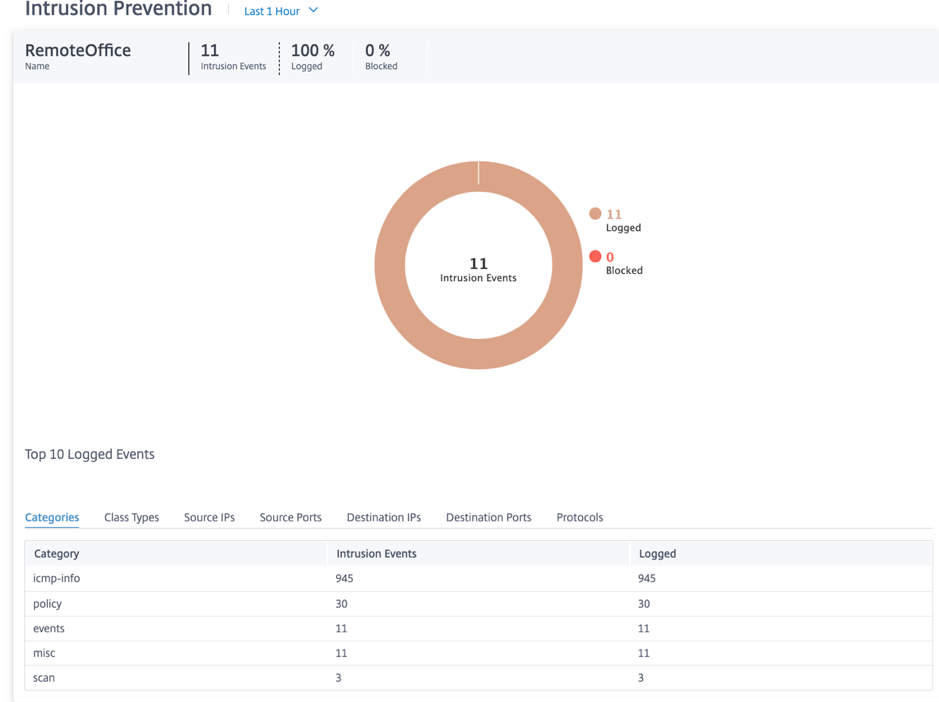
Click an individual site name to view a graphical representation of the Intrusion Prevention details at the site. The Intrusion Prevention of the chosen site also provides the real-time report of the last 1000 logged and blocked intrusion prevention system events from the total number of intrusion events (for the selected timeline).
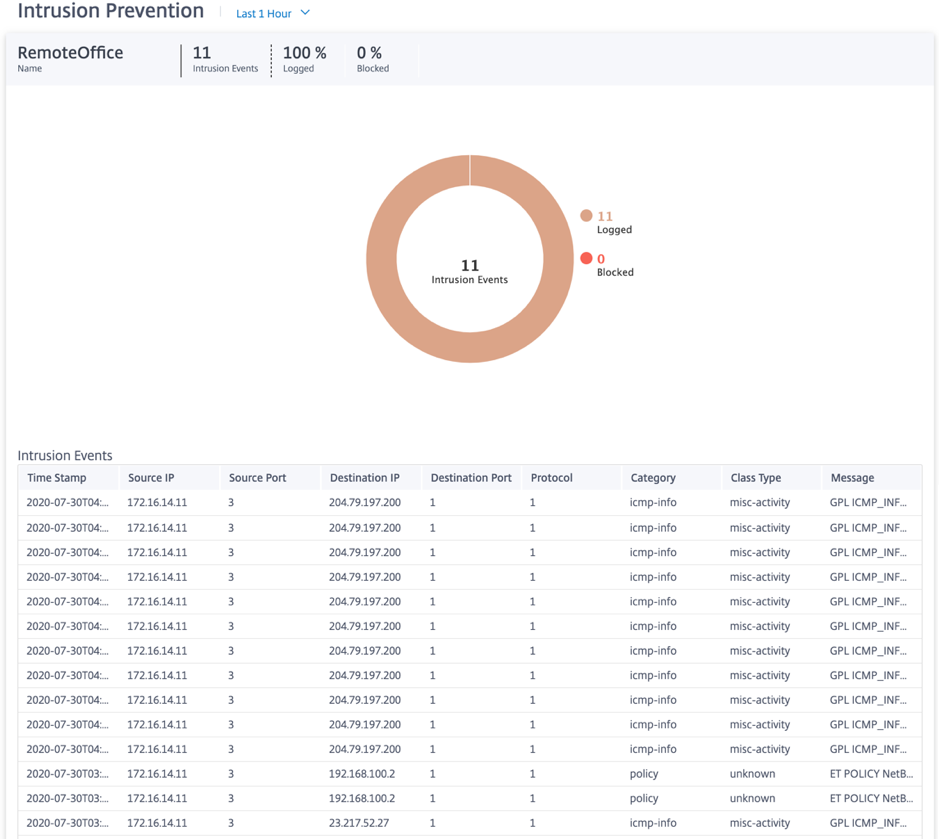
You can click the individual slices of the pie chart (demarcated by the color) or the legends beside the pie chart to view the top-10 logged and blocked event details for class types, categories, source/destination IPs and ports, and Protocols along with the timestamp.
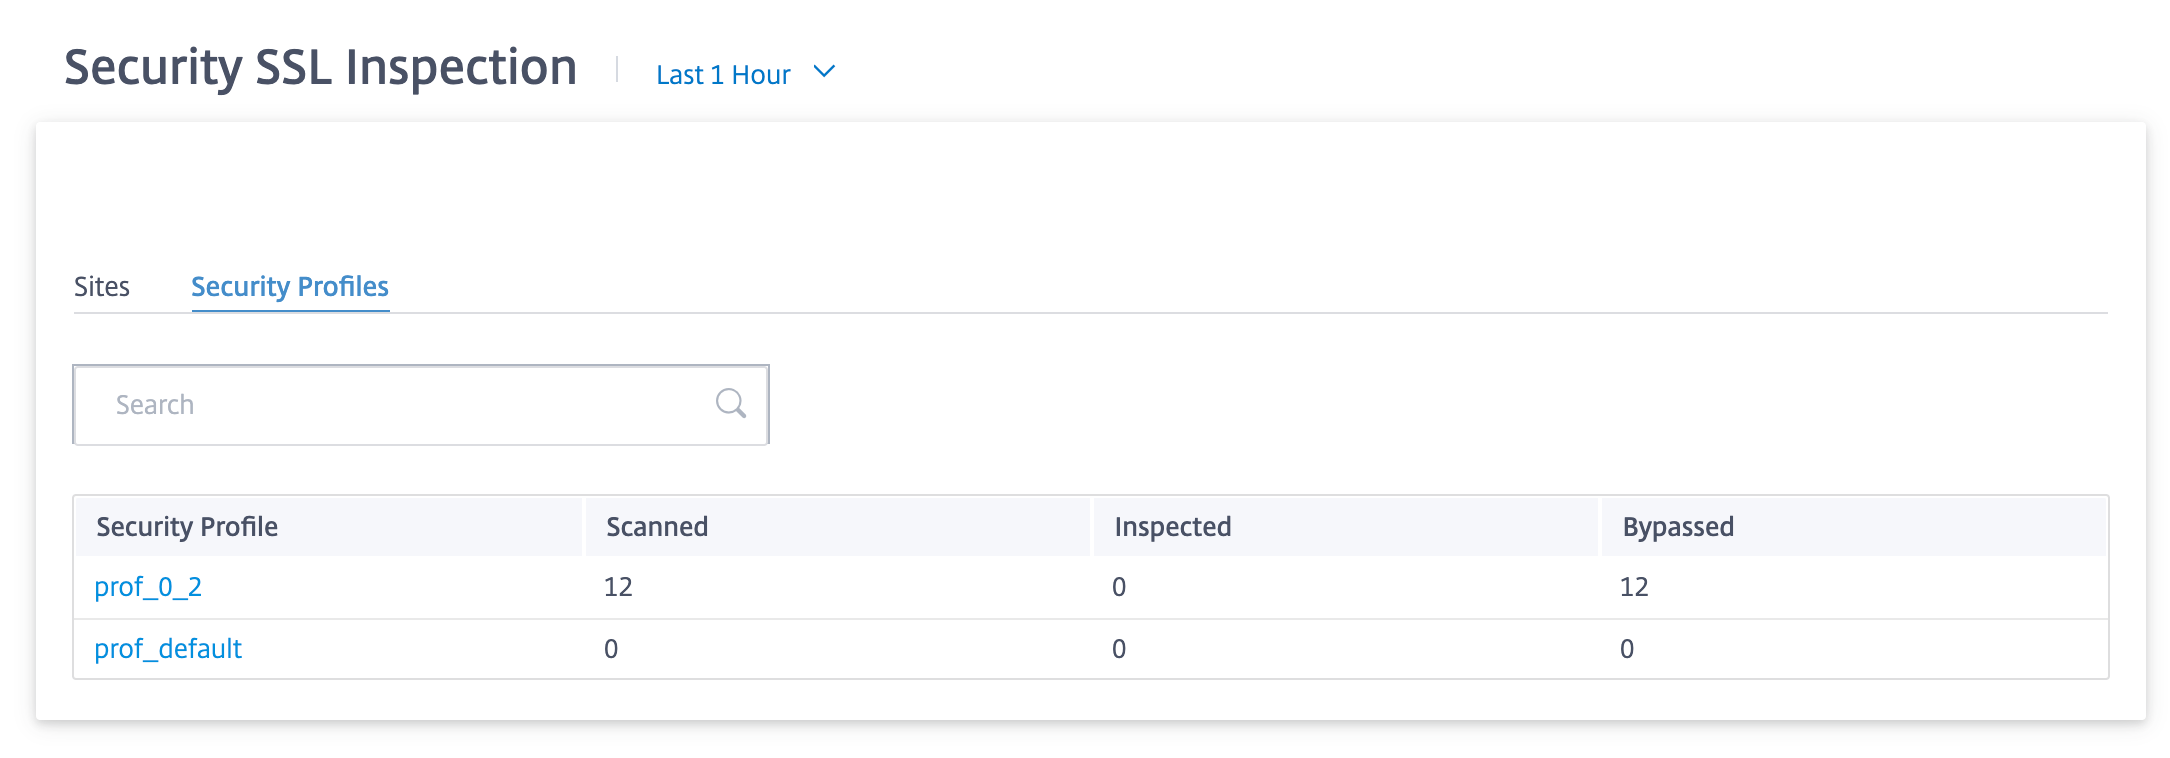
SSL inspection
To view the SSL inspection report, at the network level navigate to Reports > Security > SSL Inspection and select the timeline for which you want to view the report.
The SSL Inspection section displays the following information:
- Total number of SSL inspection events
- Percentage of SSL inspection events inspected
- Percentage of SSL inspection events bypassed
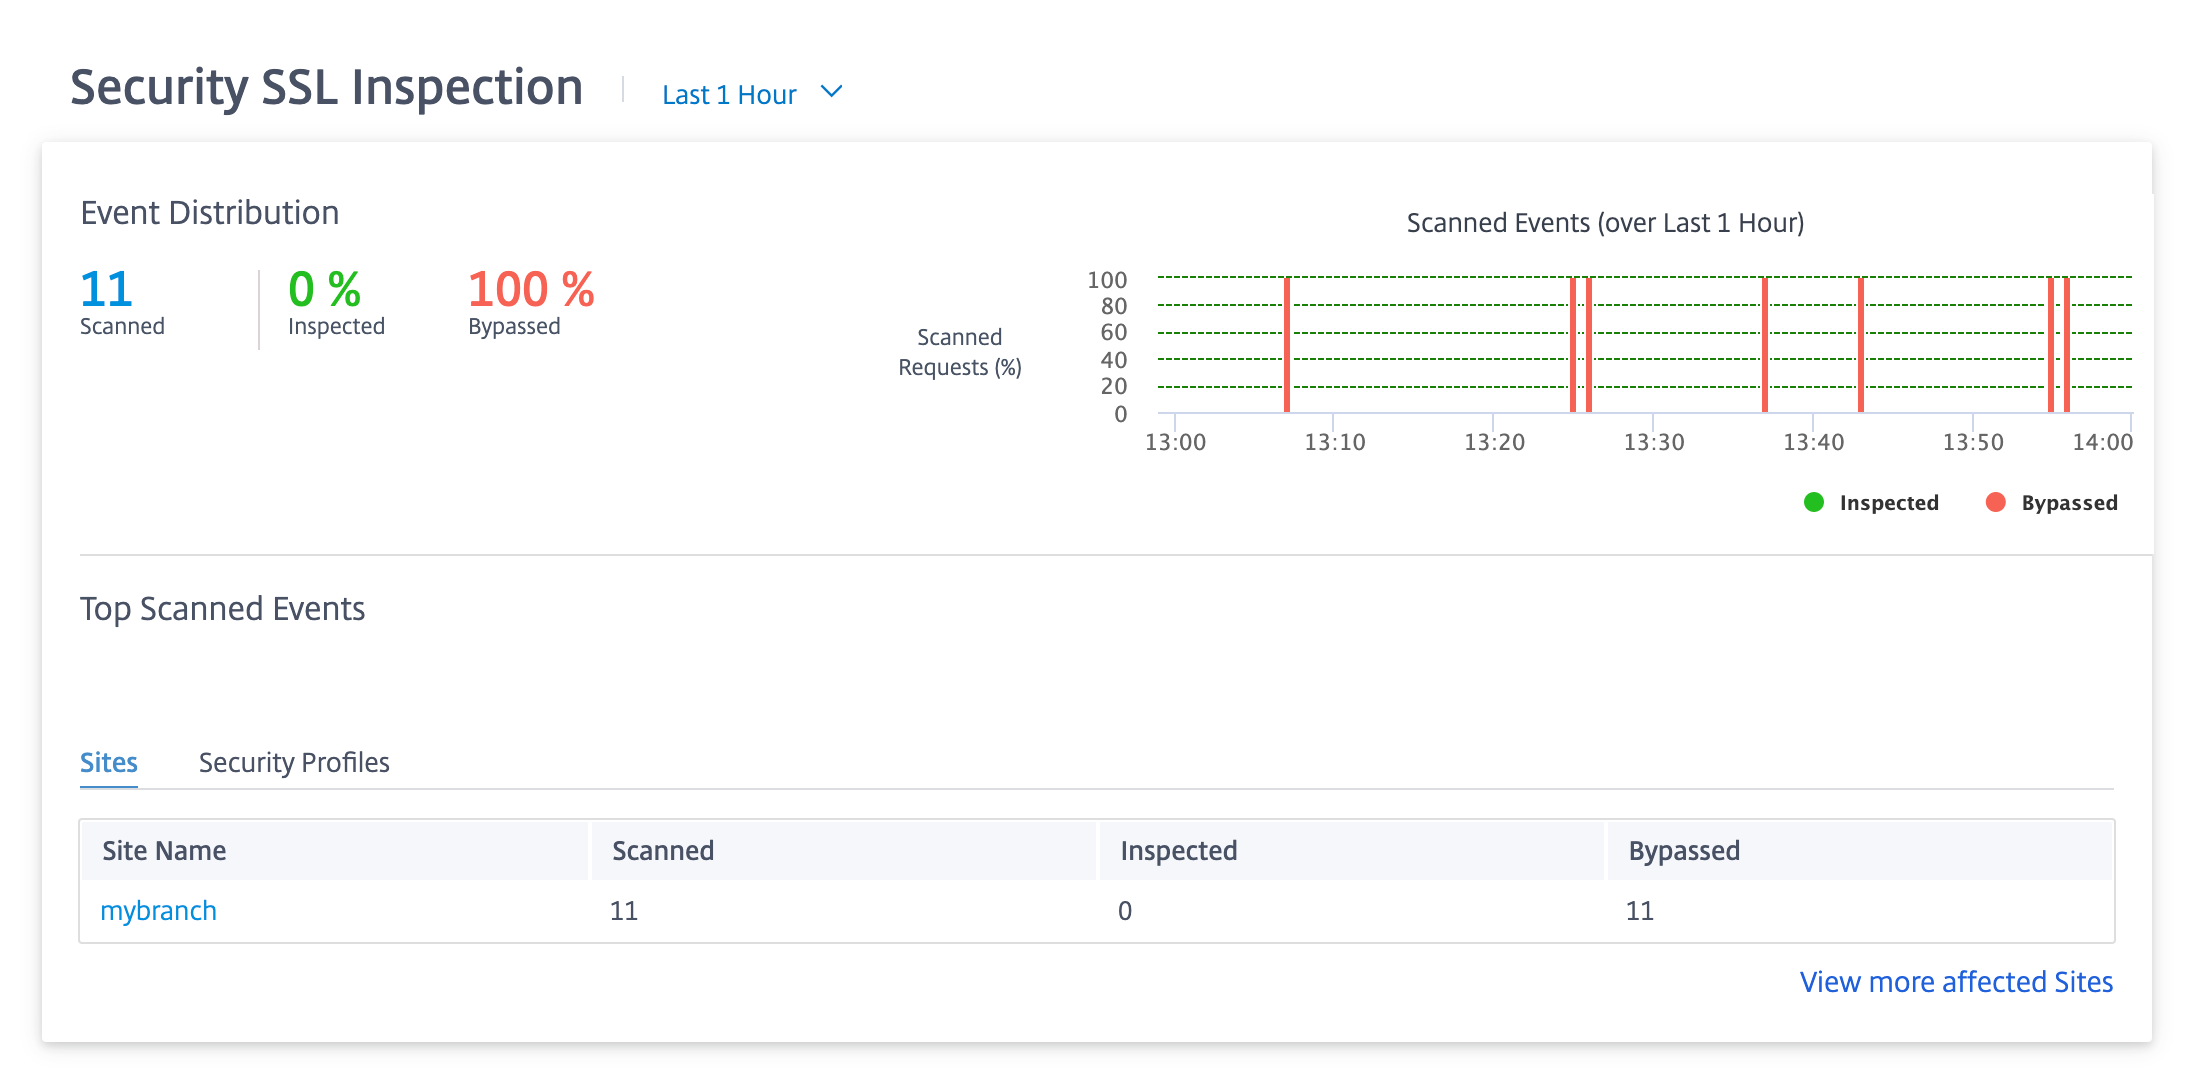
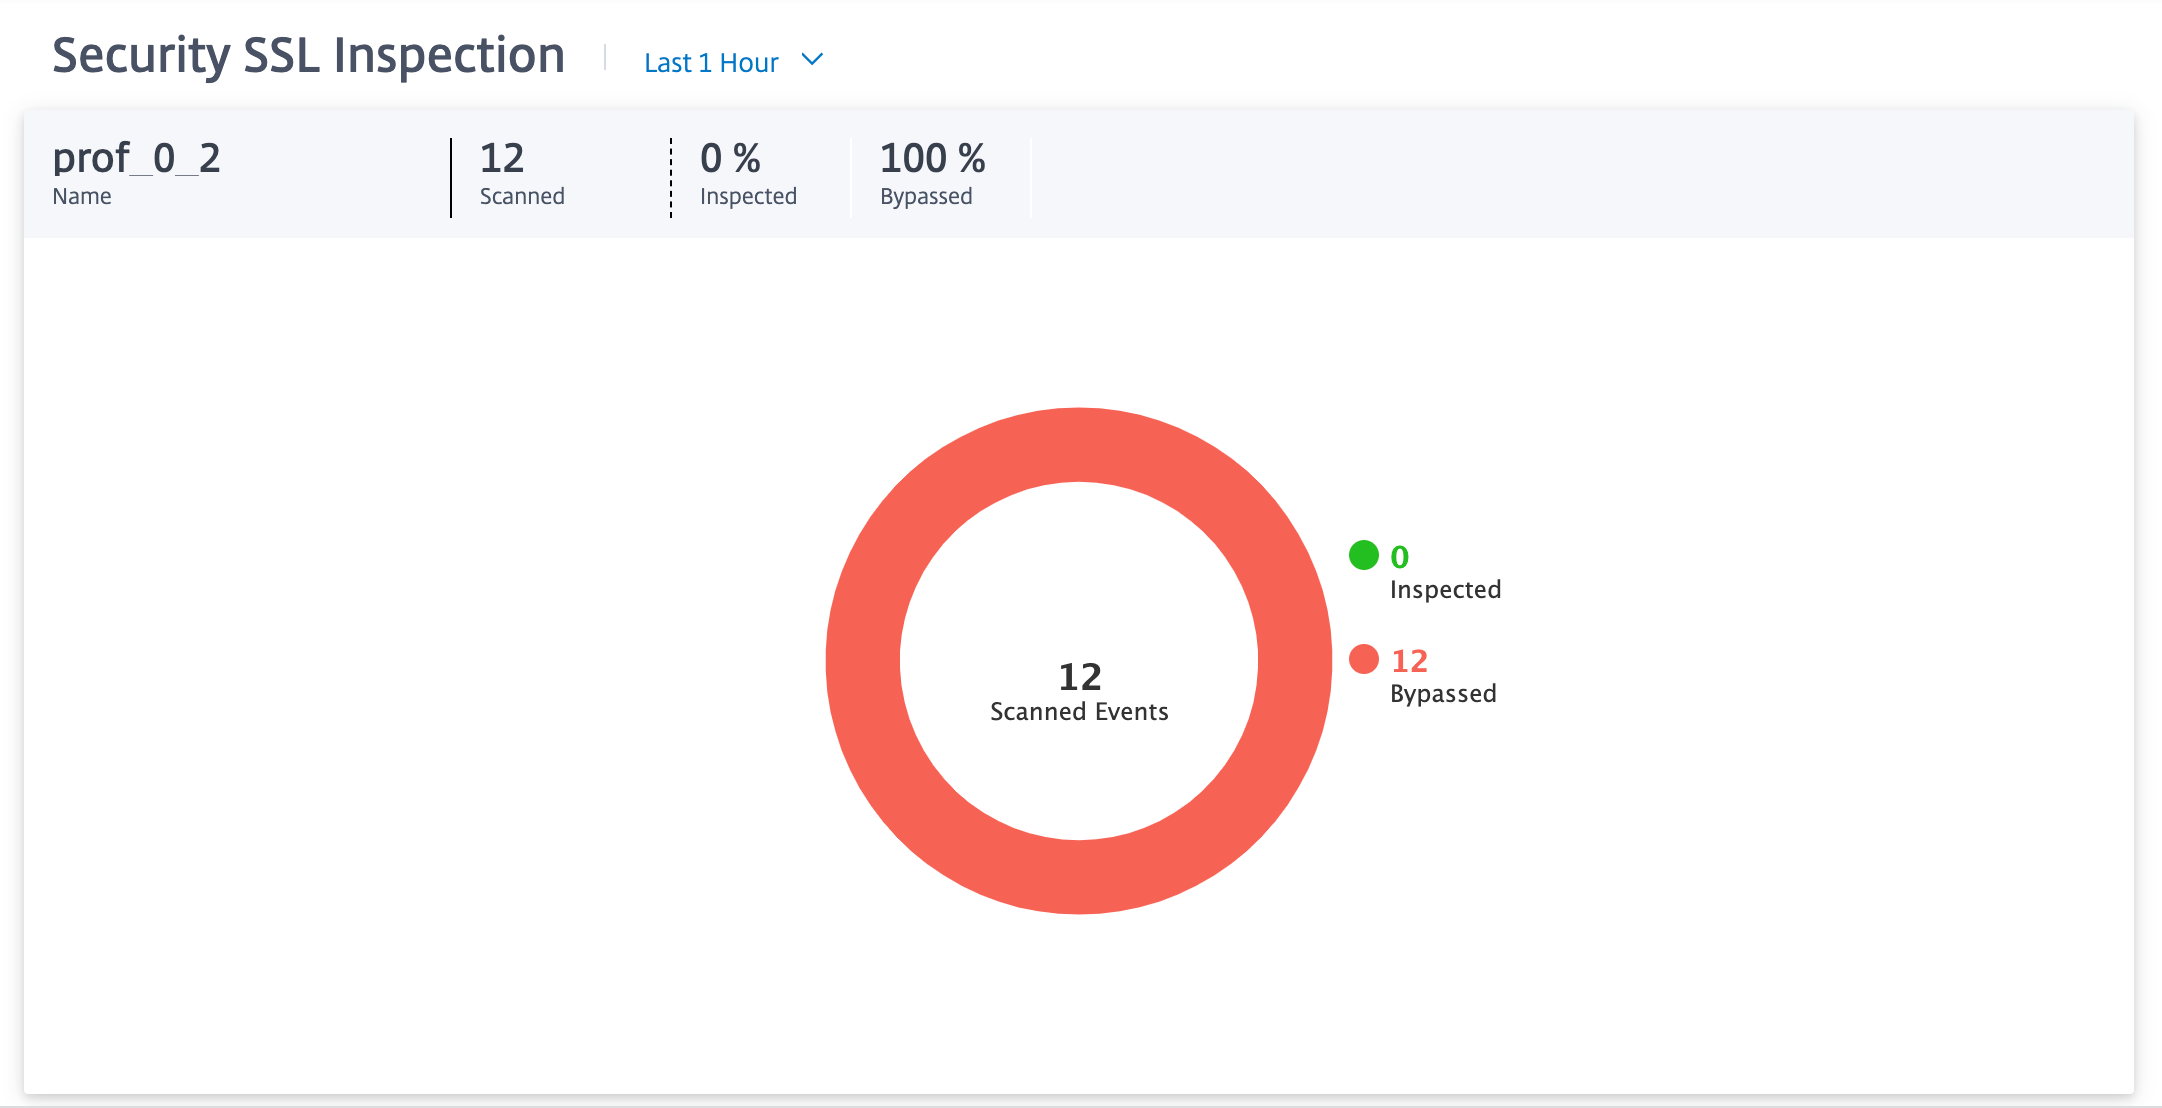
You can also view a graphical representation of the percentage of SSL inspection events inspected or bypassed over the selected time frame.
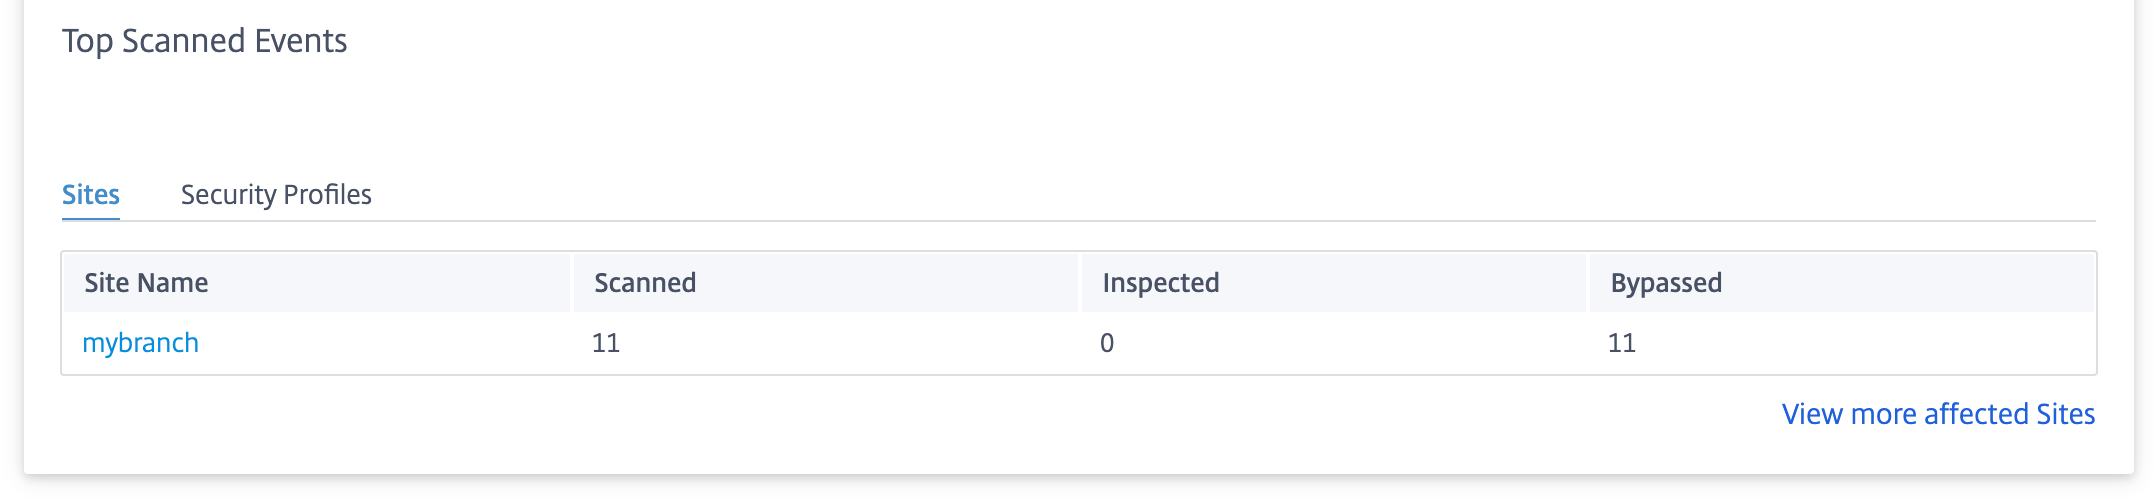
Top scanned events
The Top Scanned Events table provides the SSL inspection details at the top 5 sites. It displays the total number of SSL inspection events, the number of events scanned, and the number of events bypassed at the top 5 sites.
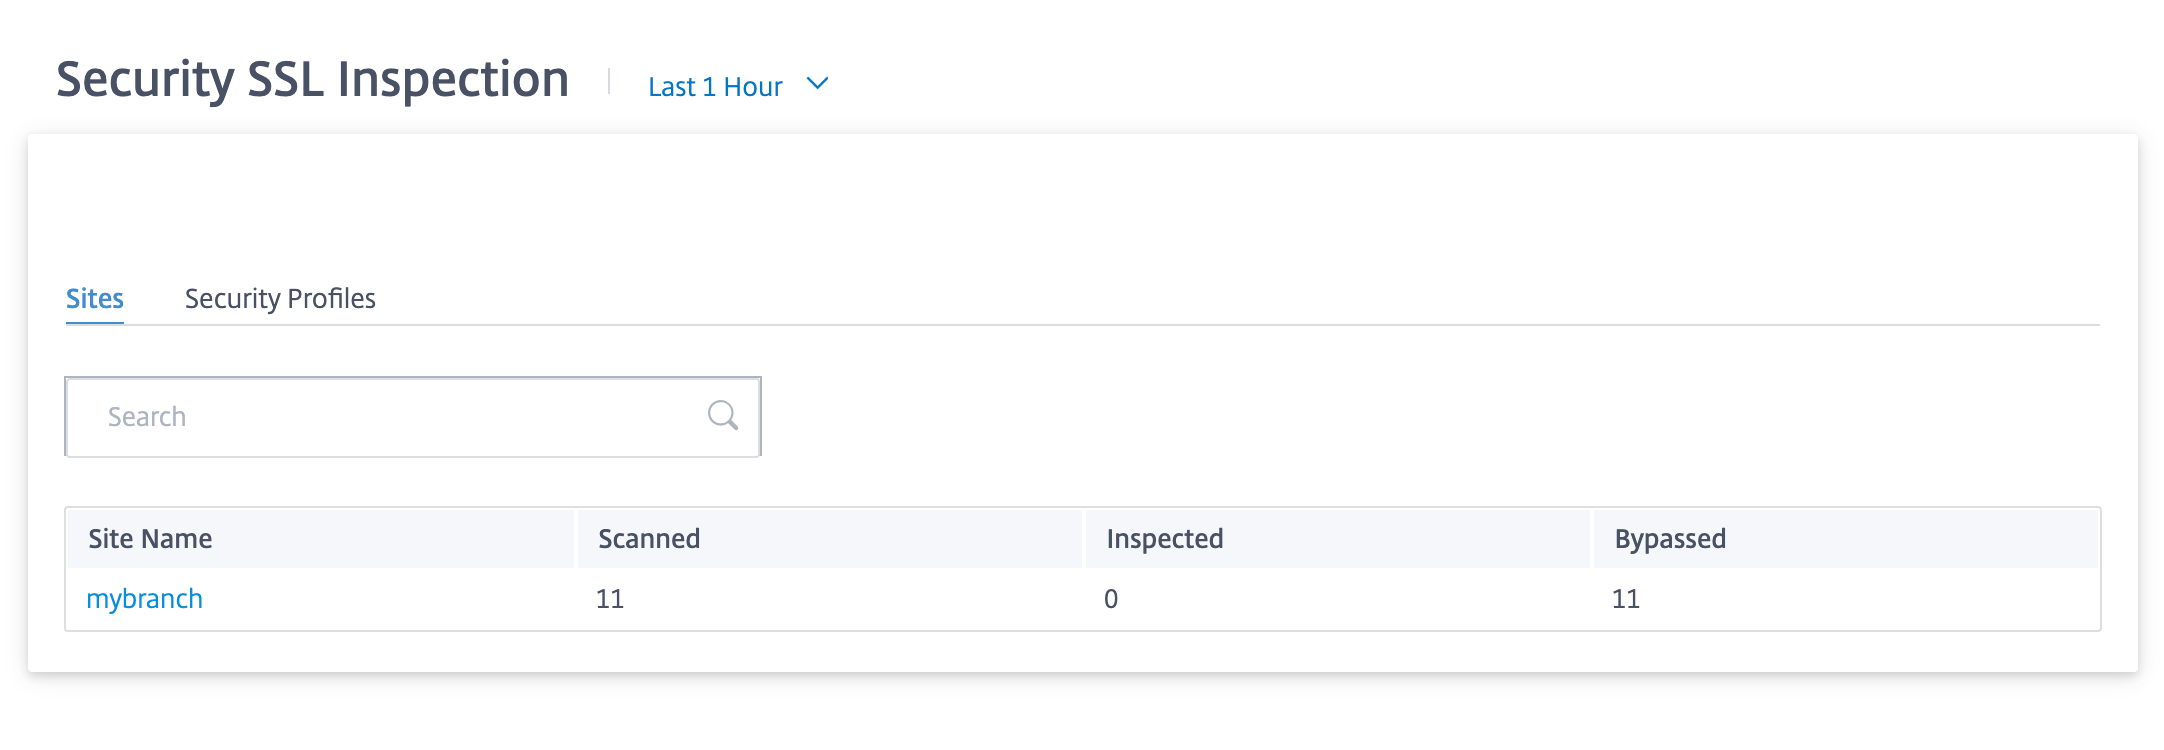
Click View more affected Sites, to view the SSL inspection details of all the affected sites in the network.
Click an individual site name to view a graphical representation of the SSL inspection details at the site. The SSL Inspection of the chosen site also provides the real-time report of the last 1000 scanned and bypassed SSL inspection events from the total number of SSL inspection events (for the selected timeline).
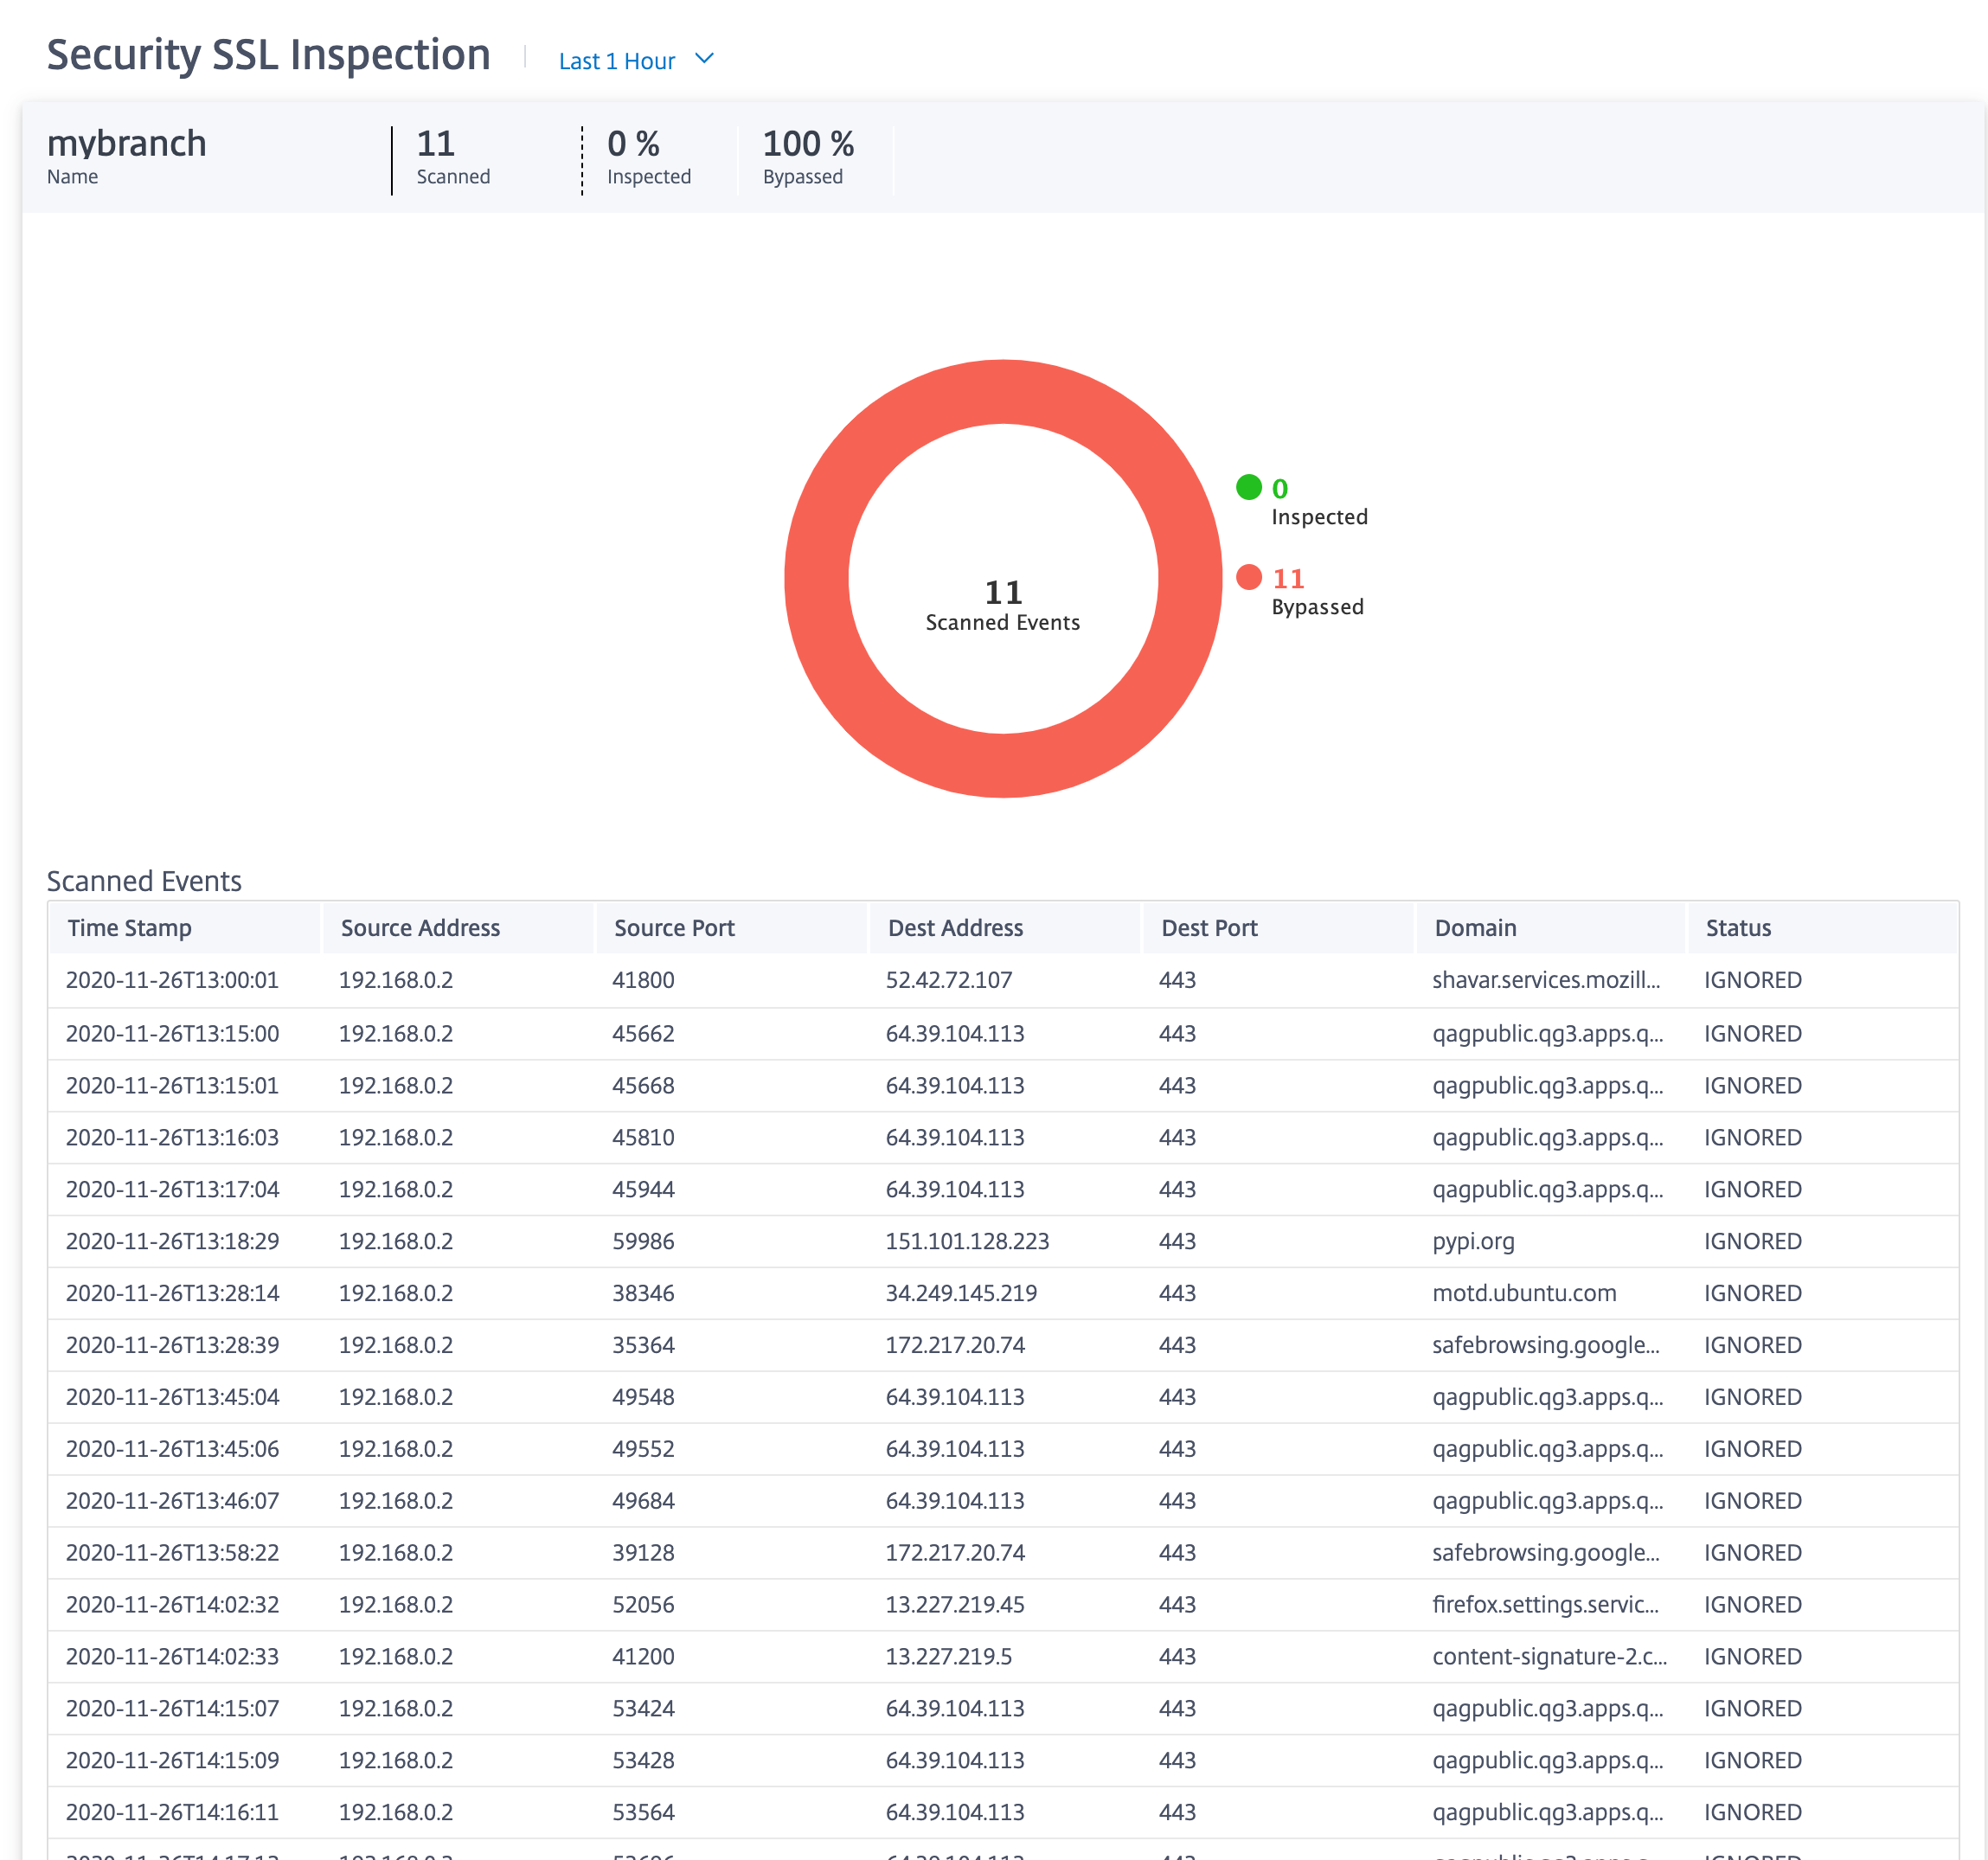
You can click the individual slices of the pie chart (demarcated by the color) or the legends beside the pie chart to view the top-10 scanned, inspected, and bypassed event details for timestamp, source/destination IPs and ports, domain, and status.
Security profiles:
It displays the total number of scanned files, the number of inspected files, and the number of bypassed files scanned by the top 5 security profiles.
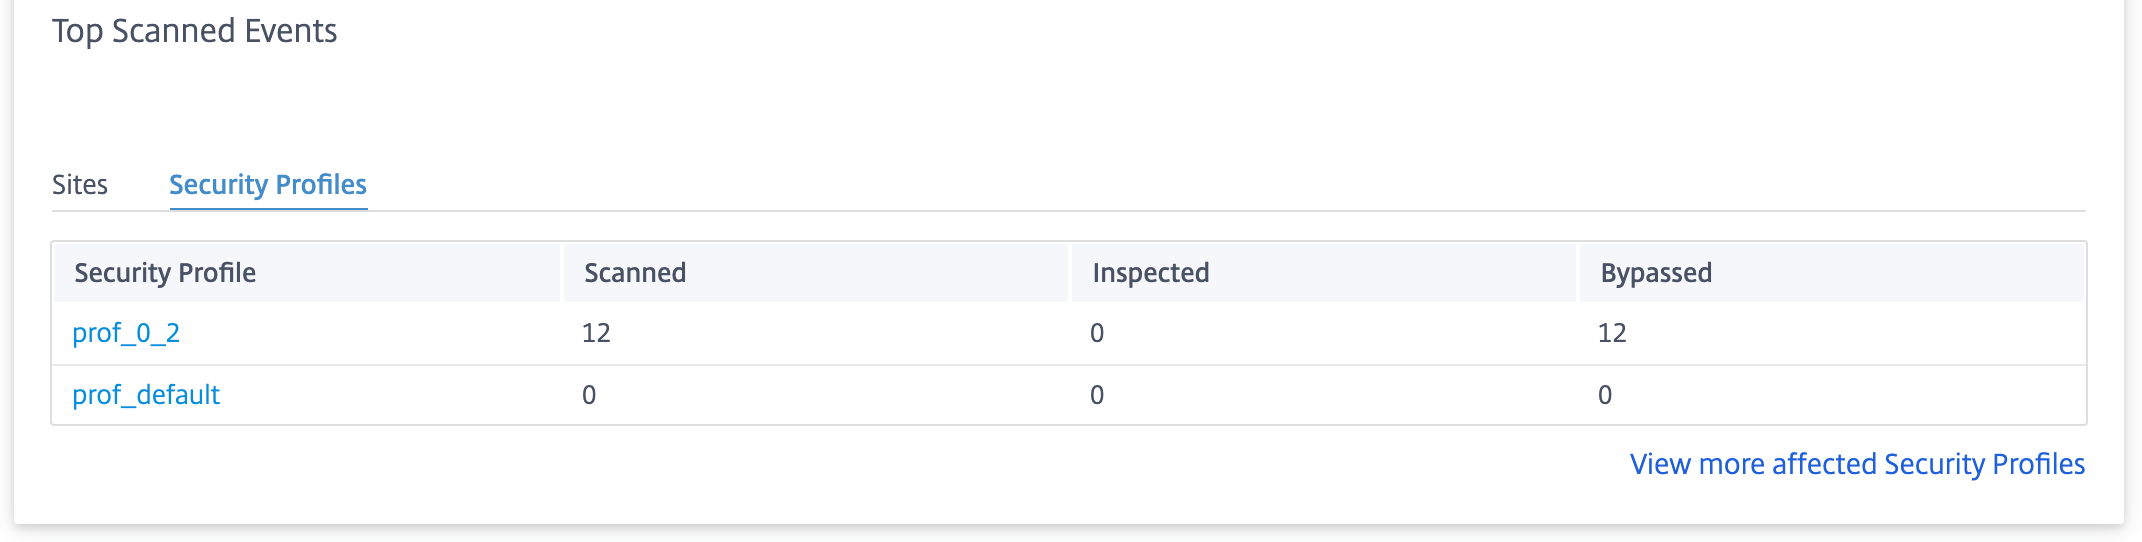
Click View more affected Security Profiles, to view the SSL inspection scan details of all the security profiles.
Click an individual Security Profile name to view a graphical representation of its SSL inspection scan details.
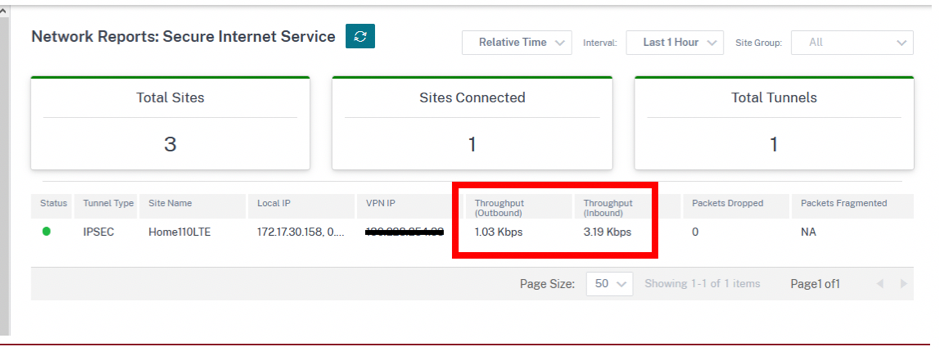
Citrix Secure Internet Access™ report
You can see the CSIA dashboard under the Reports > Secure Internet Service page in Citrix SD-WAN™ Orchestrator. In this page you can see the status of the tunnels whether the tunnel is active or not including the total number of sites in your SD-WAN deployment, number of connected sites using the tunnel direction method, and the total number of tunnels. If host machines are actively connected and access internet resources, the outbound and inbound throughput will be measure.
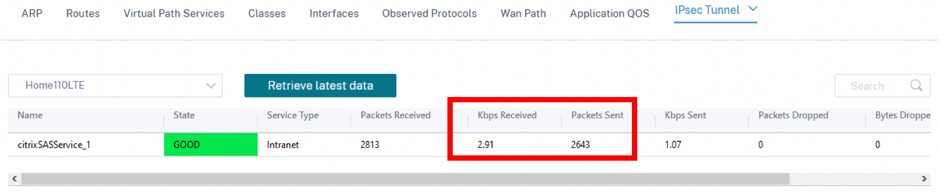
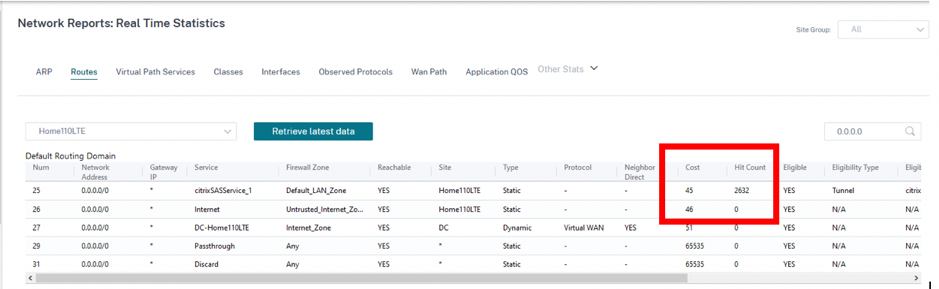
Throughput usage for the tunnels can also be retrieved from the site-level Reports > Real Time > IPsec Tunnel.
The site-level Routes table can also confirm that the routes to the CSIA service are being used by incrementing Hit Count. Contending default routes (0.0.0.0/0) have higher cost.
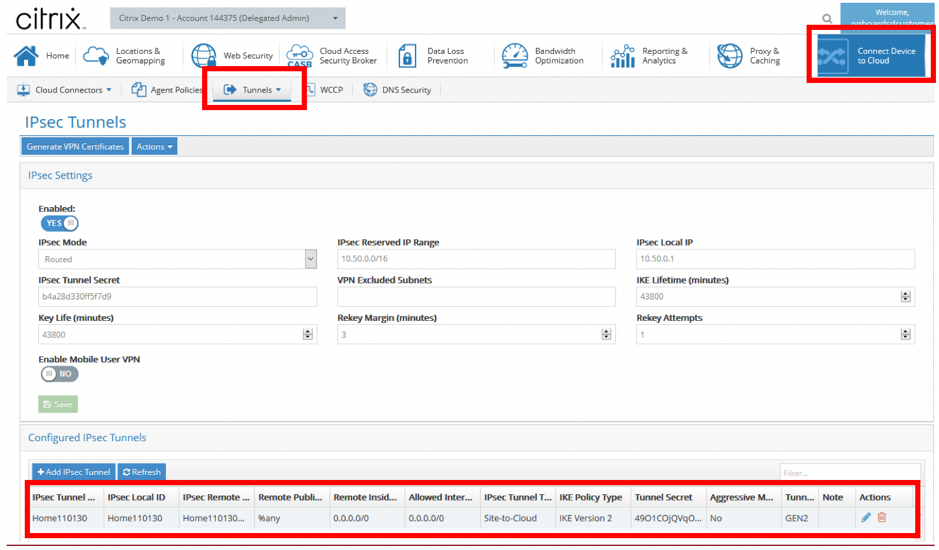
Extra tunnel information can be obtained from the CSIA portal, which was formed during the creation of the CSIA service on SD-WAN. Navigate to Connect Devices to Cloud > Tunnels > IPSec Tunnels.
Also, local subnets are automatically defined on the CSIA portal. Navigate to Network > Local Subnets. This is the subnet range that is expected from LAN devices connected behind the SD-WAN site and expected to use the tunnel for redirection.
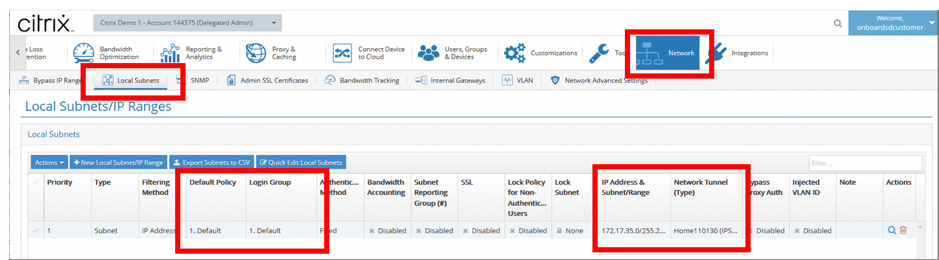
Note
The previsioning of the CSIA service automatically associates the Local Subnet with the Default security group. Use this security group to configure desired security policies on CSIA.
HDX™ dashboard and reports
For details on HDX dashboard and reports, see HDX dashboard and reports.
Network Quality
The Network Quality report enables a network-level comparison between the virtual overlay and the physical underlay paths in terms of availability and loss, latency, and jitter. This helps to effectively monitor how the overlay is faring relative to the underlay network, and also aids troubleshooting. For Latency and Jitter, only the details of the underlay member paths are displayed.
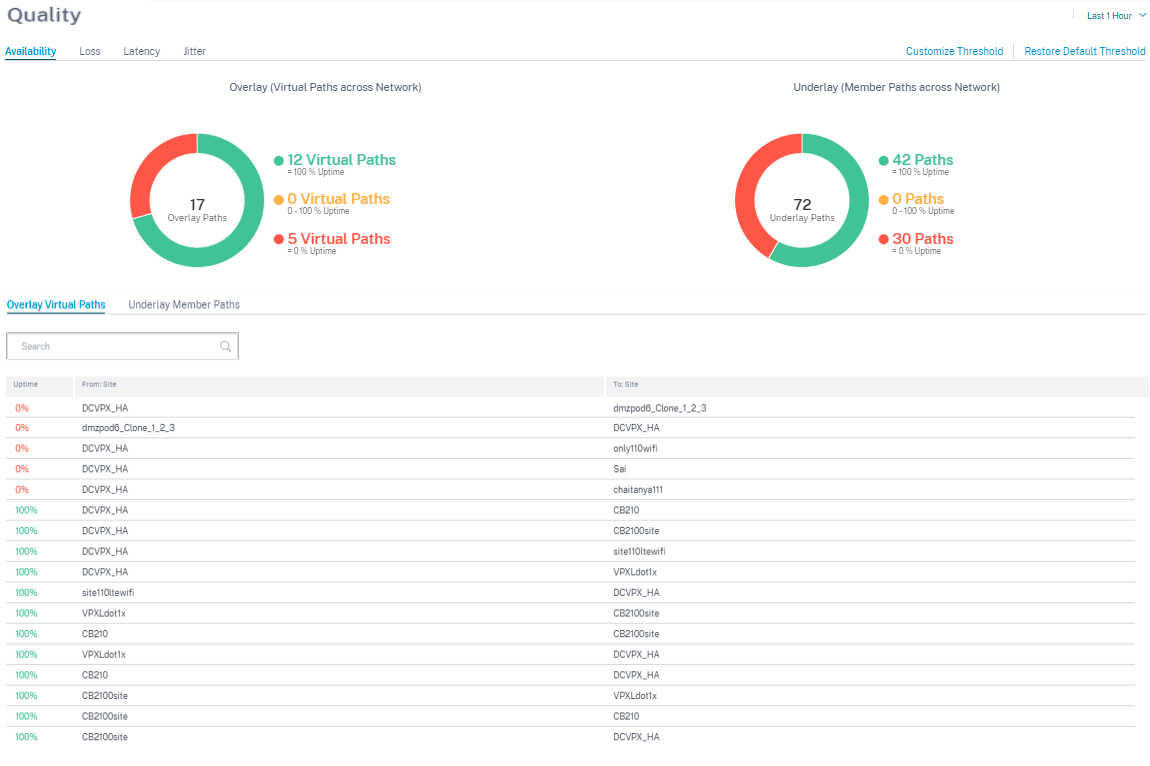
Click the table entry to see the detailed view.
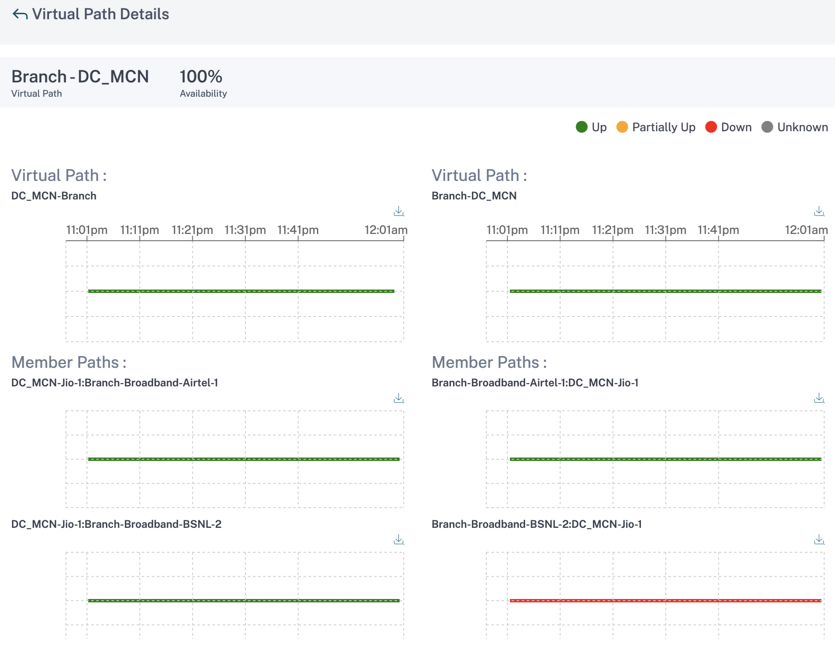
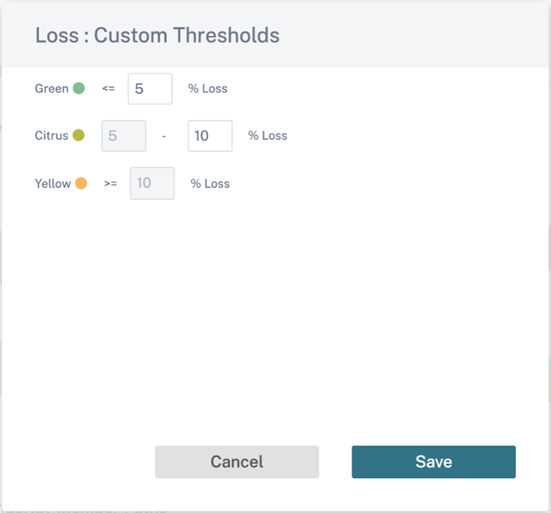
You can customize the threshold for each network quality parameter.
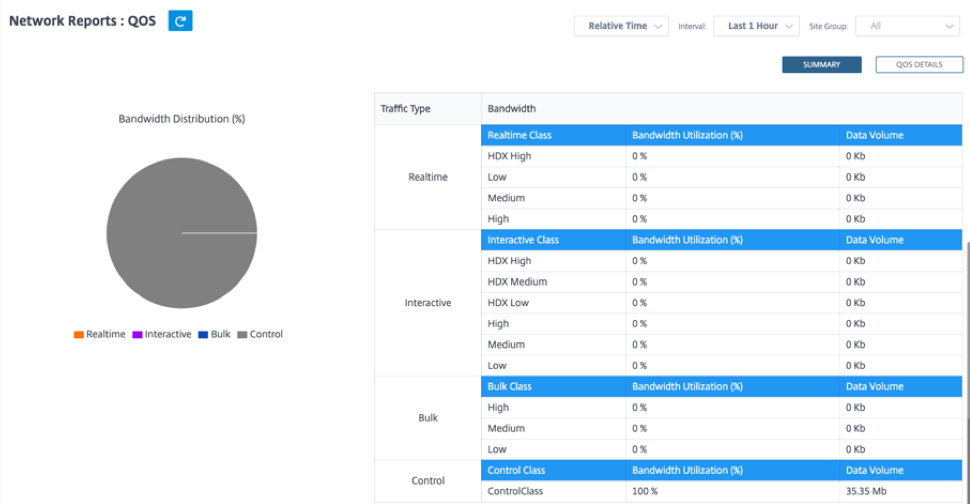
Quality of Service
Quality of Service (QoS) manages data traffic to reduce packet loss, latency, and jitter on the network. For more information, see Quality of Service. The following are two ways to view the Quality-of-Service (QoS) report:
-
Summary View: Summary view provides an overview of bandwidth consumption across all types of traffic - real-time, interactive, bulk, and control across the network and per site.
-
Real-time: Used for low latency, low bandwidth, time-sensitive traffic. Real-time applications are time sensitive but don’t really need high bandwidth (for example voice over IP). Real-time applications are sensitive to latency and jitter, but can tolerate some loss.
-
Interactive: Used for interactive traffic with low to medium latency requirements and low to medium bandwidth requirements. Interactive applications involve human input in the form of mouse clicks or cursor moves. The interaction is typically between a client and a server. The communication might not need high bandwidth but is sensitive to loss and latency. However, server to client does need high bandwidth to transfer graphical information, which might not be sensitive to loss.
-
Bulk: Used for high bandwidth traffic that can tolerate high latency. Applications that handle file transfer and need high bandwidth are categorized as bulk class. These applications involve little human interference and are mostly handled by the systems themselves.
-
Control: Used to transfer control packets that contain routing, scheduling, and link statistics information.
-
-
Detailed View: The detailed view captures trends around bandwidth consumption, traffic volume, packets dropped and so on for each QoS class associated with an overlay virtual path.
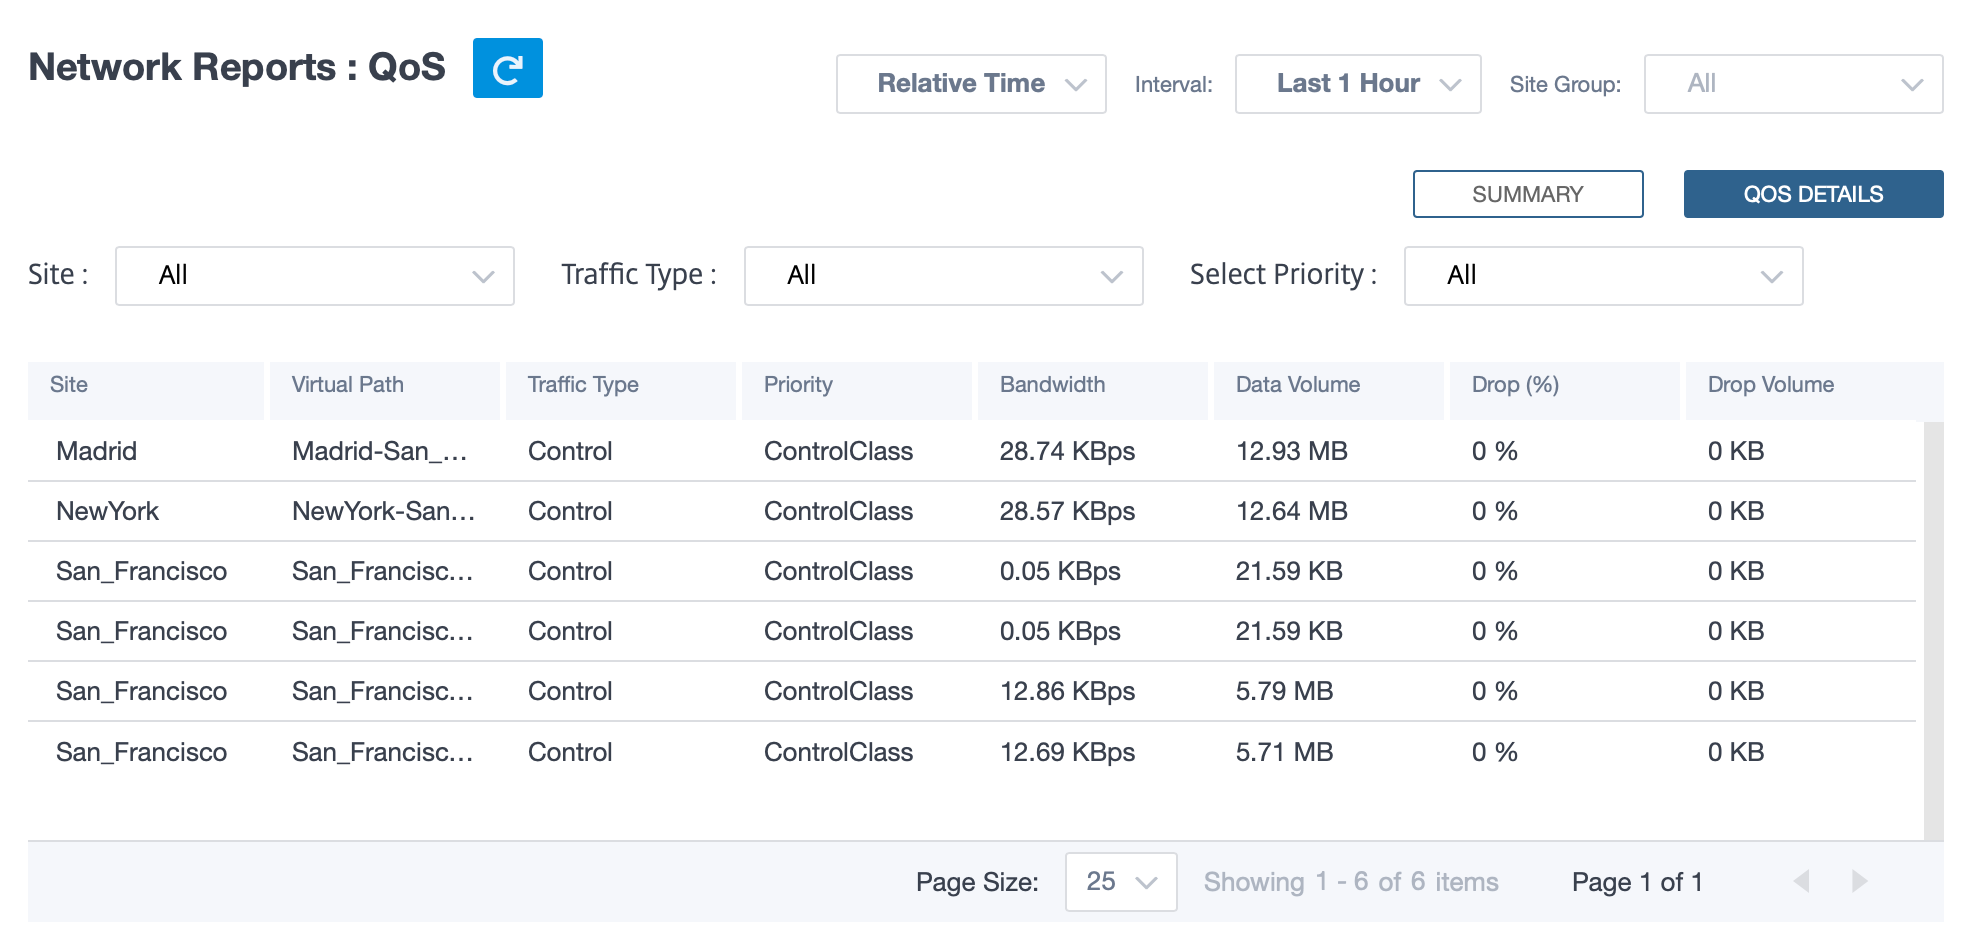
This report is available at the site level where the user can view QoS statistics based on the virtual path between the two sites. For more information see Site reports.
Historical statistics
For each site, you can view the statistics as graphs for the following network parameters:
- Sites
- Virtual Paths
- Paths
- WAN Links
- Interfaces
- Classes
- GRE Tunnels
- IPsec Tunnels
The statistics are collected as graphs. These graphs are plotted as timeline versus usage, allowing you to understand the usage trends of various network object properties. You can view graphs for network-wide application statistics.
You can view or hide the graphs and customize the columns as needed.
Sites
To view the Site statistics, navigate to Reports > Historical Statistics > Sites tab.
Select the site name from the list.
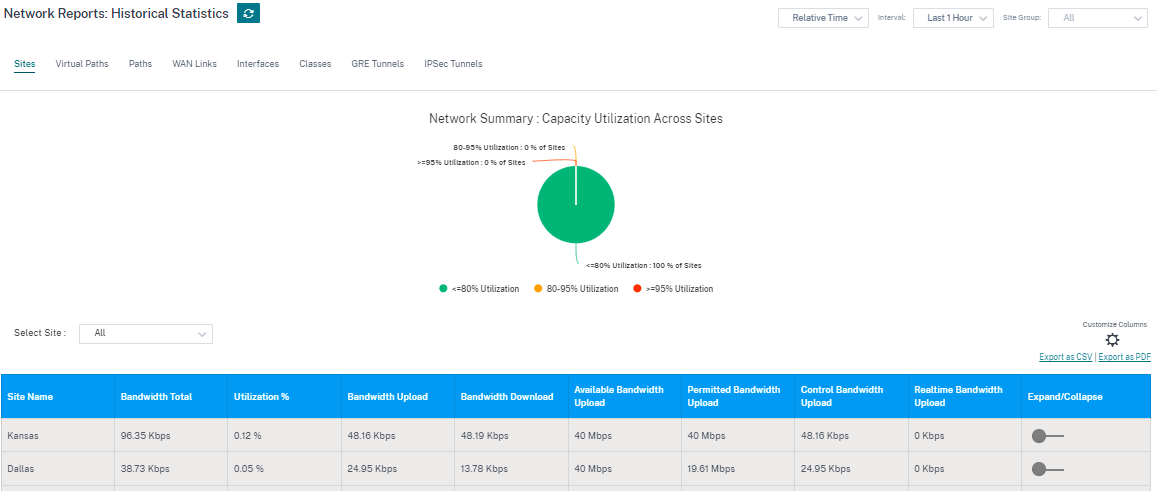
You can view the following metrics:
- Site Name: The site name.
- Bandwidth Total: Total bandwidth consumed by all packet types. Bandwidth = Control Bandwidth + Real-time Bandwidth + Interactive Bandwidth + Bulk Bandwidth.
- Utilization %: You can view the site statistics by Utilization (%).
- Bandwidth Upload: The maximum and the minimum upload speed through the WAN port.
- Bandwidth Download: The maximum and the minimum download speed through the WAN port.
- Available Bandwidth Upload: Total bandwidth allocated to all the WAN links of a site.
- Permitted Bandwidth Upload: Bandwidth available for transmitting information.
- Control Bandwidth Upload: Bandwidth used to transfer control packets that contain routing, scheduling, and link statistics information.
- Realtime Bandwidth Upload: Bandwidth consumed by applications that belong to the real-time class type in the Citrix SD-WAN configuration. The performance of such applications depends on a great extent upon network latency. A delayed packet is worse than a lost packet (for example, VoIP, Skype for Business).
- Expand/Collapse: You can expand or collapse the data as needed.
You can also export the filtered results in to a CSV or PDF file by using the Export as CSV and Export as PDF options. The CSV and PDF file name is prefixed with Network Performance followed by the date and time when the file is exported.
Virtual paths
To view the Virtual Paths statistics, navigate to Reports > Historical Statistics > Virtual Paths tab.
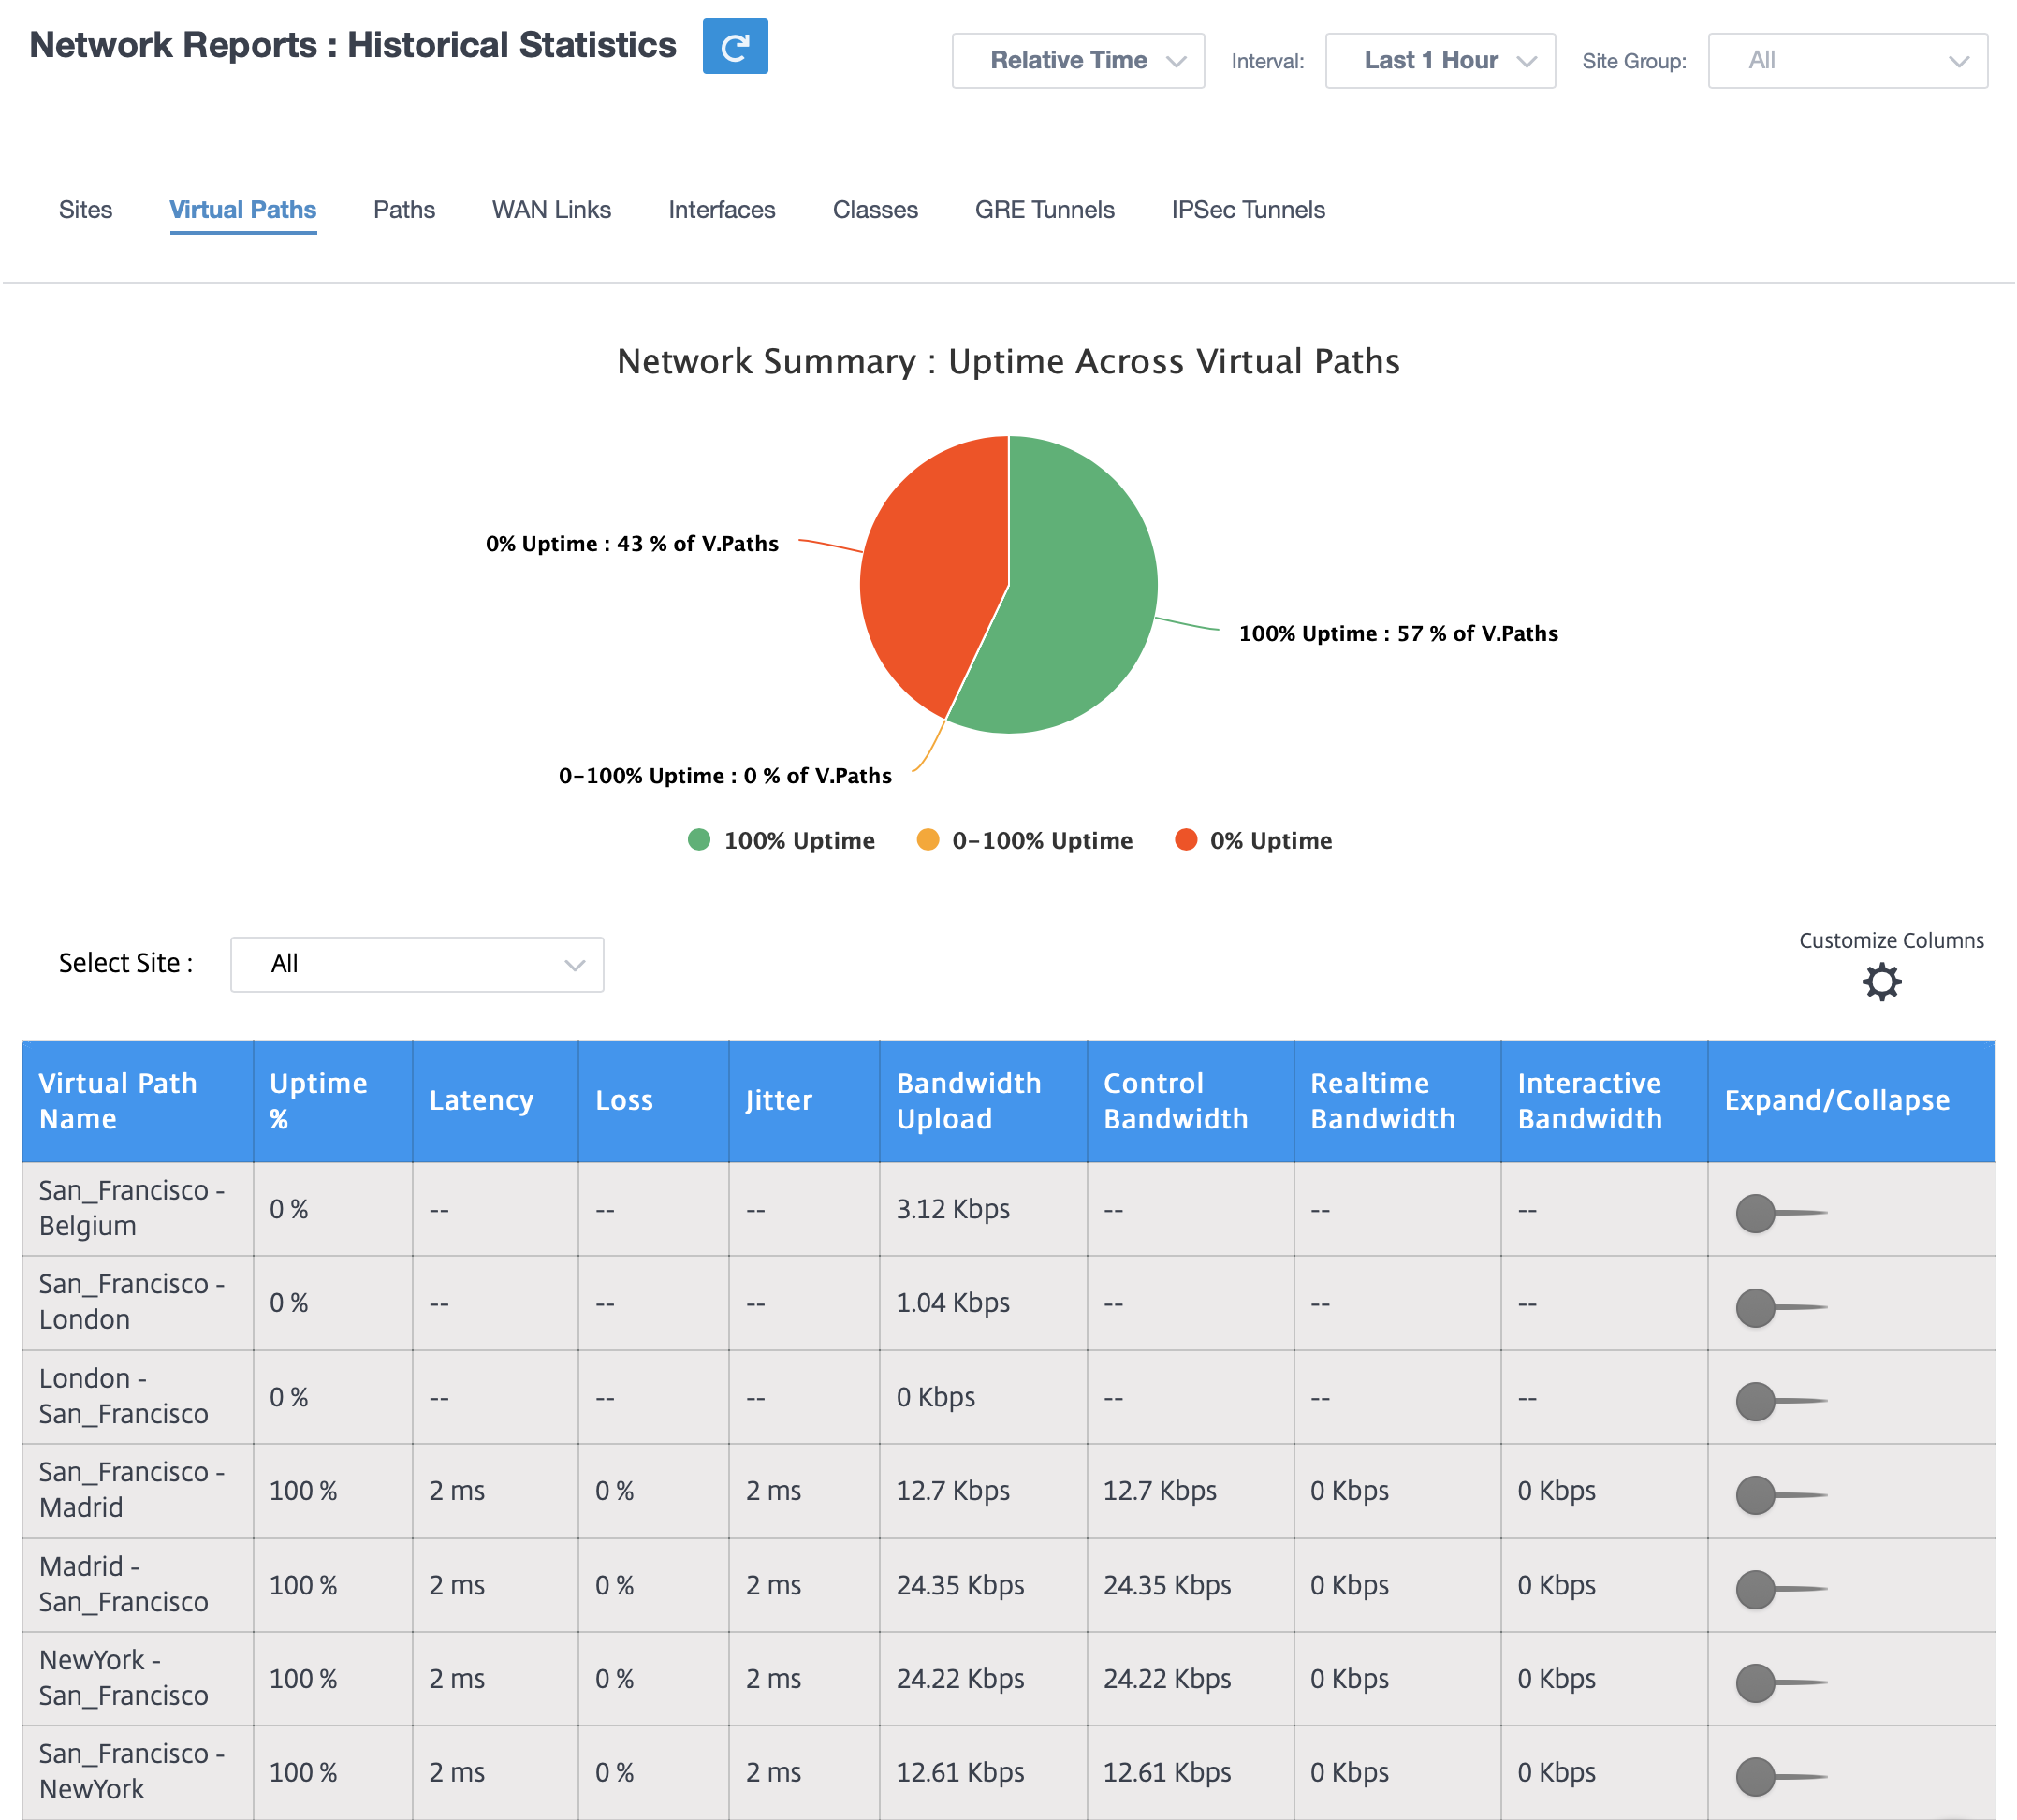
You can view the following metrics:
- Virtual Path Name: The virtual path name.
- Uptime %: Rate at which the virtual path is up.
- Latency: The latency in milliseconds for real-time traffic.
- Loss: Percentage of packets lost.
- Jitter: Variation in the delay of received packets, in milliseconds.
- Bandwidth Upload: Upload (LAN to WAN) Bandwidth usage for the selected time period.
- Control Bandwidth: Bandwidth used to transfer control packets that contain routing, scheduling, and link statistics information.
- Real-time Bandwidth: Bandwidth consumed by applications that belong to the real-time class type in the SD-WAN configuration. The performance of such applications depends on a great extent upon network latency. A delayed packet is worse than a lost packet (for example, VoIP, Skype for Business).
- Interactive Bandwidth: Bandwidth consumed by applications that belong to the interactive class type in the SD-WAN configuration. The performance of such applications depends on a great extent upon network latency, and packet loss (for example, XenDesktop®, XenApp).
- Bulk Bandwidth: Bandwidth consumed by applications that belong to the bulk class type in the SD-WAN configuration. These applications involve little human intervention and are handled by the systems themselves (for example, FTP, backup operations).
- Expand/Collapse: You can expand or collapse the data as needed.
Paths
To view the Paths statistics, navigate to Reports > Statistics > Paths tab.
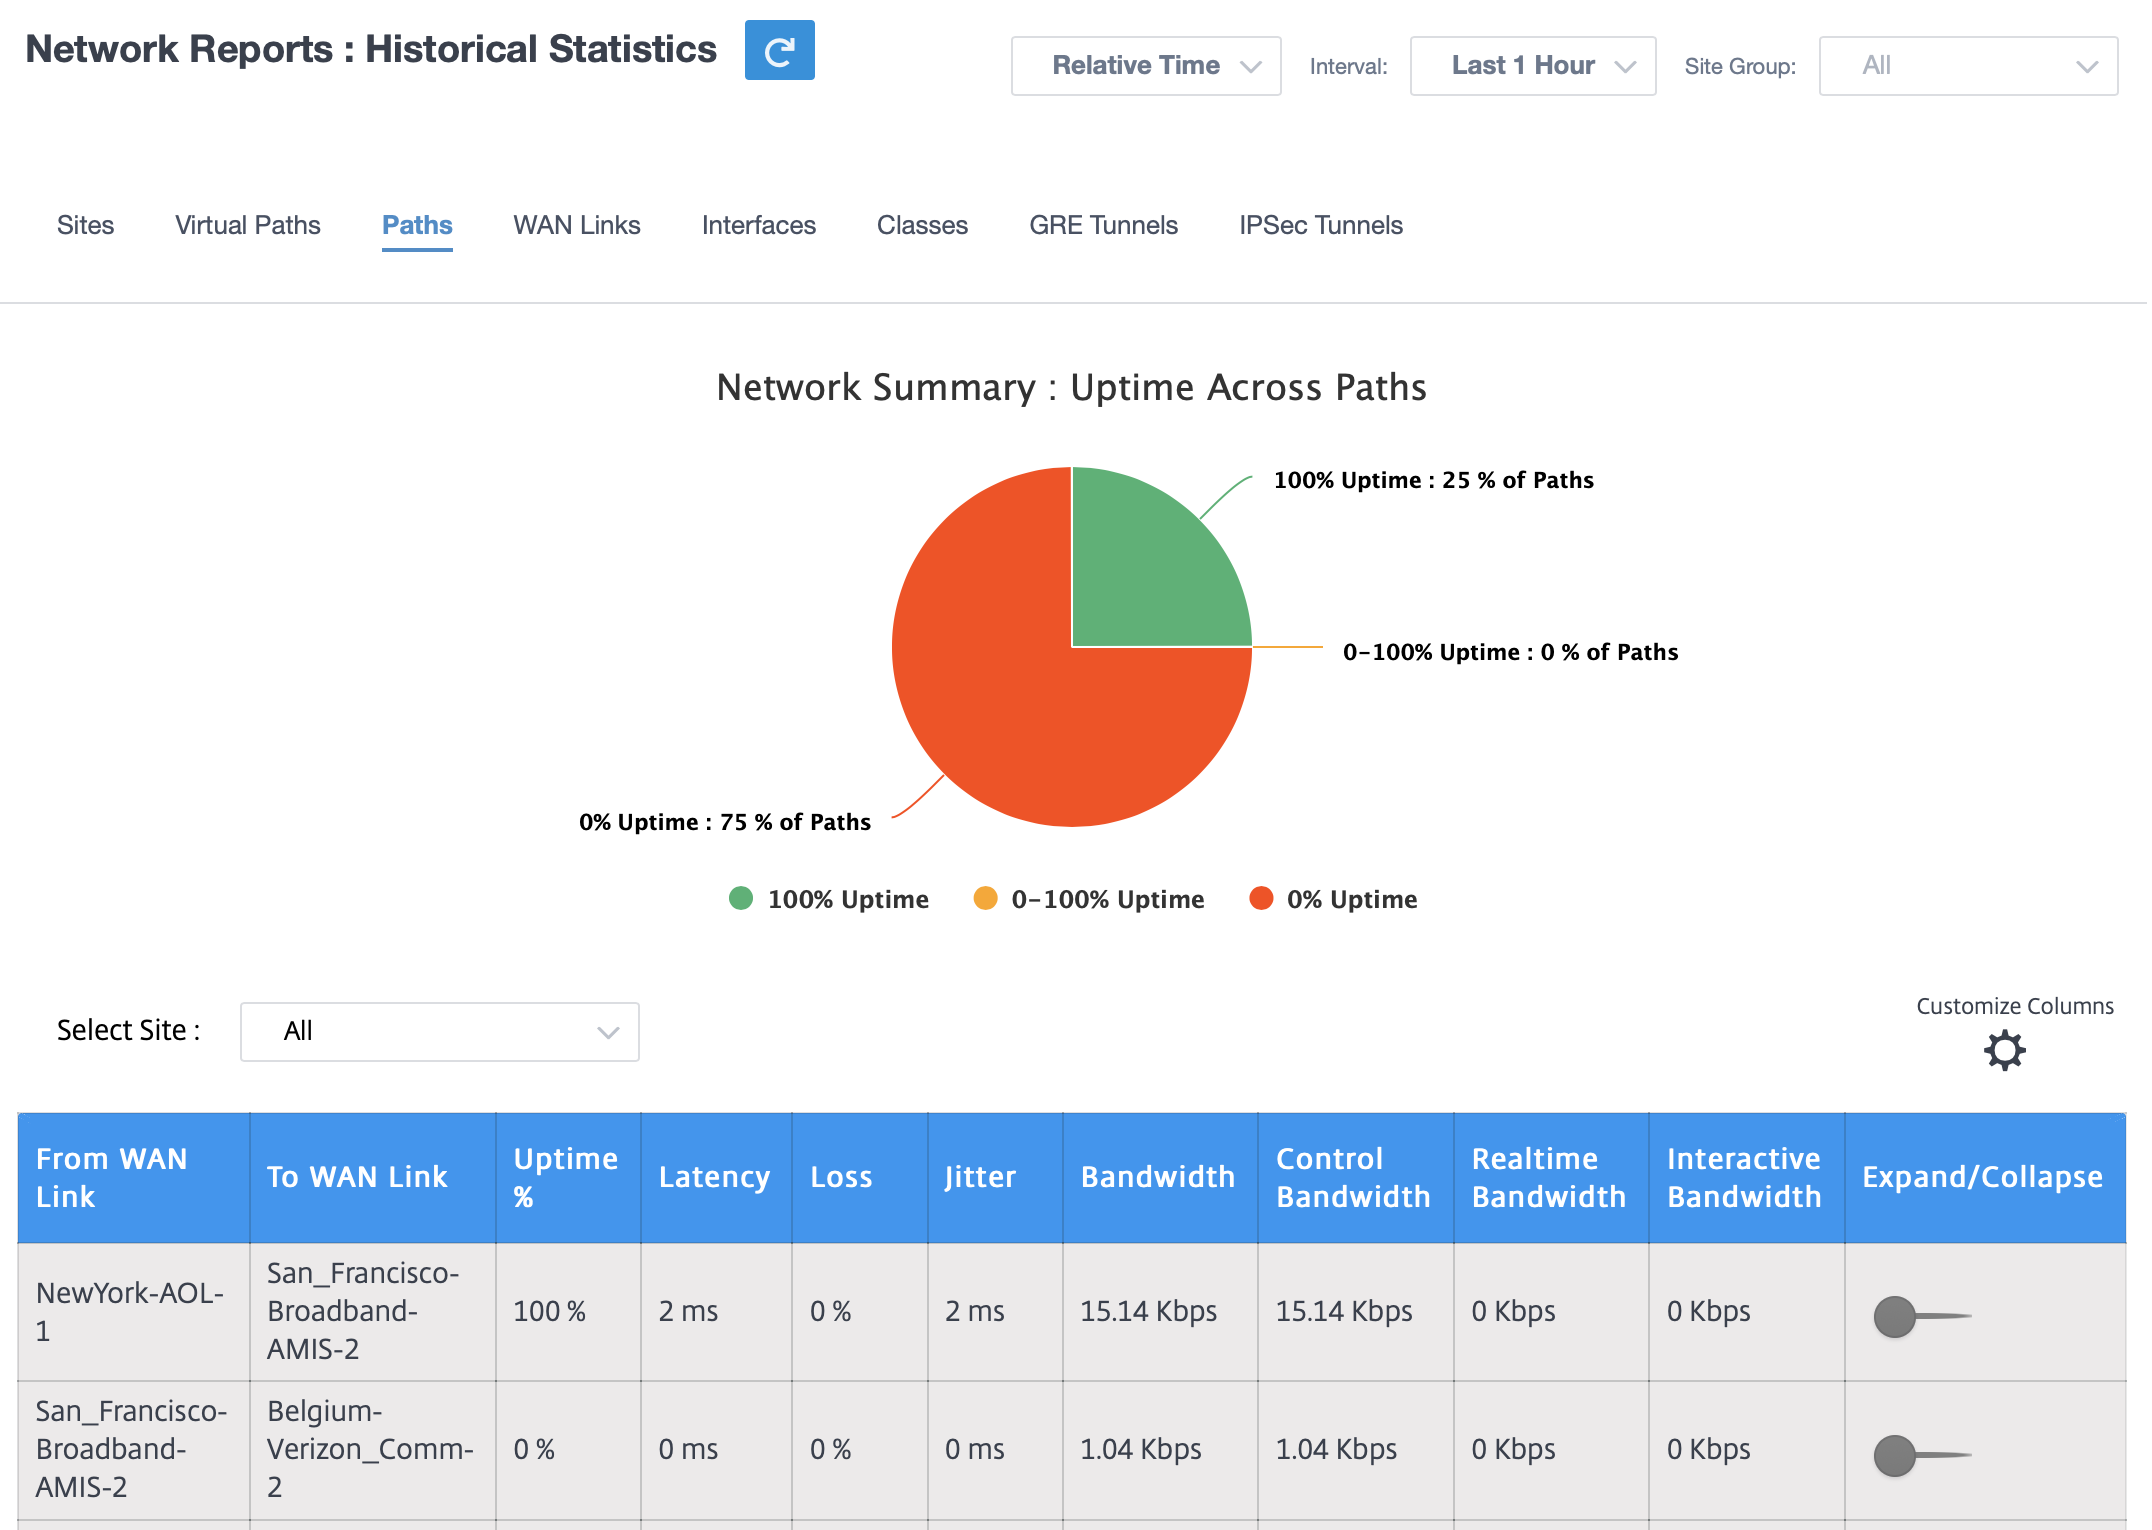
You can view the following metrics:
- From WAN Link: The source WAN link.
- To WAN Link: The destination WAN link.
- Uptime %: Rate at which the path is up.
- Latency: The latency in milliseconds for real time traffic.
- Loss: Percentage of packets lost.
- Jitter: Variation in the delay of received packets, in milliseconds.
- Bandwidth: Total bandwidth consumed by all packet types. Bandwidth= Control Bandwidth + Real-time Bandwidth + Interactive Bandwidth + Bulk Bandwidth.
- Control Bandwidth: Bandwidth used to transfer control packets that contain routing, scheduling, and link statistics information.
- Real-time Bandwidth: Bandwidth consumed by applications that belong to the real-time class type in the SD-WAN configuration. The performance of such applications depends on a great extent upon network latency. A delayed packet is worse than a lost packet (for example, VoIP, Skype for Business).
- Interactive Bandwidth: Bandwidth consumed by applications that belong to the interactive class type in the SD-WAN configuration. The performance of such applications depends on a great extent upon network latency, and packet loss (for example, XenDesktop, XenApp®).
- Bulk Bandwidth: Bandwidth consumed by applications that belong to the bulk class type in the SD-WAN configuration. These applications involve little human intervention and are handled by the systems themselves (for example, FTP, backup operations).
- Expand/Collapse: You can expand or collapse the data as needed.
WAN links
To view the statistics at WAN Link level, navigate to Reports > Statistics > WAN Links tab.
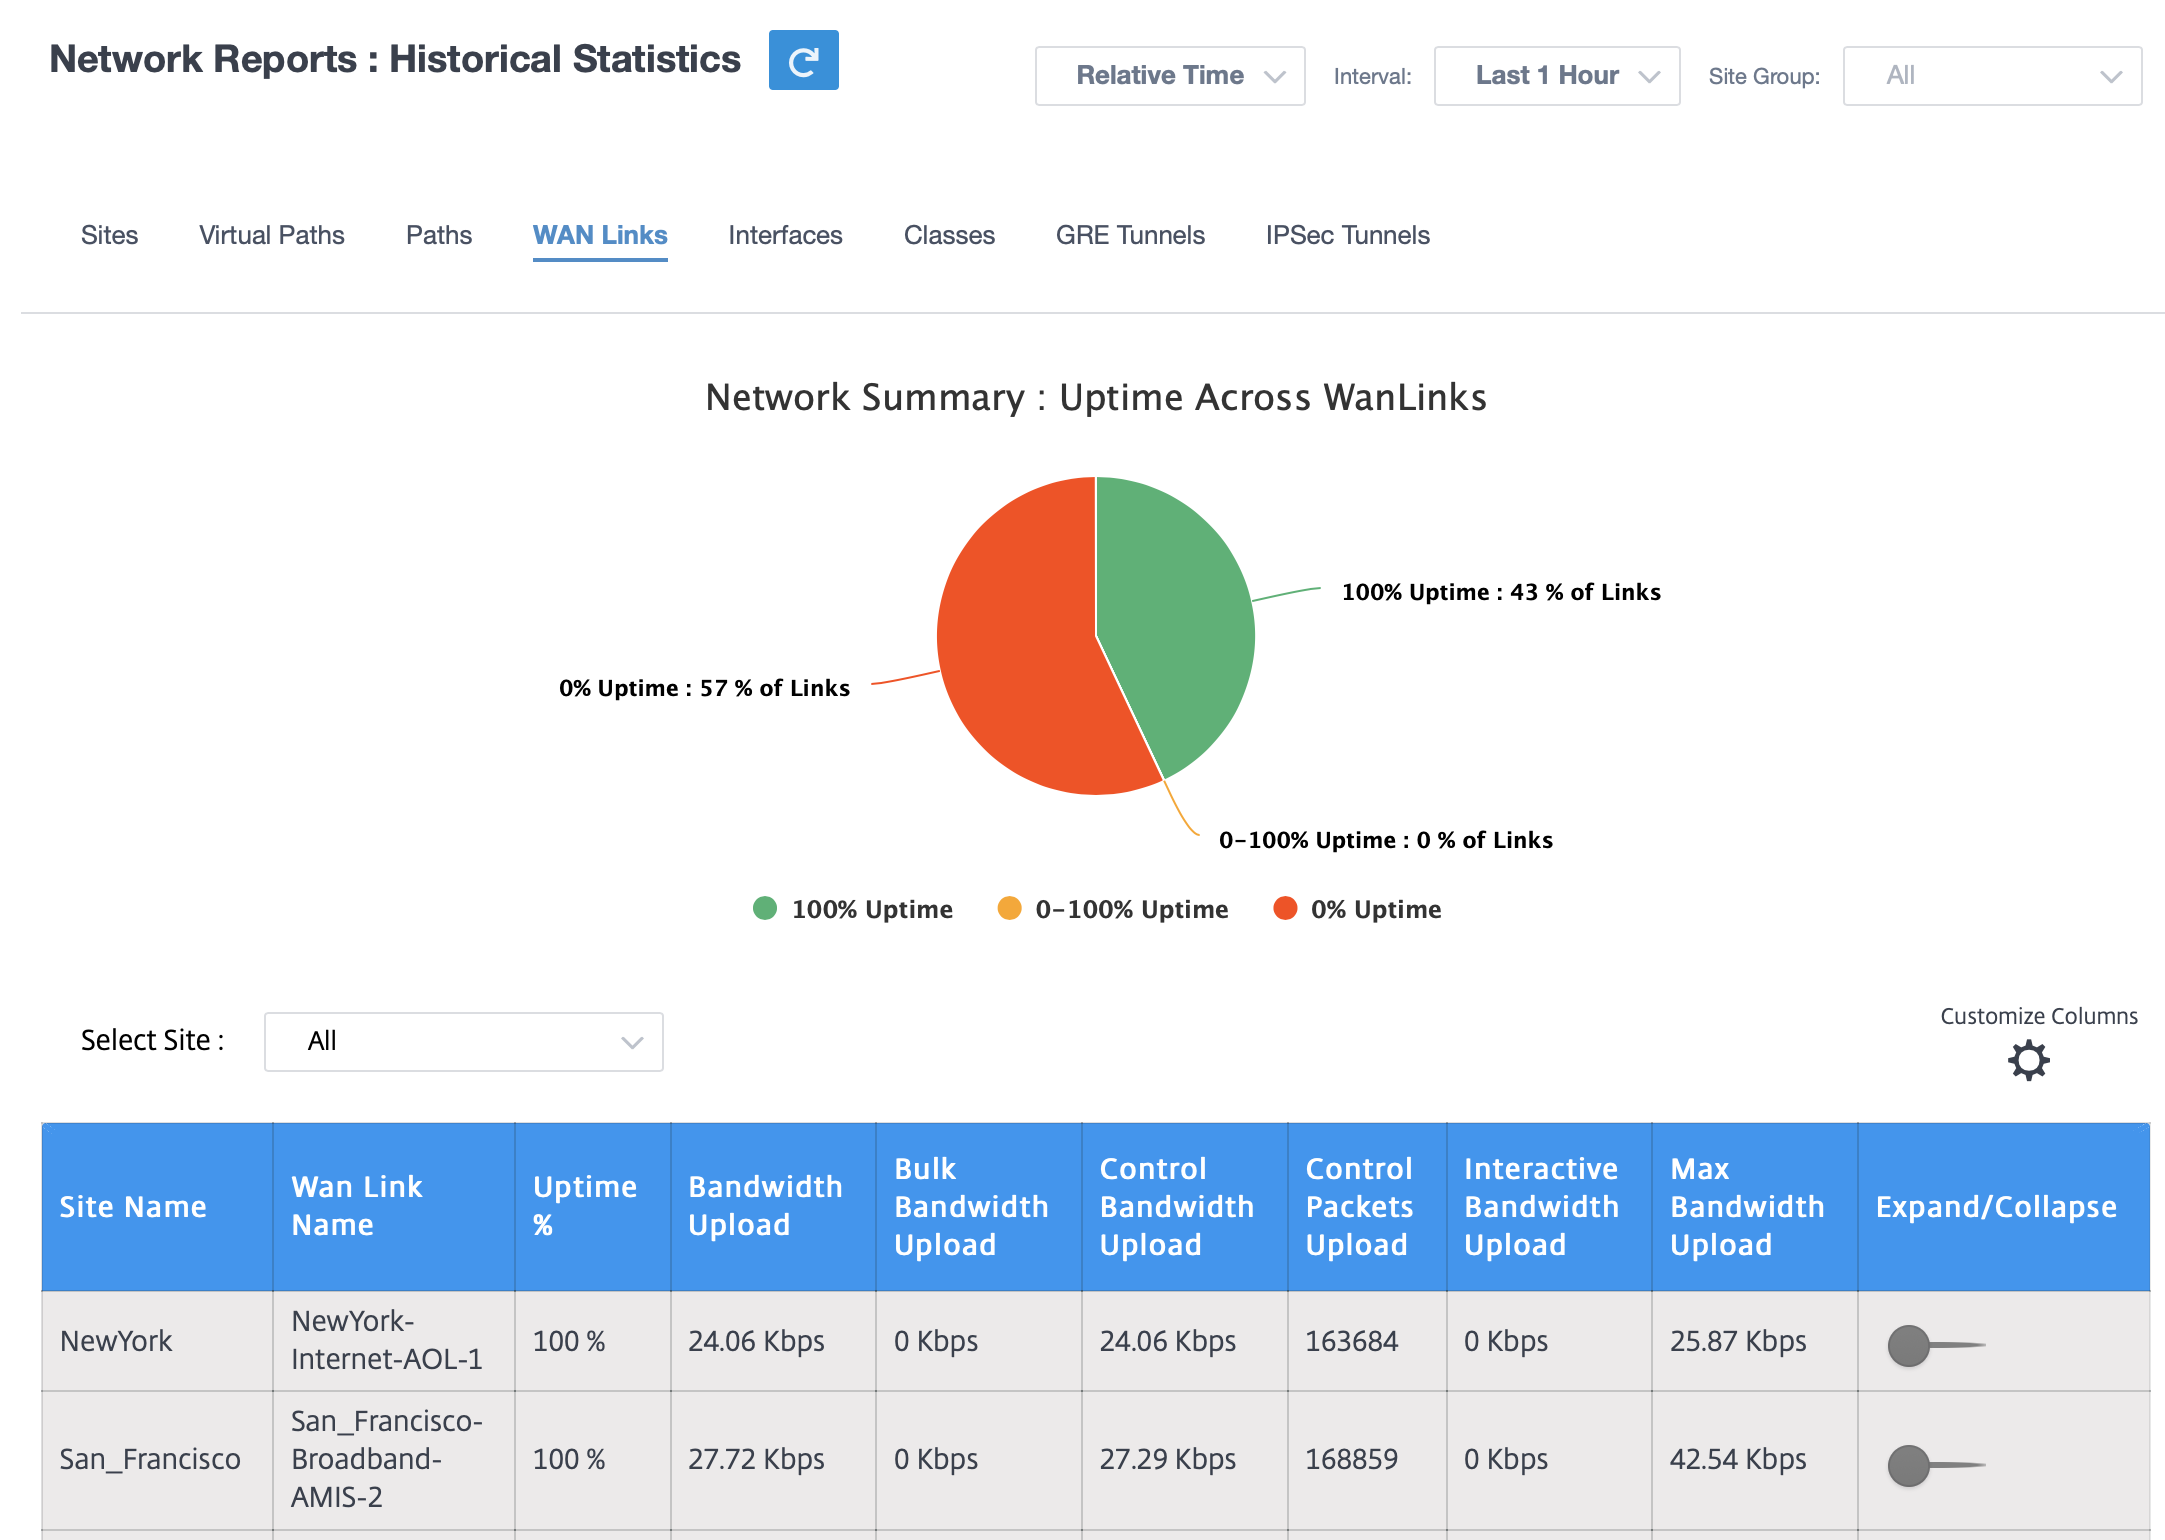
You can view the following metrics:
- WAN Link Name: The path name.
- Uptime %: Rate at which the WAN link is up.
- Bandwidth Upload: Upload (LAN to WAN) Bandwidth usage for the selected time period.
- Bulk Bandwidth Upload: Upload (LAN to WAN) Virtual Path Bandwidth used by Bulk traffic for the selected time period.
- Control Bandwidth Upload: Upload (LAN to WAN) Virtual Path Bandwidth used by Control traffic for the selected time period.
- Control Packets Upload: Upload (LAN to WAN) Virtual Path Control packets for the selected time period.
- Interactive Bandwidth Upload: Upload (LAN to WAN) Virtual Path Bandwidth used by Interactive traffic for the selected time period.
- Max Bandwidth Upload: Max Upload (LAN to WAN) Bandwidth used in a minute for the selected time period.
- Expand/Collapse: You can expand or collapse the data as needed.
Interfaces
The Interfaces statistic report helps you during troubleshooting to quickly see whether any of the ports are down. You can also view the transmitted and received bandwidth, or packet details at each port. You can also view the number of errors that occurred on these interfaces during a certain time period.
To view Interface statistics, navigate to Reports > Statistics > Interfaces tab.
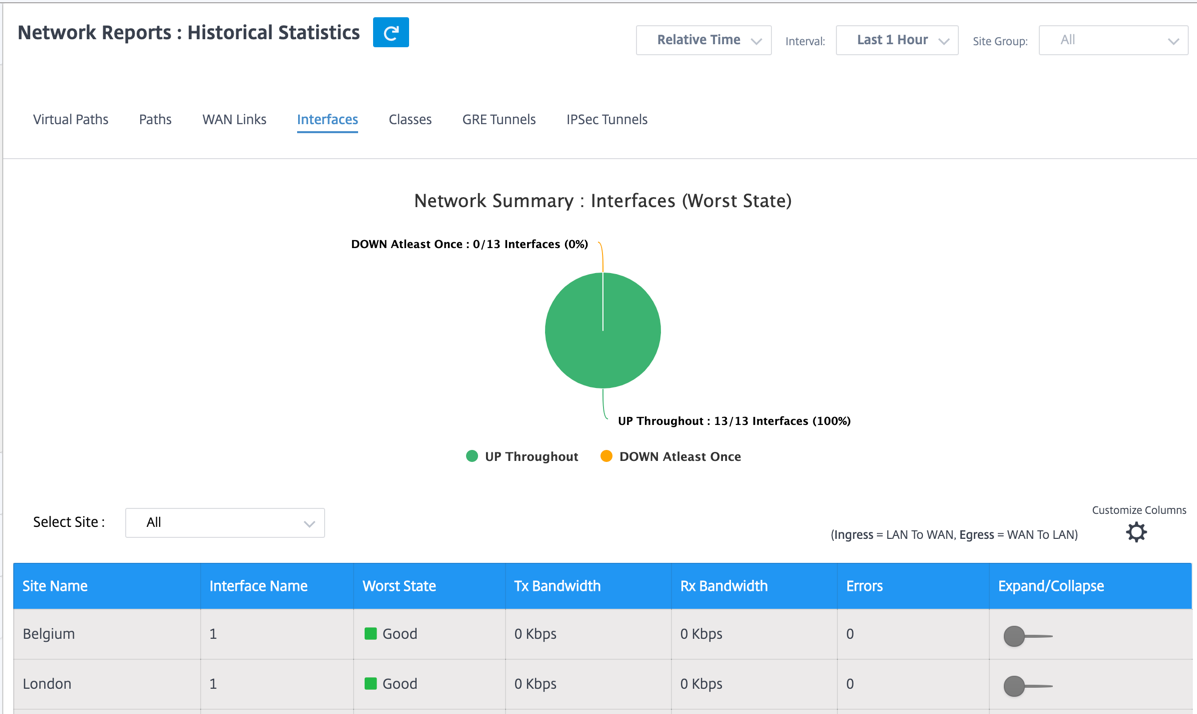
You can view the following metrics:
- Interface Name: The name of the Ethernet interface.
- Tx Bandwidth: Bandwidth transmitted.
- Rx Bandwidth: Bandwidth received.
- Errors: Number of errors observed during the selected time period.
- Expand/Collapse: You can expand or collapse the data as needed.
Classes
The virtual services can be assigned to particular QoS classes, and different bandwidth restraints can be applied to different classes.
To view Class statistics, navigate to Reports > Statistics > Classes tab.
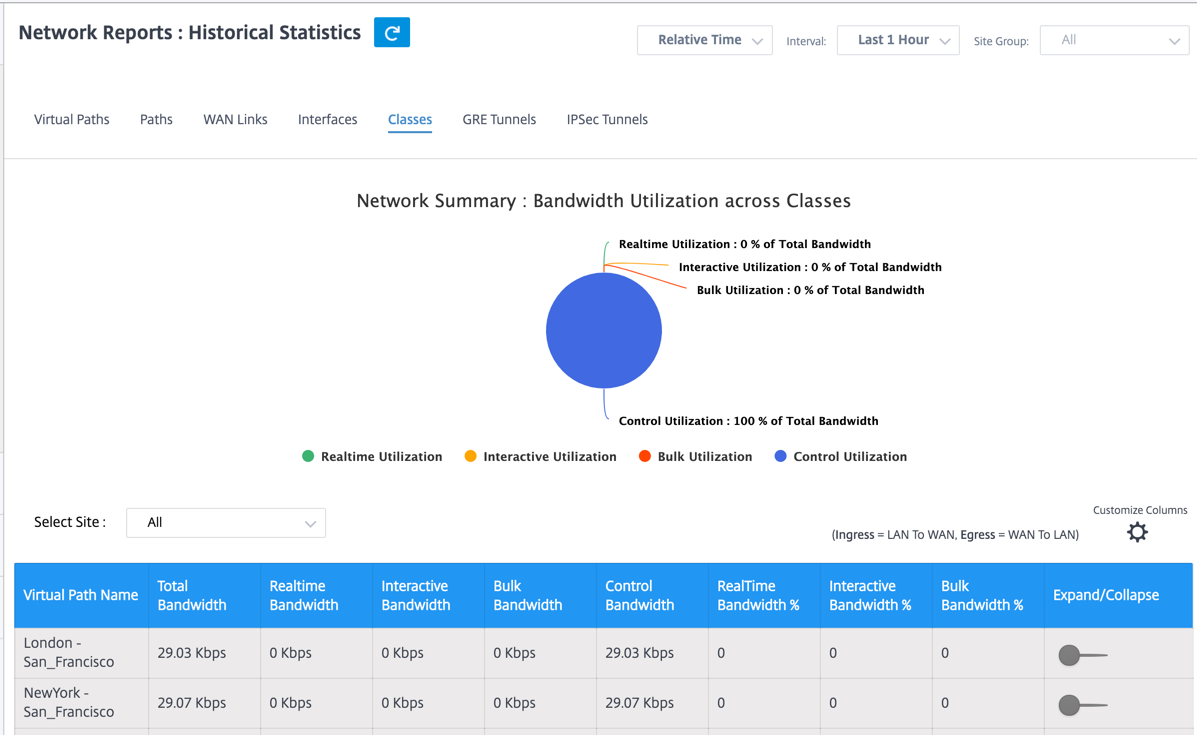
You can view the following metrics:
- Virtual Path Name: Name of the virtual path.
- Total Bandwidth: Total bandwidth consumed by all packet types. Bandwidth = Control Bandwidth + Real-time Bandwidth + Interactive Bandwidth + Bulk Bandwidth.
- Realtime Bandwidth: Bandwidth consumed by applications that belong to the real-time class type in the SD-WAN configuration. The performance of such applications depends on a great extent upon network latency. A delayed packet is worse than a lost packet (for example, VoIP, Skype for Business).
- Interactive Bandwidth: Bandwidth consumed by applications that belong to the interactive class type in the SD-WAN configuration. The performance of such applications depends on a great extent upon network latency, and packet loss (for example, XenDesktop, XenApp).
- Bulk Bandwidth: Bandwidth consumed by applications that belong to the bulk class type in the SD-WAN configuration. These applications involve little human intervention and are handled by the systems themselves (for example, FTP, backup operations).
- Control Bandwidth: Bandwidth used to transfer control packets that contain routing, scheduling, and link statistics information.
- Realtime Bandwidth %: Rate at which bandwidth is consumed by applications that belong to the real-time class type in the Citrix SD-WAN configuration.
- Interactive Bandwidth %: Rate at which bandwidth is consumed by applications that belong to the interactive class type in the Citrix SD-WAN configuration.
- Bulk Bandwidth %: Rate at which bandwidth consumed by applications that belong to the bulk class type in the Citrix SD-WAN configuration.
- Expand/Collapse: You can expand or collapse the data as needed.
GRE tunnels
You can use a tunneling mechanism to transport packets of one protocol within another protocol. The protocol that carries the other protocol is called the transport protocol, and the carried protocol is called the passenger protocol. Generic Routing Encapsulation (GRE) is a tunneling mechanism that uses IP as the transport protocol and can carry many different passenger protocols.
The tunnel source address and destination address are used to identify the two endpoints of the virtual point-to-point links in the tunnel. For more information about configuring GRE tunnels on Citrix SD-WAN appliances, see GRE Tunnel.
To view GRE Tunnel statistics, navigate to Reports > Statistics > GRE Tunnels tab.
You can view the following metrics:
- Site Name: The site name.
- Tx Bandwidth: Bandwidth transmitted.
- Rx Bandwidth: Bandwidth received.
- Packet Dropped: Number of packets dropped, because of network congestion.
- Packets Fragmented: Number of packets fragmented. Packets are fragmented to create smaller packets that can pass through a link with an MTU that is smaller than the original datagram. The fragments are reassembled by the receiving host.
- Expand/Collapse: You can expand or collapse the data as needed.
IPsec tunnels
IP Security (IPsec) protocols provide security services such as encrypting sensitive data, authentication, protection against replay, and data confidentiality for IP packets. Encapsulating Security Payload (ESP), and Authentication Header (AH) are the two IPsec security protocols used to provide these security services.
In IPsec tunnel mode, the entire original IP packet is protected by IPsec. The original IP packet is wrapped and encrypted, and a new IP header is added before transmitting the packet through the VPN tunnel. For more information about configuring IPsec tunnels on Citrix SD-WAN appliances, see IPsec Tunnel Termination.
To view IPsec Tunnel statistics, navigate to Reporting > statistics > IPsec Tunnels tab.
You can view the following metrics:
- Tunnel Name: The tunnel name.
- Tunnel State: IPsec tunnel state.
- MTU: Maximum transmission unit—size of the largest IP datagram that can be transferred through a specific link.
- Packet Received: Number of packets received.
- Packets Sent: Number of packets Sent.
- Packet Dropped: Number of packets dropped, because of network congestion.
- Bytes Dropped: Number of bytes dropped.
- Expand/Collapse: You can expand or collapse the data as needed.
Real time statistics
Network statistics
The Network Statistics page provides the following real time statistics information under Reports > Real Time > Network Statistics:
- Sites
- Virtual Paths
- WAN Member Paths
- WAN Links
- WAN Link Usage
- MPLS Queues
- Access Interfaces
- Interfaces
- Intranet
- IPsec Tunnel
- GRE
To get a real time statistical report, go to the required tab (such as sites, virtual paths, WAN links), select the site from the drop-down list, and click Retrieve latest data.
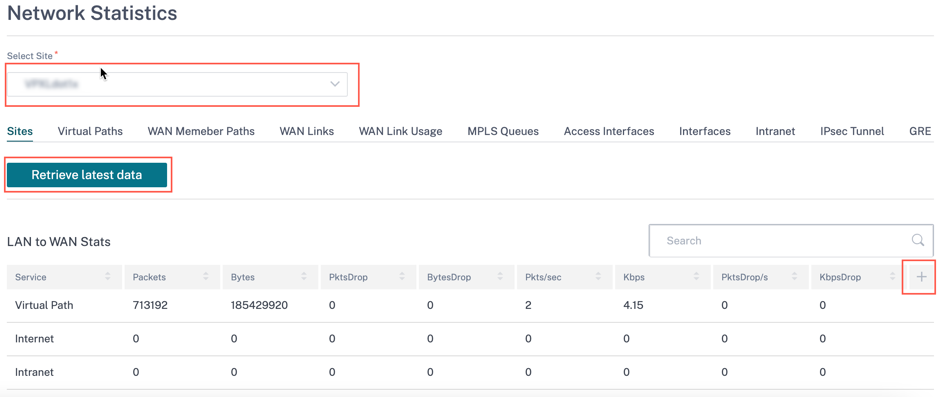
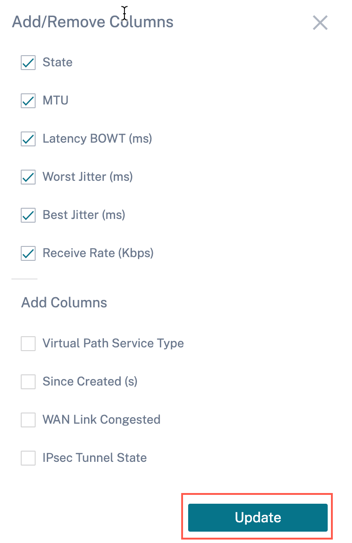
Click the plus (+) symbol if you want to add or remove any column from the statistics table and click Update.
Application statistics
The Application Statistics page provides the following real time statistics information under Reports > Real Time > App Statistics:
- Applications
- App QoS
- QoS Classes
- QoS Rules
- Rule Groups
To get a real time statistical report, go to the required tab (such as applications, QoS rule, QoS classes) select the site from the drop-down list, and click Retrieve latest data.
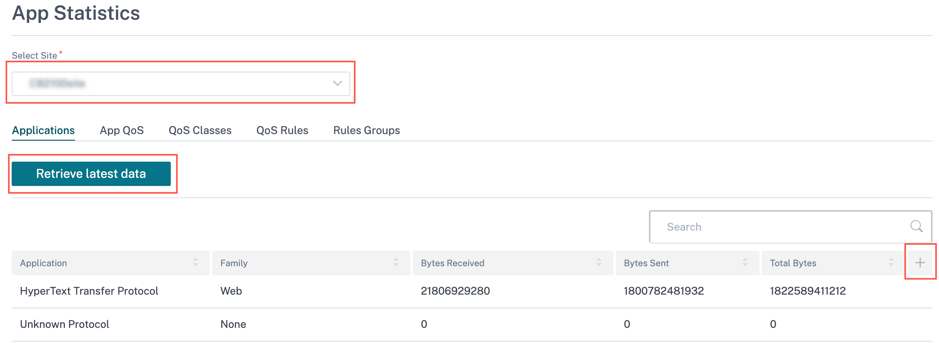
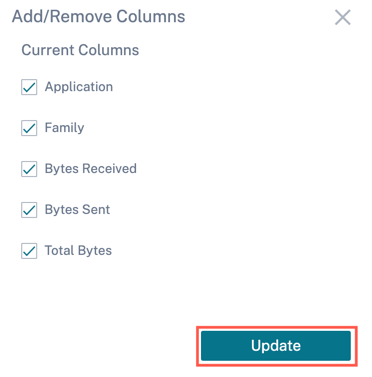
Click the plus (+) symbol if you want to add or remove any column from the statistics table and click Update.
Routes statistics
The Routes Statistics page provides the following real time statistics information under Reports > Real Time > Routes Statistics:
- ARP
- Routes
- Application Routes
- Observed Protocols
- Multicast Group
- NDP Rules Groups
To get a real time statistical report, go to the required tab (such as ARP, Routes, Application Routes) select the site from the drop-down list, and click Retrieve latest data.
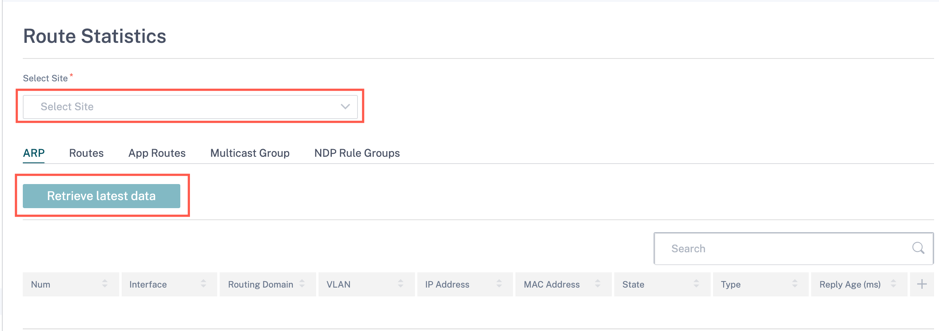
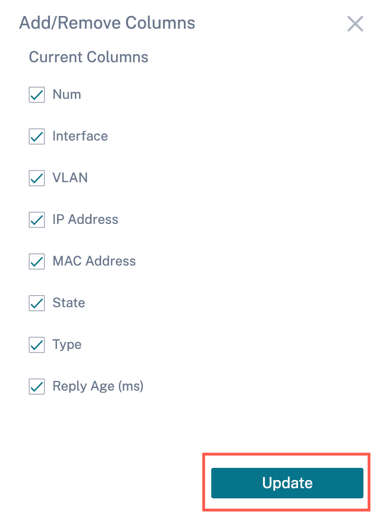
Click the plus (+) symbol if you want to add or remove any column from the statistics table and click Update.
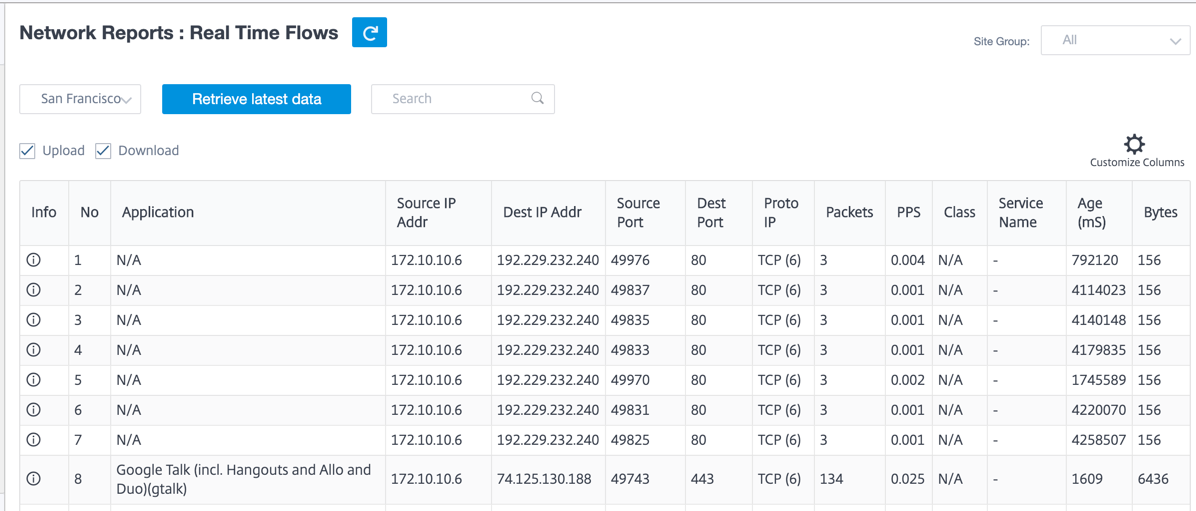
Flows
At the network level, select the site from the drop-down list before you can fetch the statistics. The Flows feature provides unidirectional flow information related to a particular session going through the appliance. This provides information on the destination service type the flow is falling into and also the information related to the rule and class type and also the transmission mode.
Firewall statistics
The Firewall statistics provide the state of the connection, Network Address Protocol (NAT) policies, and filter policies related to a particular session based on the firewall action configured. Firewall statistics also provide complete details about the source and destination of the connection.
To get the real time statistic report, select the site > select the statistics type from the drop-down list (Connection, NAT Policies, Filter Policies) > select the number for maximum entries to display, and click Retrieve latest data.
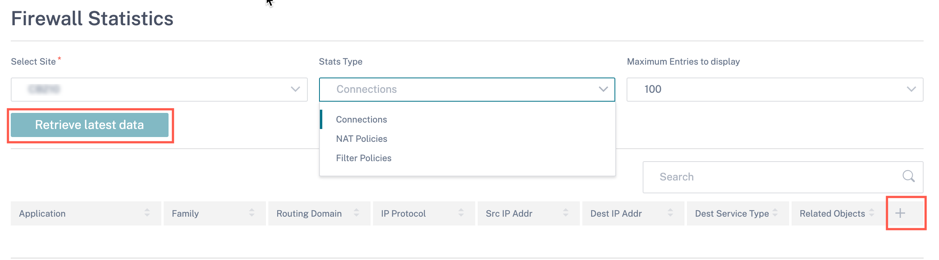
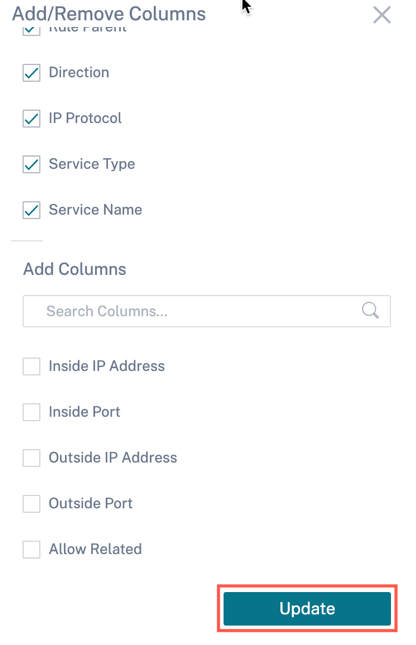
Click the plus (+) symbol if you want to add or remove any column from the statistics table and click Update.
Cloud Direct
The Cloud Direct report provides the summary of the Cloud Direct sites that are deployed in the network, along with the details about subscription used and the current operational status of those sites.
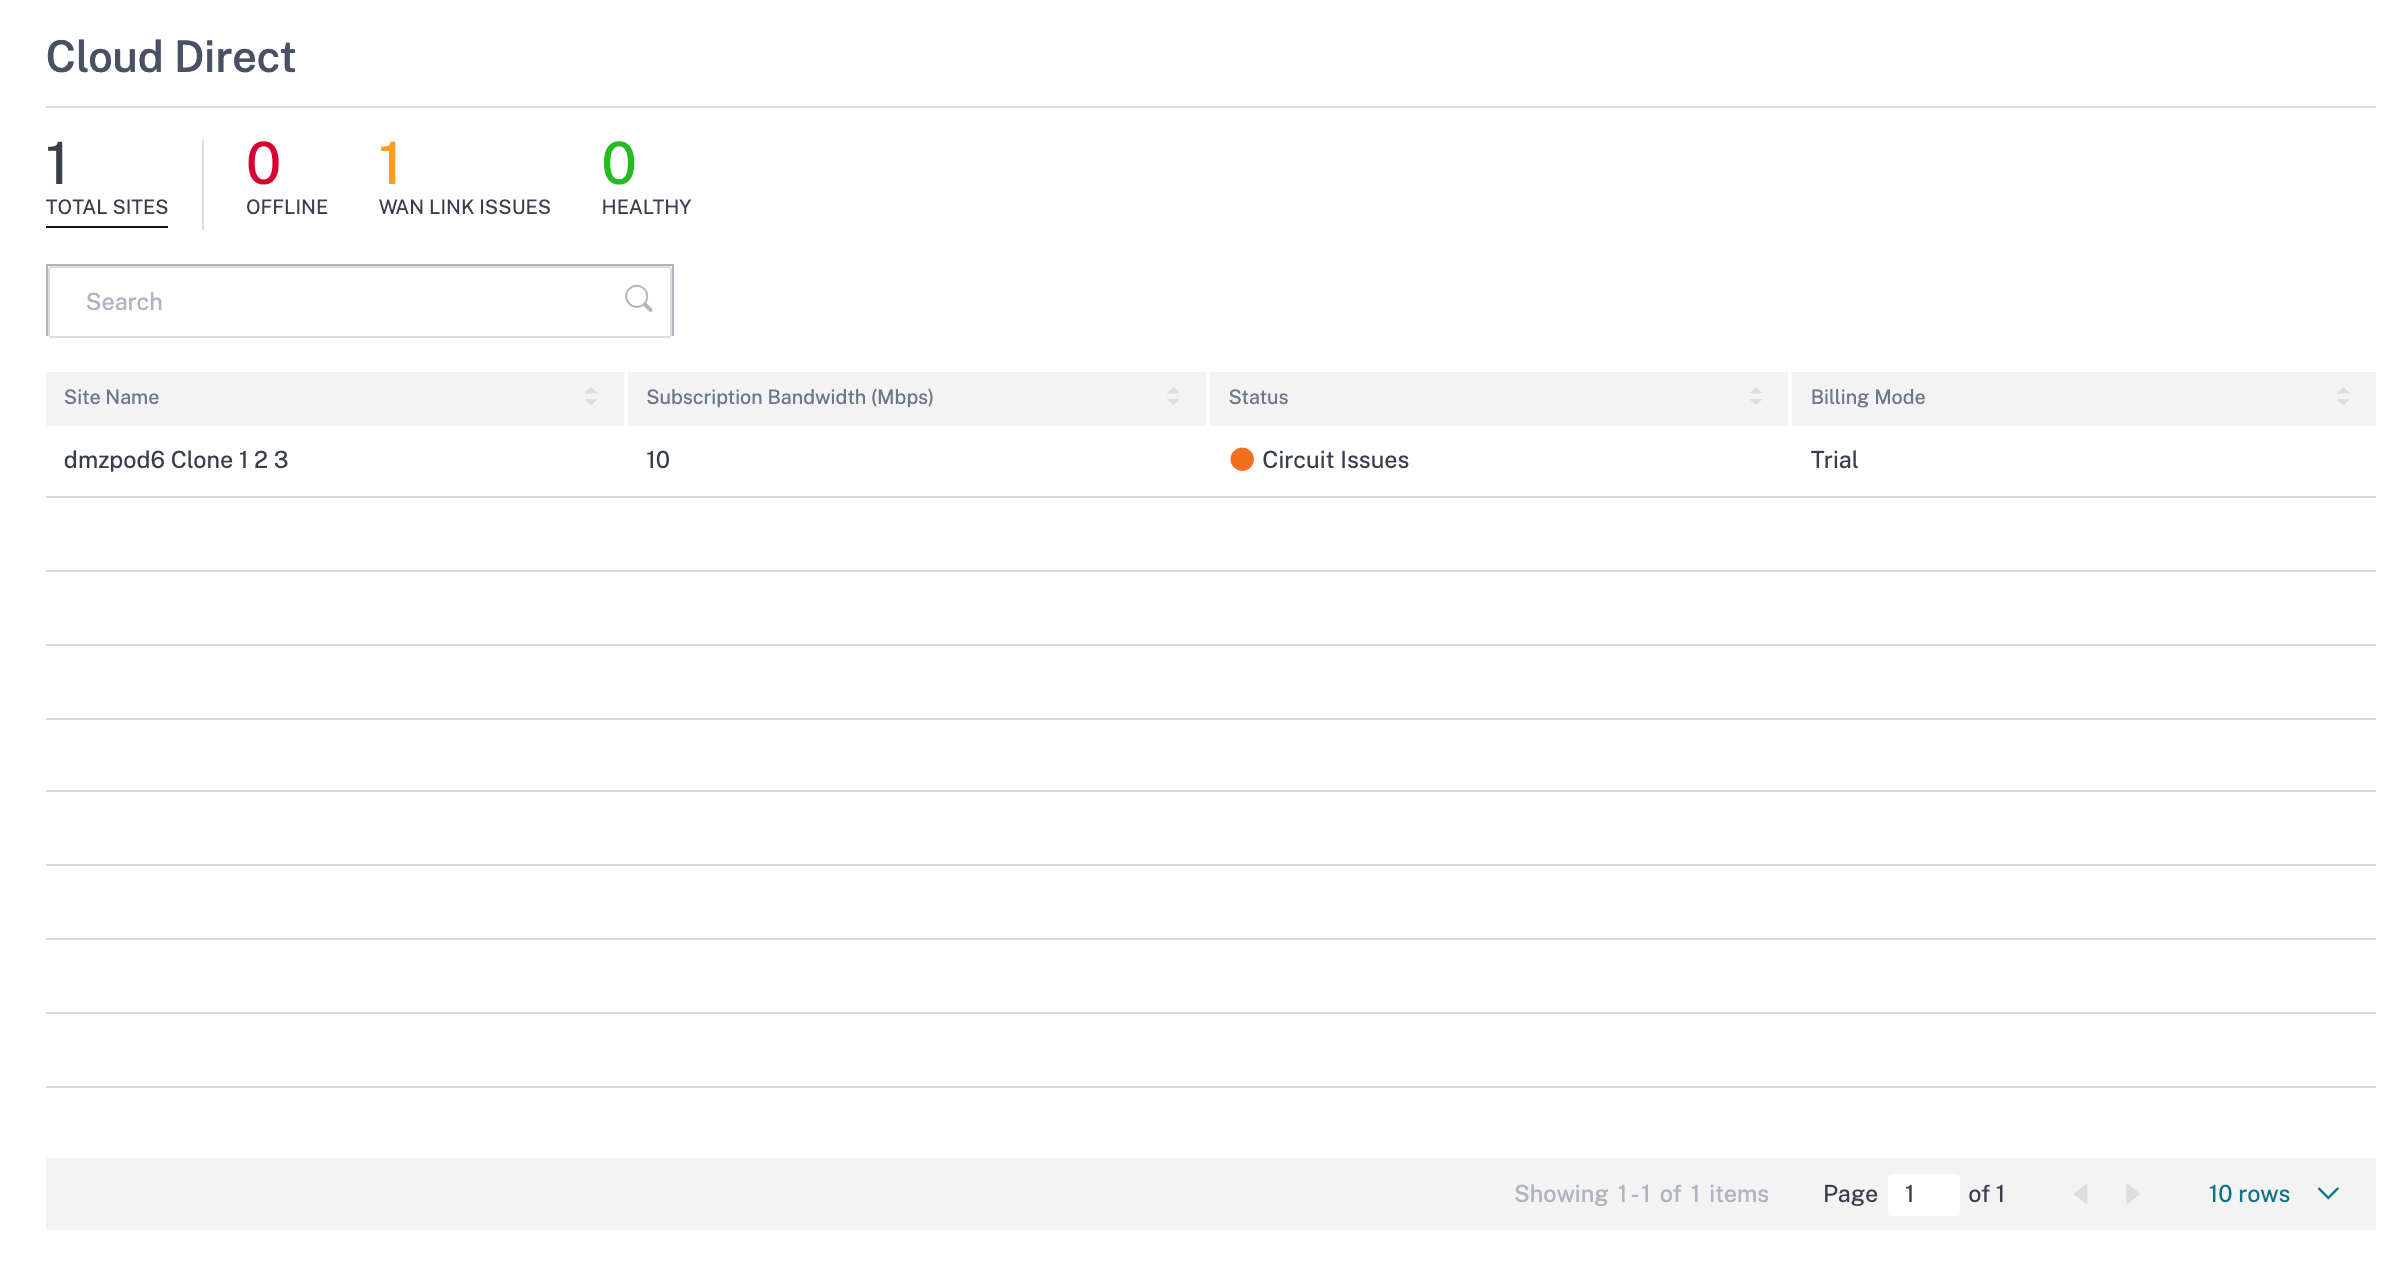
- Site Name – Displays the site name.
- Subscription Bandwidth (Mbps) – Displays the subscription bandwidth that is associated with the licensing for the Cloud Direct service.
- Status – Displays the site status (active/inactive).
- Billing Mode – Displays the billing mode (Demo/Production). The Billing Mode option enables the use of Cloud Direct trial/evaluation licenses. Sites operating with Cloud Direct evaluation licenses must be set to the Demo Billing Mode option. Sites upgrading to full Cloud Direct subscription licenses must be set to the Production Billing Mode option.
Application Quality
Application QoE is a measure of Quality of Experience of applications in the SD-WAN network. It measures the quality of applications that flow through the virtual paths between two SD-WAN appliances. The Application QoE score is a value between 0 and 10. The score range that it falls in determines the quality of an application. Application QoE enables network administrators to review the quality of experience of applications and take proactive measures when the quality goes below the acceptable threshold.
| Quality | Range | Color Coding |
|---|---|---|
| Good | 8–10 | Green |
| Fair | 4–8 | Orange |
| Poor | 0–4 | Red |
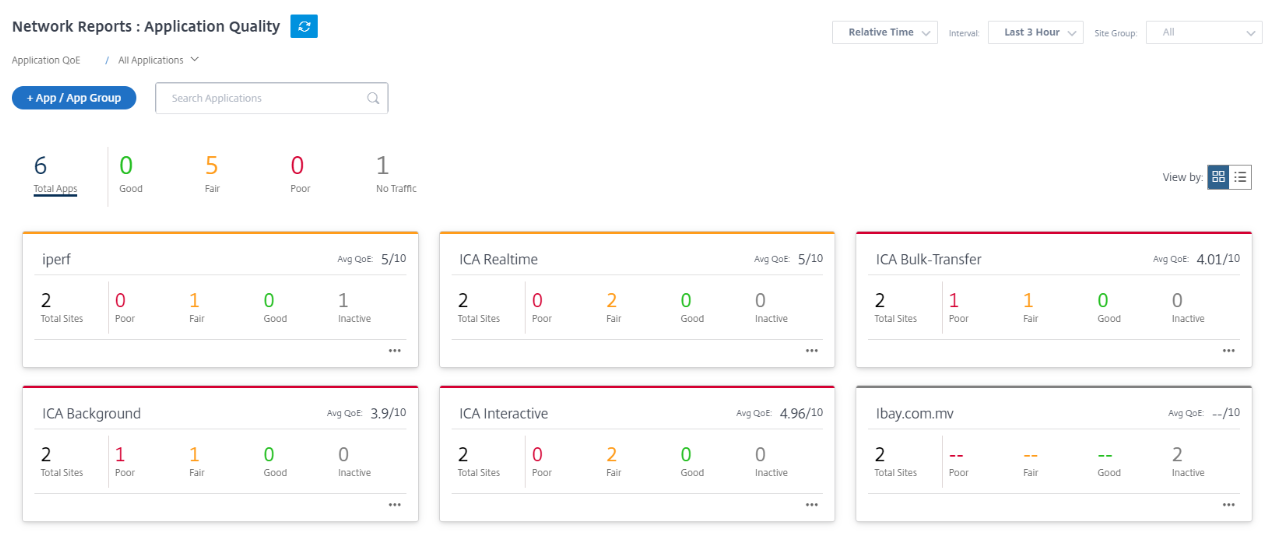
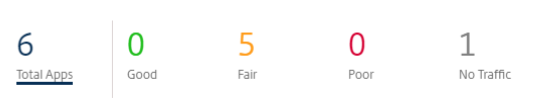
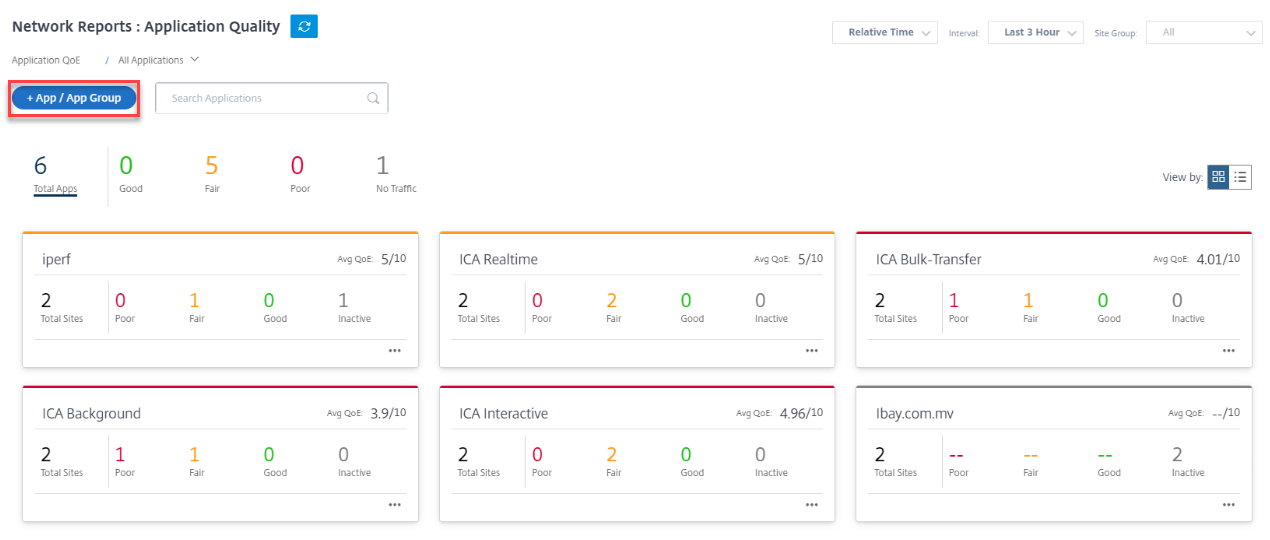
The top of the dashboard displays the overall number of applications and the number of applications that have good, fair, or poor Application QoE in the network. It also displays the number of applications that do not have any traffic.
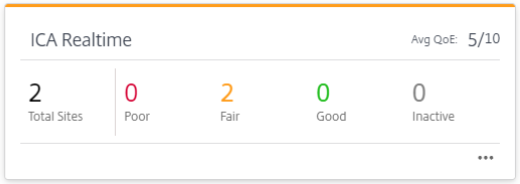
The individual application card displays the number of sites that have poor, fair, or good Application QoE for the specific application. It also displays the number of sites that are not actively using the application. The Avg QoE is the average QoE score of the application across all the sites in the network.
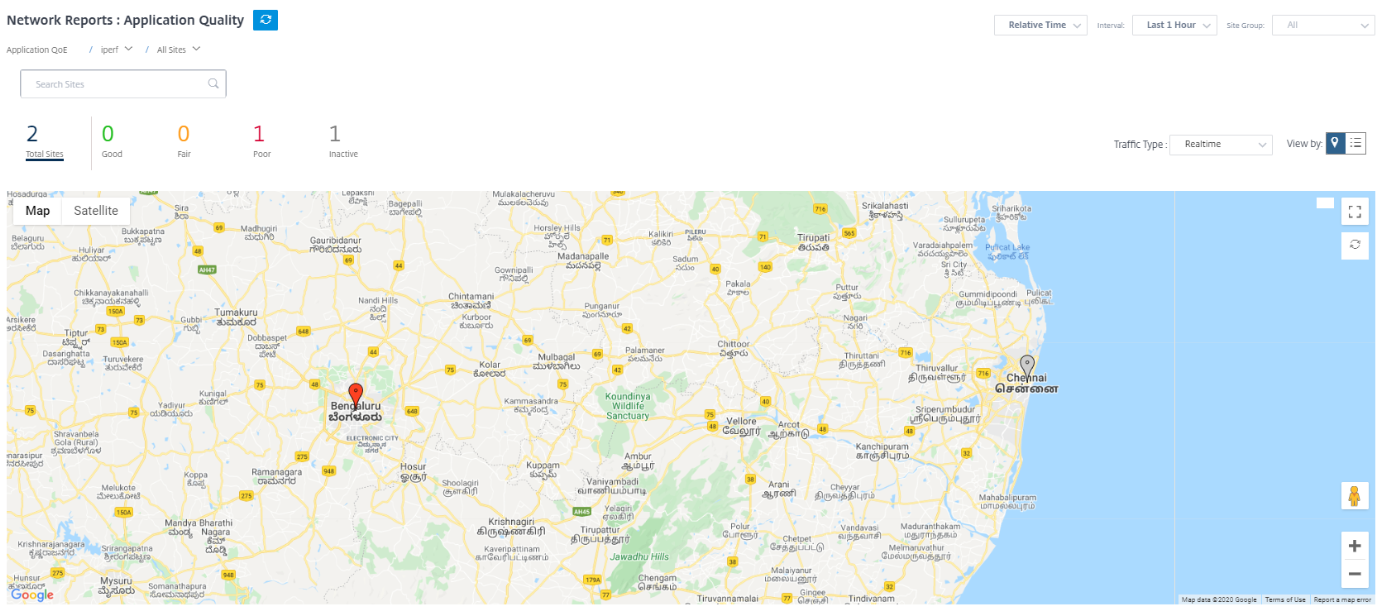
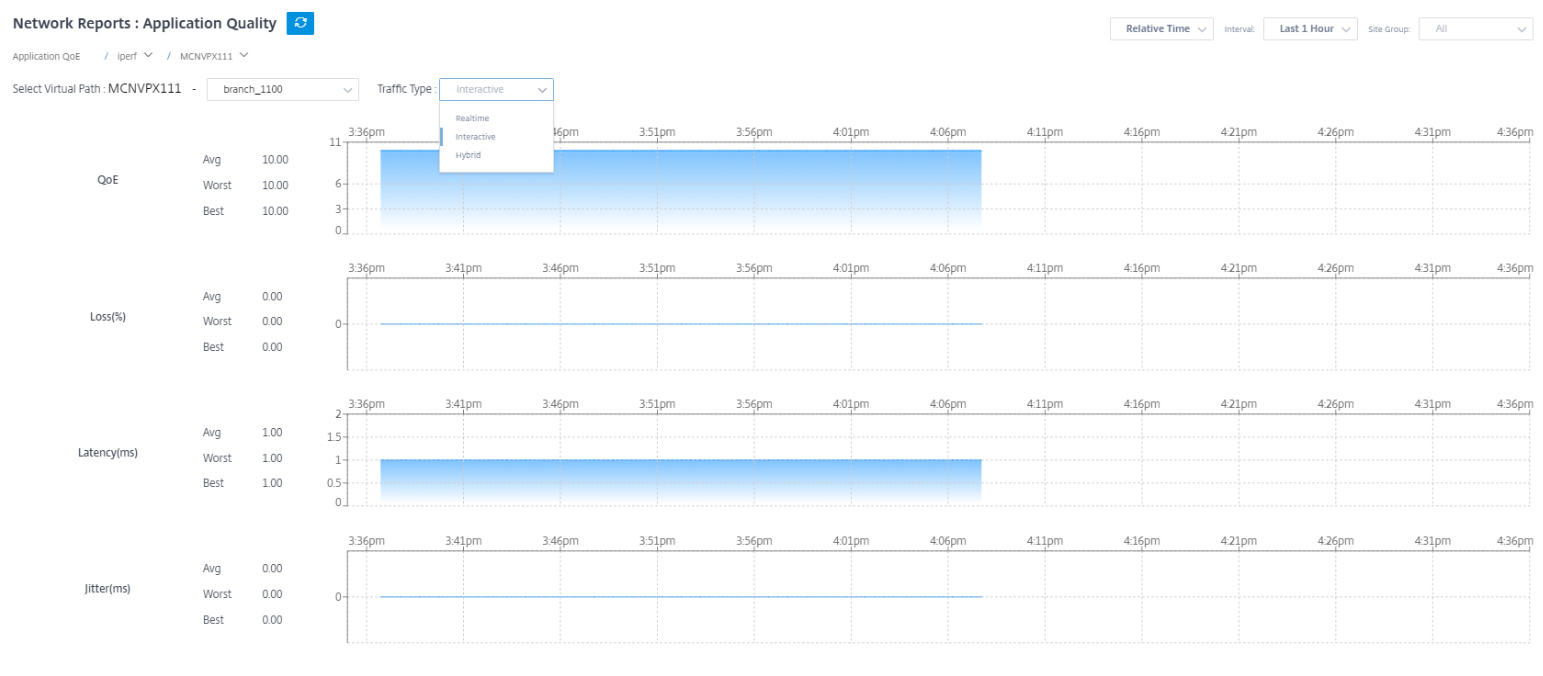
Click an individual application card to view the details on the number of sites that have good, fair, or poor application QoE for the selected application. A map view of all the sites that is running the selected application is displayed. Click a site in the map to further drill down and view the Application QoE statistics of the various virtual paths at the site.
You can view the following metrics for Real-time, Interactive, and Hybrid traffic for the selected timeframe:
- QoE: The QoE score for the traffic.
- Loss: The loss percentage for the traffic.
- Latency: The latency in milliseconds for the traffic.
- Jitter: The jitter observed in milliseconds for the traffic.
Application QoE profiles
Click + App / App Group to map applications, custom applications, or application groups to the default or custom QoE profiles.
The QoE profiles define the threshold for real-time, interactive, and hybrid traffic. The QoE thresholds as per the QoE profiles are applied to the selected application or application group.
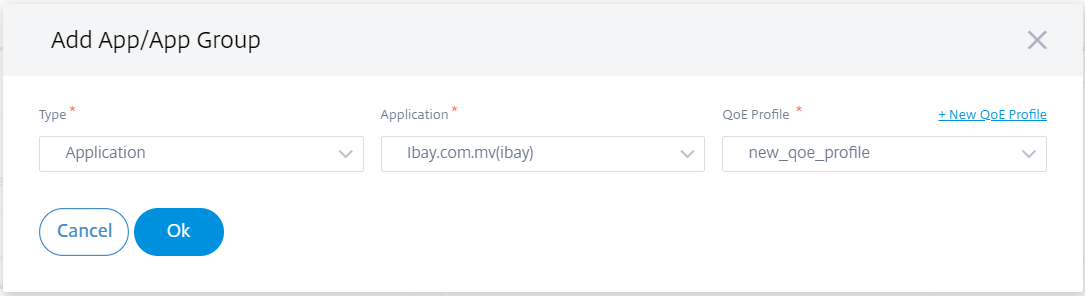
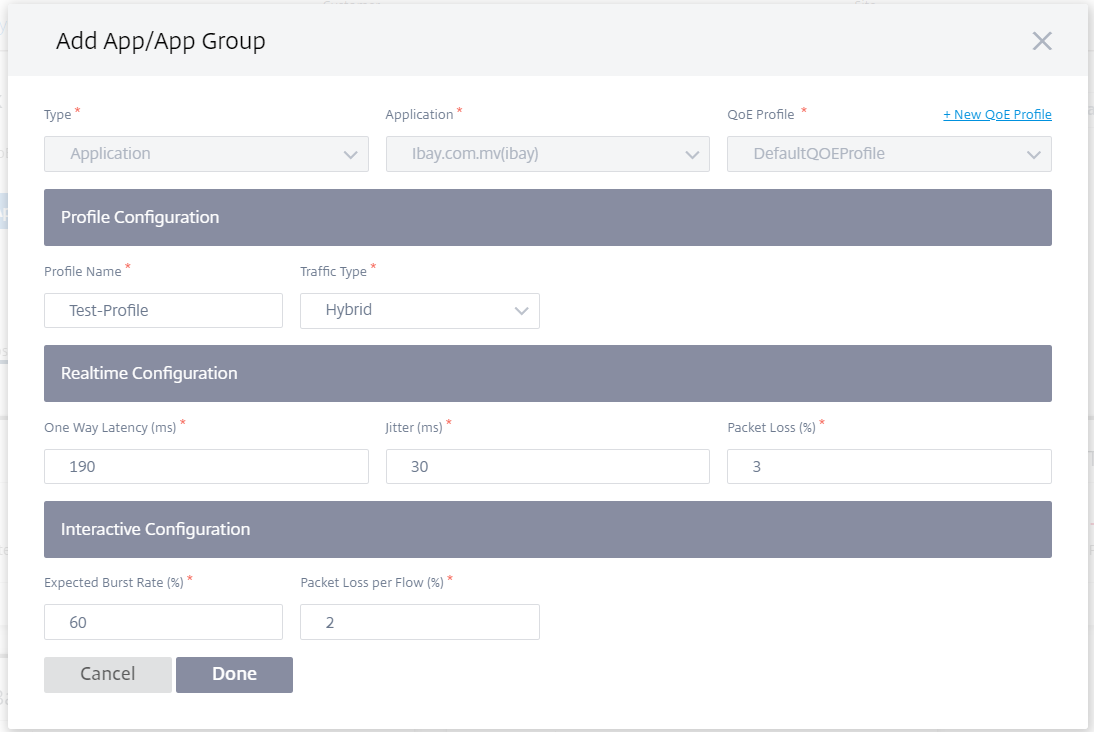
Click + New QoE Profile to create an application QoE profile and enter the value for the following parameters:
- Profile Name: A name to identify the profile that sets thresholds for real-time and interactive traffic.
- Traffic Type: Choose the type of traffic – Real-time, Interactive, or Hybrid. If the traffic type is Hybrid, you can configure both Real-time and Interactive QoE profile thresholds.
-
Realtime Configuration: Configure thresholds for traffic flows that select the real-time QoS policy. A flow of a real-time application that meets the following thresholds for latency, loss, and jitter is considered to be of good quality.
- One Way latency: The latency threshold in milliseconds. The default QoE profile value is 160 ms.
- Jitter: The jitter threshold in milliseconds. The default QoE profile value is 30 ms.
- Packet Loss: The percentage of packet loss. The default QoE profile value is 2%.
-
Interactive Configuration: Configure thresholds for traffic flows that select the interactive QoS policy. A flow of an interactive application that meets the following threshold for burst ratio and packet loss is considered to be of good quality.
- Expected Burst Rate: The percentage of expected burst rate. The egress burst rate must be at least the configured percentage of ingress burst rate. The default QoE profile value is 60%.
- Packet loss per flow: The percentage of packet loss. The default QoE profile value is 1%.
The newly added application is displayed in the Application Quality dashboard.
You can also define and configure application QoE from App & DNS Settings for more information see, Application quality profiles and Application quality configuration.
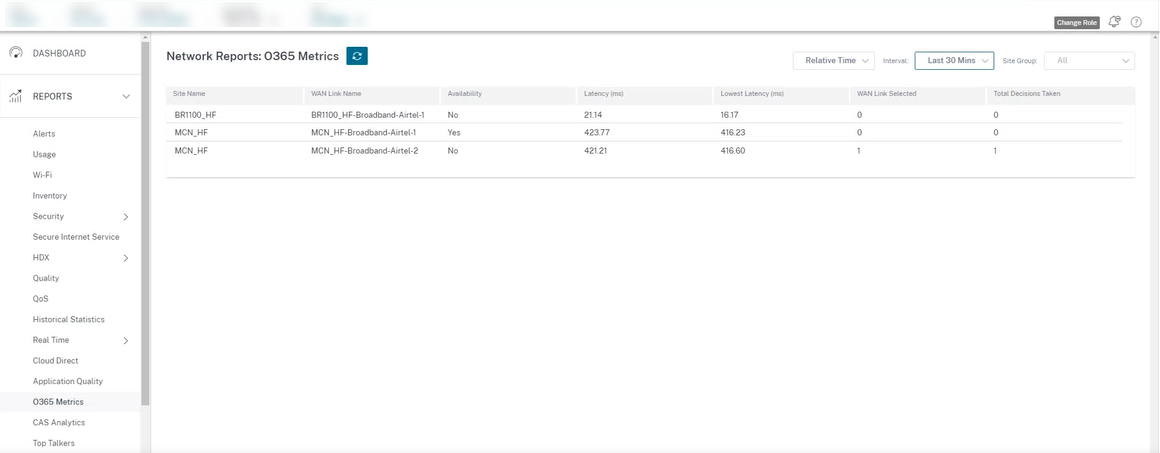
O365 Metrics
Citrix SD-WAN allows you to not only perform beacon probing, but also determines the latency to reach Office 365 endpoints through each WAN link. The latency is the round trip time taken to send a request and get a response from the Office 365 beacon service over a WAN link. This enables network administrators to view the beacon service latency report and manually choose the best internet link for direct Office 365 breakout. Beacon probing is enabled only through the Citrix SD-WAN Orchestrator service. By default, beacon probing is enabled on all Internet enabled WAN links (except metered WAN links) when Office 365 break-out is enabled through the Citrix SD-WAN Orchestrator service.
The O365 Metrics dashboard displays the following information:
- Site Name: Name of the site.
- WAN Link name: Name of the WAN link.
- Availability: Availability status of the WAN link.
- Latency (ms): Average round trip time through the WAN link.
- Lowest Latency: The lowest latency count of the WAN link for a selected time period.
- WAN Link Selected: The number of times the WAN link was chosen for Office 365 optimization.
- Total Decisions taken: Total number of times a decision to choose a WAN link is taken, for the selected time interval.
The application QoE report displays a dashboard that provides the Application QoE data of all the configured applications at all the sites.