-
-
-
View recommendations and manage your ADCs and applications efficiently
-
-
Use ADM log messages for managing and monitoring your infrastructure
This content has been machine translated dynamically.
Dieser Inhalt ist eine maschinelle Übersetzung, die dynamisch erstellt wurde. (Haftungsausschluss)
Cet article a été traduit automatiquement de manière dynamique. (Clause de non responsabilité)
Este artículo lo ha traducido una máquina de forma dinámica. (Aviso legal)
此内容已经过机器动态翻译。 放弃
このコンテンツは動的に機械翻訳されています。免責事項
이 콘텐츠는 동적으로 기계 번역되었습니다. 책임 부인
Este texto foi traduzido automaticamente. (Aviso legal)
Questo contenuto è stato tradotto dinamicamente con traduzione automatica.(Esclusione di responsabilità))
This article has been machine translated.
Dieser Artikel wurde maschinell übersetzt. (Haftungsausschluss)
Ce article a été traduit automatiquement. (Clause de non responsabilité)
Este artículo ha sido traducido automáticamente. (Aviso legal)
この記事は機械翻訳されています.免責事項
이 기사는 기계 번역되었습니다.책임 부인
Este artigo foi traduzido automaticamente.(Aviso legal)
这篇文章已经过机器翻译.放弃
Questo articolo è stato tradotto automaticamente.(Esclusione di responsabilità))
Translation failed!
TCP Insight
The TCP Insight feature of NetScaler Application Delivery Management (ADM) provides an easy and scalable solution for monitoring the metrics of the optimization techniques and congestion control strategies (or algorithms) used in NetScaler appliances to avoid network congestion in data transmission. This feature uses “TCP Speed Report” capability, which measures TCP file download or upload performance with and without TCP optimization.
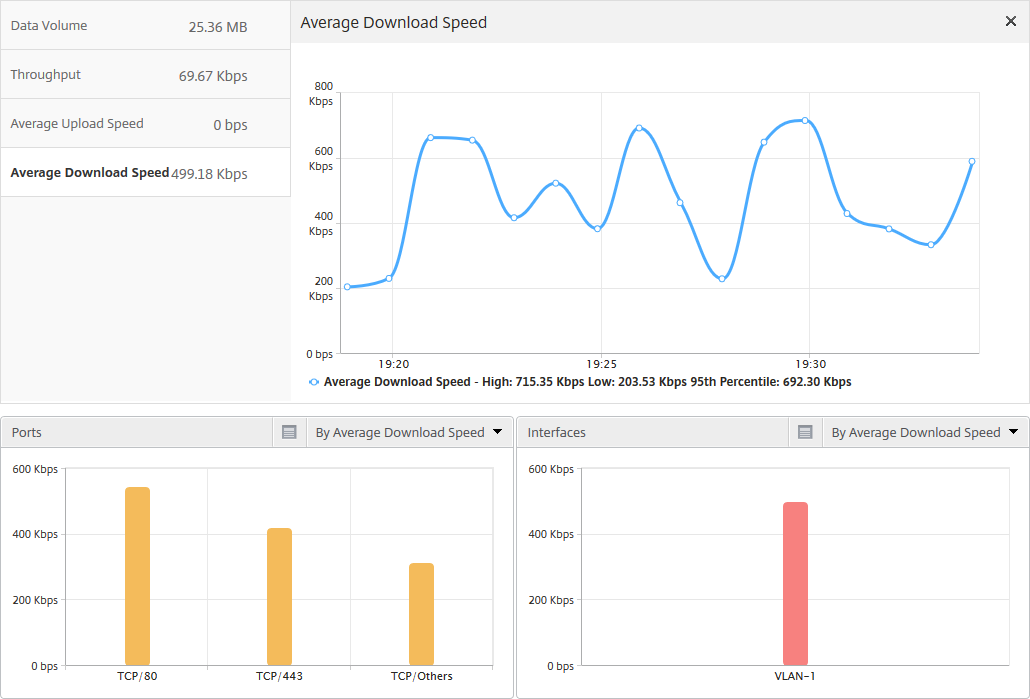
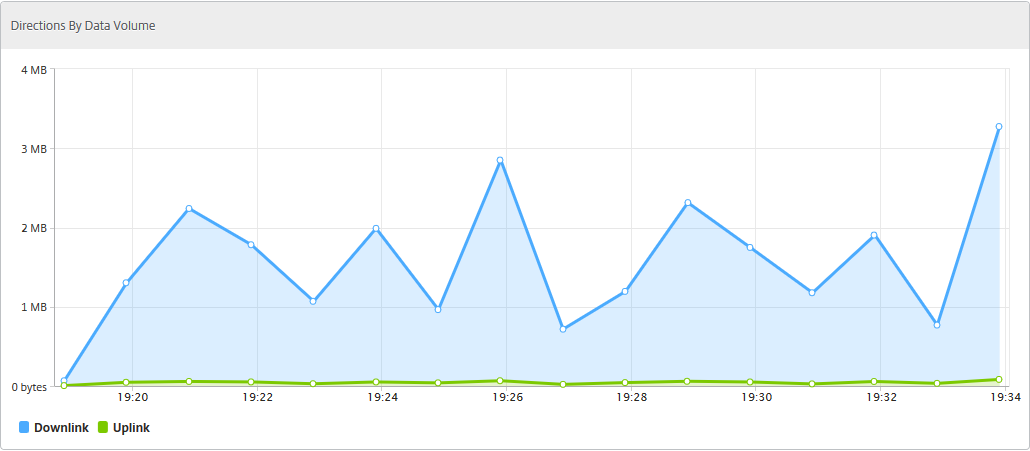
You can view the key Transport Layer metrics, such as data volume, throughput, and speed, and use that information to measure the traffic volume served by the NetScaler instances and validate the benefits of TCP Optimization. Breakdowns by stream direction (from client to NetScaler and NetScaler to origin server), TCP port, and virtual LAN are provided for the above metrics.
Prerequisites
Before you begin configuring the TCP Insight feature, make sure that the following prerequisites are met:
-
The NetScaler instances are running on software version 11.1 build 51.21 or later.
-
You have installed NetScaler ADM running on software version 11.1 build 51.21 or later.
-
All the virtual servers configured for an application are licensed for management and monitoring on NetScaler® ADM.
For information about NetScaler ADM licensing, see Licensing.
Enabling TCP Insight
Before you can view the TCP Insight metrics, you must enable the feature on NetScaler ADM.
To Enable TCP Insight:
-
In a web browser, type the IP address of the NetScaler ADM virtual appliance (for example, http://192.168.100.1).
-
In User Name and Password, enter the administrator credentials.
-
Navigate to Settings > Analytics Settings, and click Enable Features for Analytics.
-
On the Enable Features for Analytics page, select Enable TCP Insight.
-
In the confirmation window, click OK.
View the TCP Insight metrics in NetScaler ADM
After enabling TCP Insight in NetScaler ADM, you can view key transport layer information such as traffic mode (internet or mobile data), data volume, throughput, interfaces, ports, average upload speed, average download speed.
To display TCP Insight metrics in NetScaler ADM:
Navigate to Infrastructure > TCP Insight.
You can hover your mouse pointer on the bar graphs to view the data volume of the corresponding transport techniques. Also you can view the data volume, and other metrics, in the table below the graph.
Note You can customize the metrics displayed in the graph by using the settings icon on the table. You can also select the time period to which the metrics pertain, and use the time slider adjust the time period.
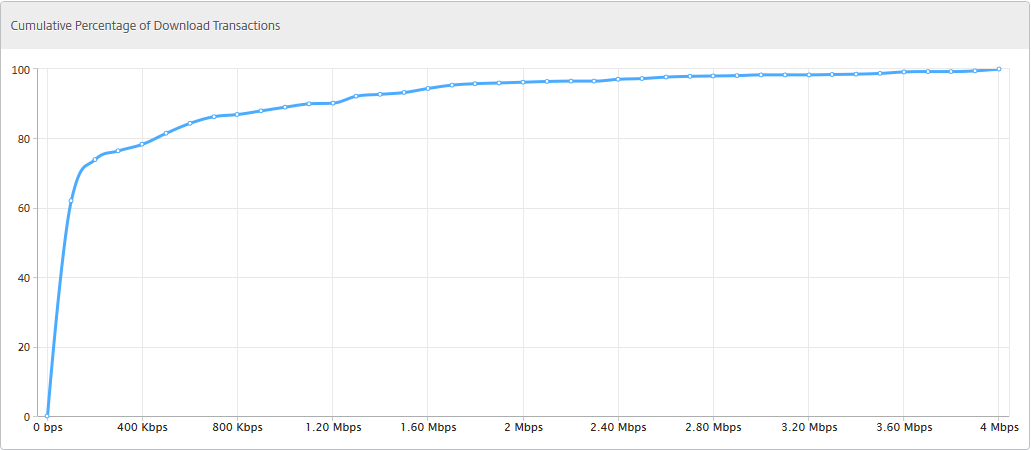
You can also view metrics for such things as interfaces, ports, and bit rates by selecting from the TCP Insight list.
Use cases
The following use cases illustrate some of the ways to use TCP Insight on NetScaler appliances:
-
Assess benefits of TCP optimization
-
Tune TCP parameters
-
Measure impact of TCP optimization on traffic volume
Assess benefits of TCP optimization
How much does NetScaler TCP optimization actually benefit a mobile (radio) or enterprise network (internet). You can view the speed of data transfers that take place over TCP, and compare unoptimized and optimized performance. These measurements are displayed separately for the download and upload directions (always on the radio/client side), and for different destination ports, HTTP (80) and HTTPS (443). By examining the TCP Insight metrics, you can quantify the speed improvement gained by optimizing TCP flows.
To see a summary of these parameters, log on to NetScaler ADM and click the TCP Insight tab. Then, click Sides and select Internet or Radio from the bar graph or the table below the graph.

Tune TCP parameters
Using different TCP Profiles might yield different outputs for the same traffic. In such situations, you might want to view and compare the speed measurements of periods in which NetScaler is running different TCP optimization profiles. You can use the results to tune TCP parameters for faster transmission, and develop a TCP profile that maximizes the user-perceived experience in a specific customer network.
To view the reports, log on to NetScaler ADM. Then, on the TCP Insight tab, click Bitrates, and select the desired bitrate from the bar graph or the table below the graph.

Measure impact of TCP optimization on traffic volume
Measurements of IP-layer Data Volume/Throughput handled by a NetScaler instance can be compared between different time periods, to evaluate the effect of TCP optimization on subscriber data consumption. The measurements can be applied separately for each side of the network (radio-side vs. internet-side), for different traffic segments (delineated by different interfaces or VLANs), for each direction (downlink vs. uplink) and for different destination ports (HTTP and HTTPS). The comparison can be used to confirm that TCP optimization encourages subscribers to consume more data.
For a summary of the measurements, log on to NetScaler ADM, and on the TCP Insight tab click Sides, and then select Internet or Radio from the bar graph or the table below the graph.
You can also select a different timeframe from the time list. You can customize the time frame by using the timeframe slider.

Share
Share
This Preview product documentation is Cloud Software Group Confidential.
You agree to hold this documentation confidential pursuant to the terms of your Cloud Software Group Beta/Tech Preview Agreement.
The development, release and timing of any features or functionality described in the Preview documentation remains at our sole discretion and are subject to change without notice or consultation.
The documentation is for informational purposes only and is not a commitment, promise or legal obligation to deliver any material, code or functionality and should not be relied upon in making Cloud Software Group product purchase decisions.
If you do not agree, select I DO NOT AGREE to exit.