-
-
-
-
Create thresholds and configure alerts for HDX Insight
-
-
-
Scenarios for Flexed or Pooled license expiry and connectivity issues behavior
-
Configure NetScaler Console as the Flexed or Pooled license server
This content has been machine translated dynamically.
Dieser Inhalt ist eine maschinelle Übersetzung, die dynamisch erstellt wurde. (Haftungsausschluss)
Cet article a été traduit automatiquement de manière dynamique. (Clause de non responsabilité)
Este artículo lo ha traducido una máquina de forma dinámica. (Aviso legal)
此内容已经过机器动态翻译。 放弃
このコンテンツは動的に機械翻訳されています。免責事項
이 콘텐츠는 동적으로 기계 번역되었습니다. 책임 부인
Este texto foi traduzido automaticamente. (Aviso legal)
Questo contenuto è stato tradotto dinamicamente con traduzione automatica.(Esclusione di responsabilità))
This article has been machine translated.
Dieser Artikel wurde maschinell übersetzt. (Haftungsausschluss)
Ce article a été traduit automatiquement. (Clause de non responsabilité)
Este artículo ha sido traducido automáticamente. (Aviso legal)
この記事は機械翻訳されています.免責事項
이 기사는 기계 번역되었습니다.책임 부인
Este artigo foi traduzido automaticamente.(Aviso legal)
这篇文章已经过机器翻译.放弃
Questo articolo è stato tradotto automaticamente.(Esclusione di responsabilità))
Translation failed!
Create thresholds and configure alerts for HDX™ Insight
HDX Insight on NetScaler Console allows you to monitor the HDX traffic passing through NetScaler instances. NetScaler Console allows you to set thresholds on various counters used to monitor the Insight traffic. You can also configure rules and create alerts in NetScaler Console.
HDX traffic type is associated with various entities such as applications, desktops, gateways, licenses, and users. Every entity can contain different metrics associated with them. For example, application entity is associated with various hits, bandwidth consumed by the application, and response time of the server. A user entity can be associated with WAN latency, DC latency, ICA® RTT, and bandwidth consumed by a user.
The threshold management for HDX Insight in NetScaler Console allowed you to proactively create rules and configure alerts whenever the thresholds set are breached. Now, this threshold management is extended to configure a group of threshold rules. You can now monitor the group instead of individual rules. A threshold rule group comprises one or more user-defined threshold rules for metrics chosen from entities such as users, applications, and desktops. Each rule is monitored against an expected value that you enter when you create the rule. In case of users entity, the threshold group can be associated with a geolocation as well.
An alert is generated on NetScaler Console only if all the rules in the configured threshold group are breached. For example, you can monitor an application on total session launch count and also on application launch count as one threshold group. An alert is generated only if both rules are breached. This allows you to set more realistic thresholds on an entity.
A few examples are listed as follows:
-
Threshold rule1: ICA RTT(metric) for users(entity) must be <= 100 ms
-
Threshold rule2: WAN Latency (metric) for users(entity) must be <= 100 ms
An example of threshold group can be: {Threshold rule 1 + Threshold rule 2}
To create a rule, you must first select the entity that you want to monitor. Then choose a metric while creating a rule. For example, you can select applications entity and then select Total Session Launch count or App Launch Count. You can create one rule for every combination of an entity and a metric. Use the comparators provided (>, <, >=, and <=) and type a threshold value for each metric.
Note
If you do not want to monitor multiple entities in a single group, you must create a separate threshold rule group for each entity.
When the value of a counter exceeds the value of a threshold, NetScaler Console generates an event to signify a threshold breach, and an alert is created for every event.
You must configure how you receive the alert. You can enable the alert to be displayed on NetScaler Console and/or receive the alert as an email or as an SMS on your mobile device. For the last two actions, you must configure the email server or the SMS server on NetScaler Console.
Threshold groups can also be bound to Geolocations for geo-specific monitoring for user entity.
Example Use cases
ABC Inc. is a global firm and has offices in over 50 countries. The firm has two data centers, one in Singapore and other in California that host the Citrix Virtual Apps and Desktops. Employees of the firm access the Citrix Virtual Apps and Desktops throughout the globe using NetScaler Gateway and Citrix GSLB based redirection. Eric, the Citrix Virtual Apps and Desktops admin for ABC Inc. wants to track the user experience for all their offices to optimize the apps and desktop delivery for anywhere, anytime access. Eric also wants to check the user-experience-metrics like ICA RTTs, latencies, and raise any deviations proactively.
The users of ABC Inc. have a distributed presence. Some users are located close to the data center, while a few are located at further away from the data center. As the user base is distributed widely, the metrics and the corresponding thresholds also vary among these locations. For example, the ICA RTT for a location near to the data center can be 5–10 ms whereas the same for a remote location can be around 100 ms.
With threshold rule group management for HDX Insight, Eric can set geo-specific threshold rule groups for each location and be alerted through email or SMS for breaches per area. Eric is also able to combine tracking of more than one metric within a threshold rule group and narrow down the root cause to capacity issues if any. Eric is now able to proactively track any deviation without having to worry about the complexity of manually looking through all Citrix Virtual Apps and Desktops portfolio metrics.
To create a threshold rule group and configure alerts for HDX Insight using NetScaler Console:
-
In NetScaler Console, navigate to Settings > Analytics Settings > Thresholds. On Thresholds page that opens, click Add.
-
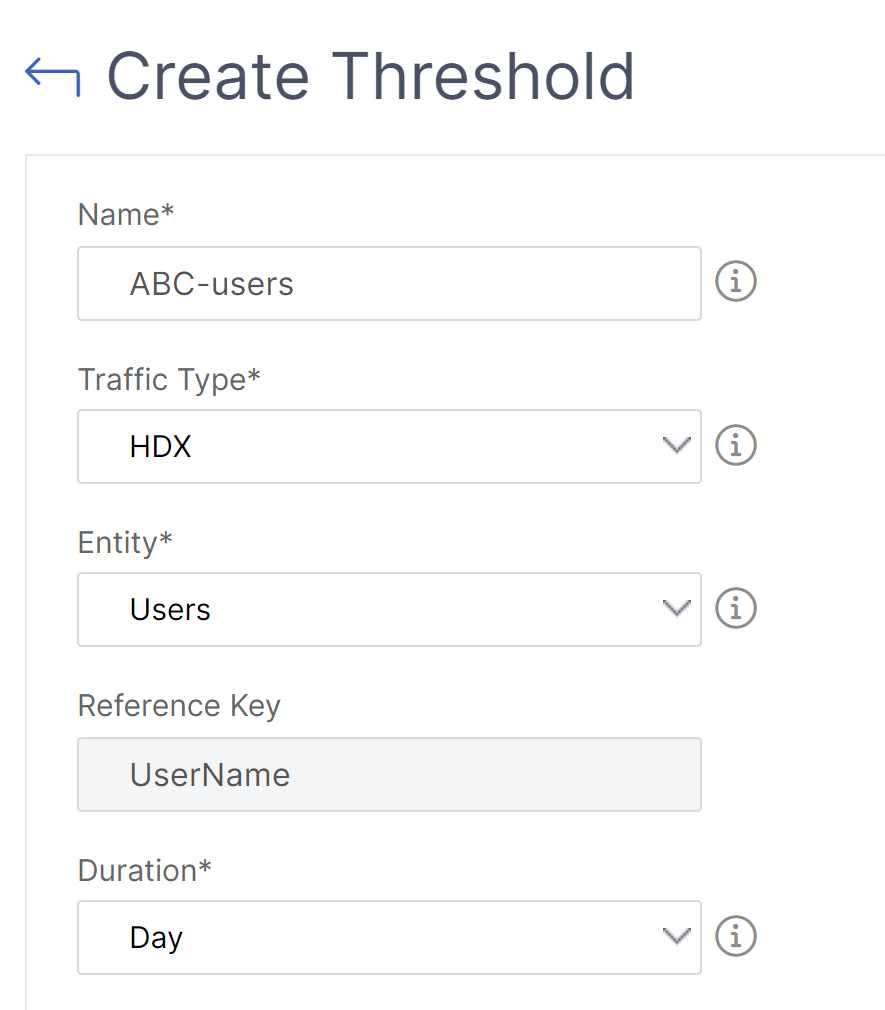
On the Create Thresholds and Alerts page, specify the following details:
-
Name. Type in a name for creating an event for which NetScaler Console generates an alert.
-
Traffic Type. From the list box, select HDX.
-
Entity. From the list box, select the category or the resource type. The entities differ for each traffic type that you have selected earlier.
-
Reference Key. A reference key is automatically generated based on the traffic type and entity that you have selected.
-
Duration. From the list box, select the time interval for which you want to monitor the entity. You can monitor the entities for an hour, or for a day, or for a week’s duration.

-
-
Creating threshold rules group for all entities:
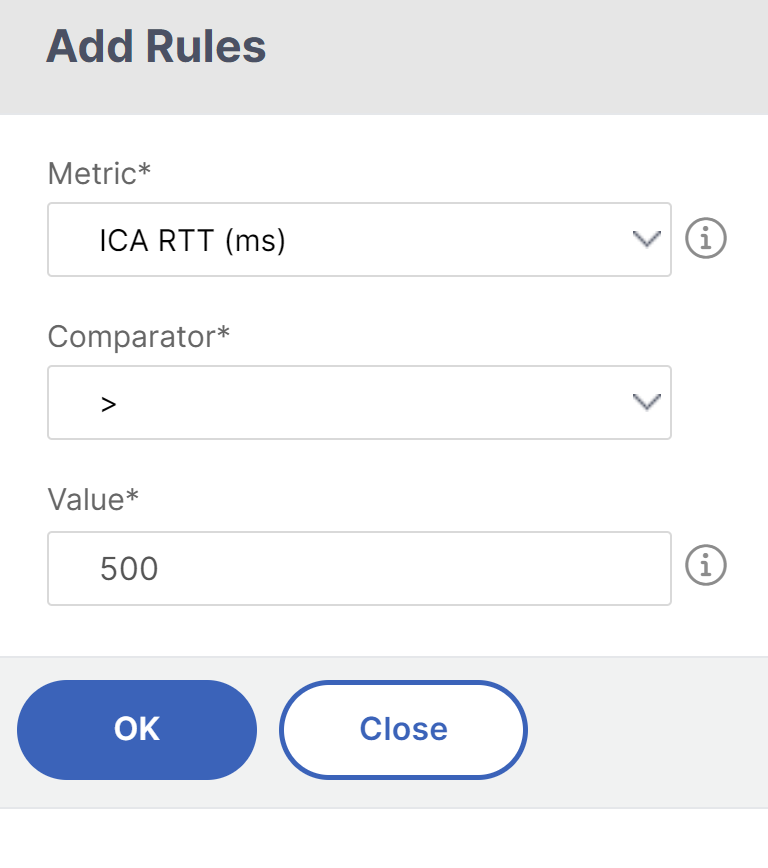
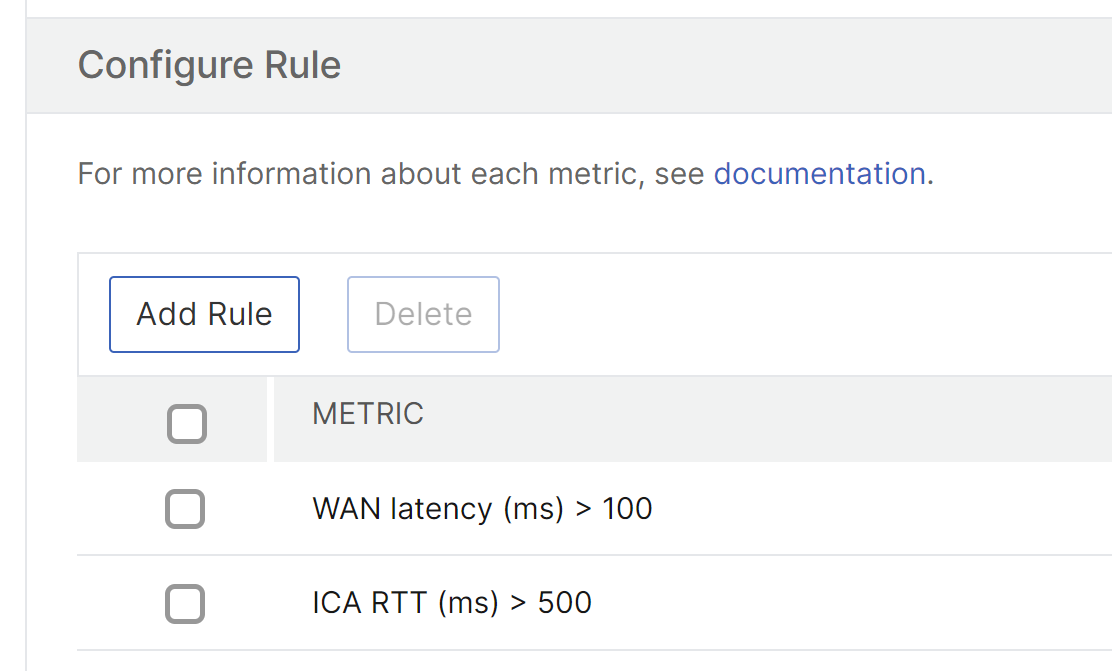
For HDX traffic, you must create a rule by clicking Add Rule. Enter the values in the Add Rules pop-up window that opens.

You can create multiple rules to monitor each entity. Creating multiple rules in one single group allows you to monitor the entities as a group of threshold rules instead of individual rules. Click OK to close the window.

-
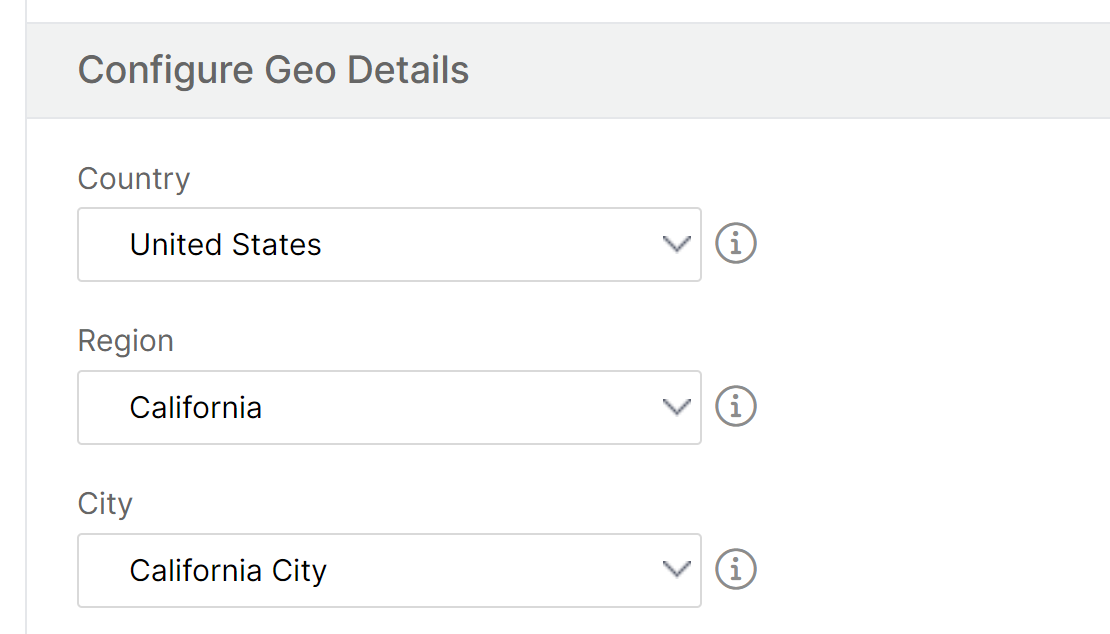
Configuring Geolocation tagging for Users entity
Optionally, you can create a location-based alert for the user entity in the Configure Geo Details section. The following image shows an example of creating a geolocation based tagging to monitor WAN latency performance for users on the west coast of the United States.

-
Click Enable Thresholds to allow NetScaler Console to start monitoring the entities.
-
Optionally, configure actions such as email notifications and SMS notifications.
-
Click Create to create a threshold rule group.
Share
Share
In this article
This Preview product documentation is Cloud Software Group Confidential.
You agree to hold this documentation confidential pursuant to the terms of your Cloud Software Group Beta/Tech Preview Agreement.
The development, release and timing of any features or functionality described in the Preview documentation remains at our sole discretion and are subject to change without notice or consultation.
The documentation is for informational purposes only and is not a commitment, promise or legal obligation to deliver any material, code or functionality and should not be relied upon in making Cloud Software Group product purchase decisions.
If you do not agree, select I DO NOT AGREE to exit.