-
-
-
-
Scenarios for Flexed or Pooled license expiry and connectivity issues behavior
-
Configure NetScaler Console as the Flexed or Pooled license server
-
-
VM snapshots of NetScaler Console in high availability deployment
-
Use Data Storage Management dashboard
-
Understand your data storage
-
This content has been machine translated dynamically.
Dieser Inhalt ist eine maschinelle Übersetzung, die dynamisch erstellt wurde. (Haftungsausschluss)
Cet article a été traduit automatiquement de manière dynamique. (Clause de non responsabilité)
Este artículo lo ha traducido una máquina de forma dinámica. (Aviso legal)
此内容已经过机器动态翻译。 放弃
このコンテンツは動的に機械翻訳されています。免責事項
이 콘텐츠는 동적으로 기계 번역되었습니다. 책임 부인
Este texto foi traduzido automaticamente. (Aviso legal)
Questo contenuto è stato tradotto dinamicamente con traduzione automatica.(Esclusione di responsabilità))
This article has been machine translated.
Dieser Artikel wurde maschinell übersetzt. (Haftungsausschluss)
Ce article a été traduit automatiquement. (Clause de non responsabilité)
Este artículo ha sido traducido automáticamente. (Aviso legal)
この記事は機械翻訳されています.免責事項
이 기사는 기계 번역되었습니다.책임 부인
Este artigo foi traduzido automaticamente.(Aviso legal)
这篇文章已经过机器翻译.放弃
Questo articolo è stato tradotto automaticamente.(Esclusione di responsabilità))
Translation failed!
Understand your data storage
You can use the Data Storage Management dashboard in NetScaler Console to view data and graphs that help you track your data storage usage.
To monitor your data storage consumption, navigate to Settings > Data Storage.
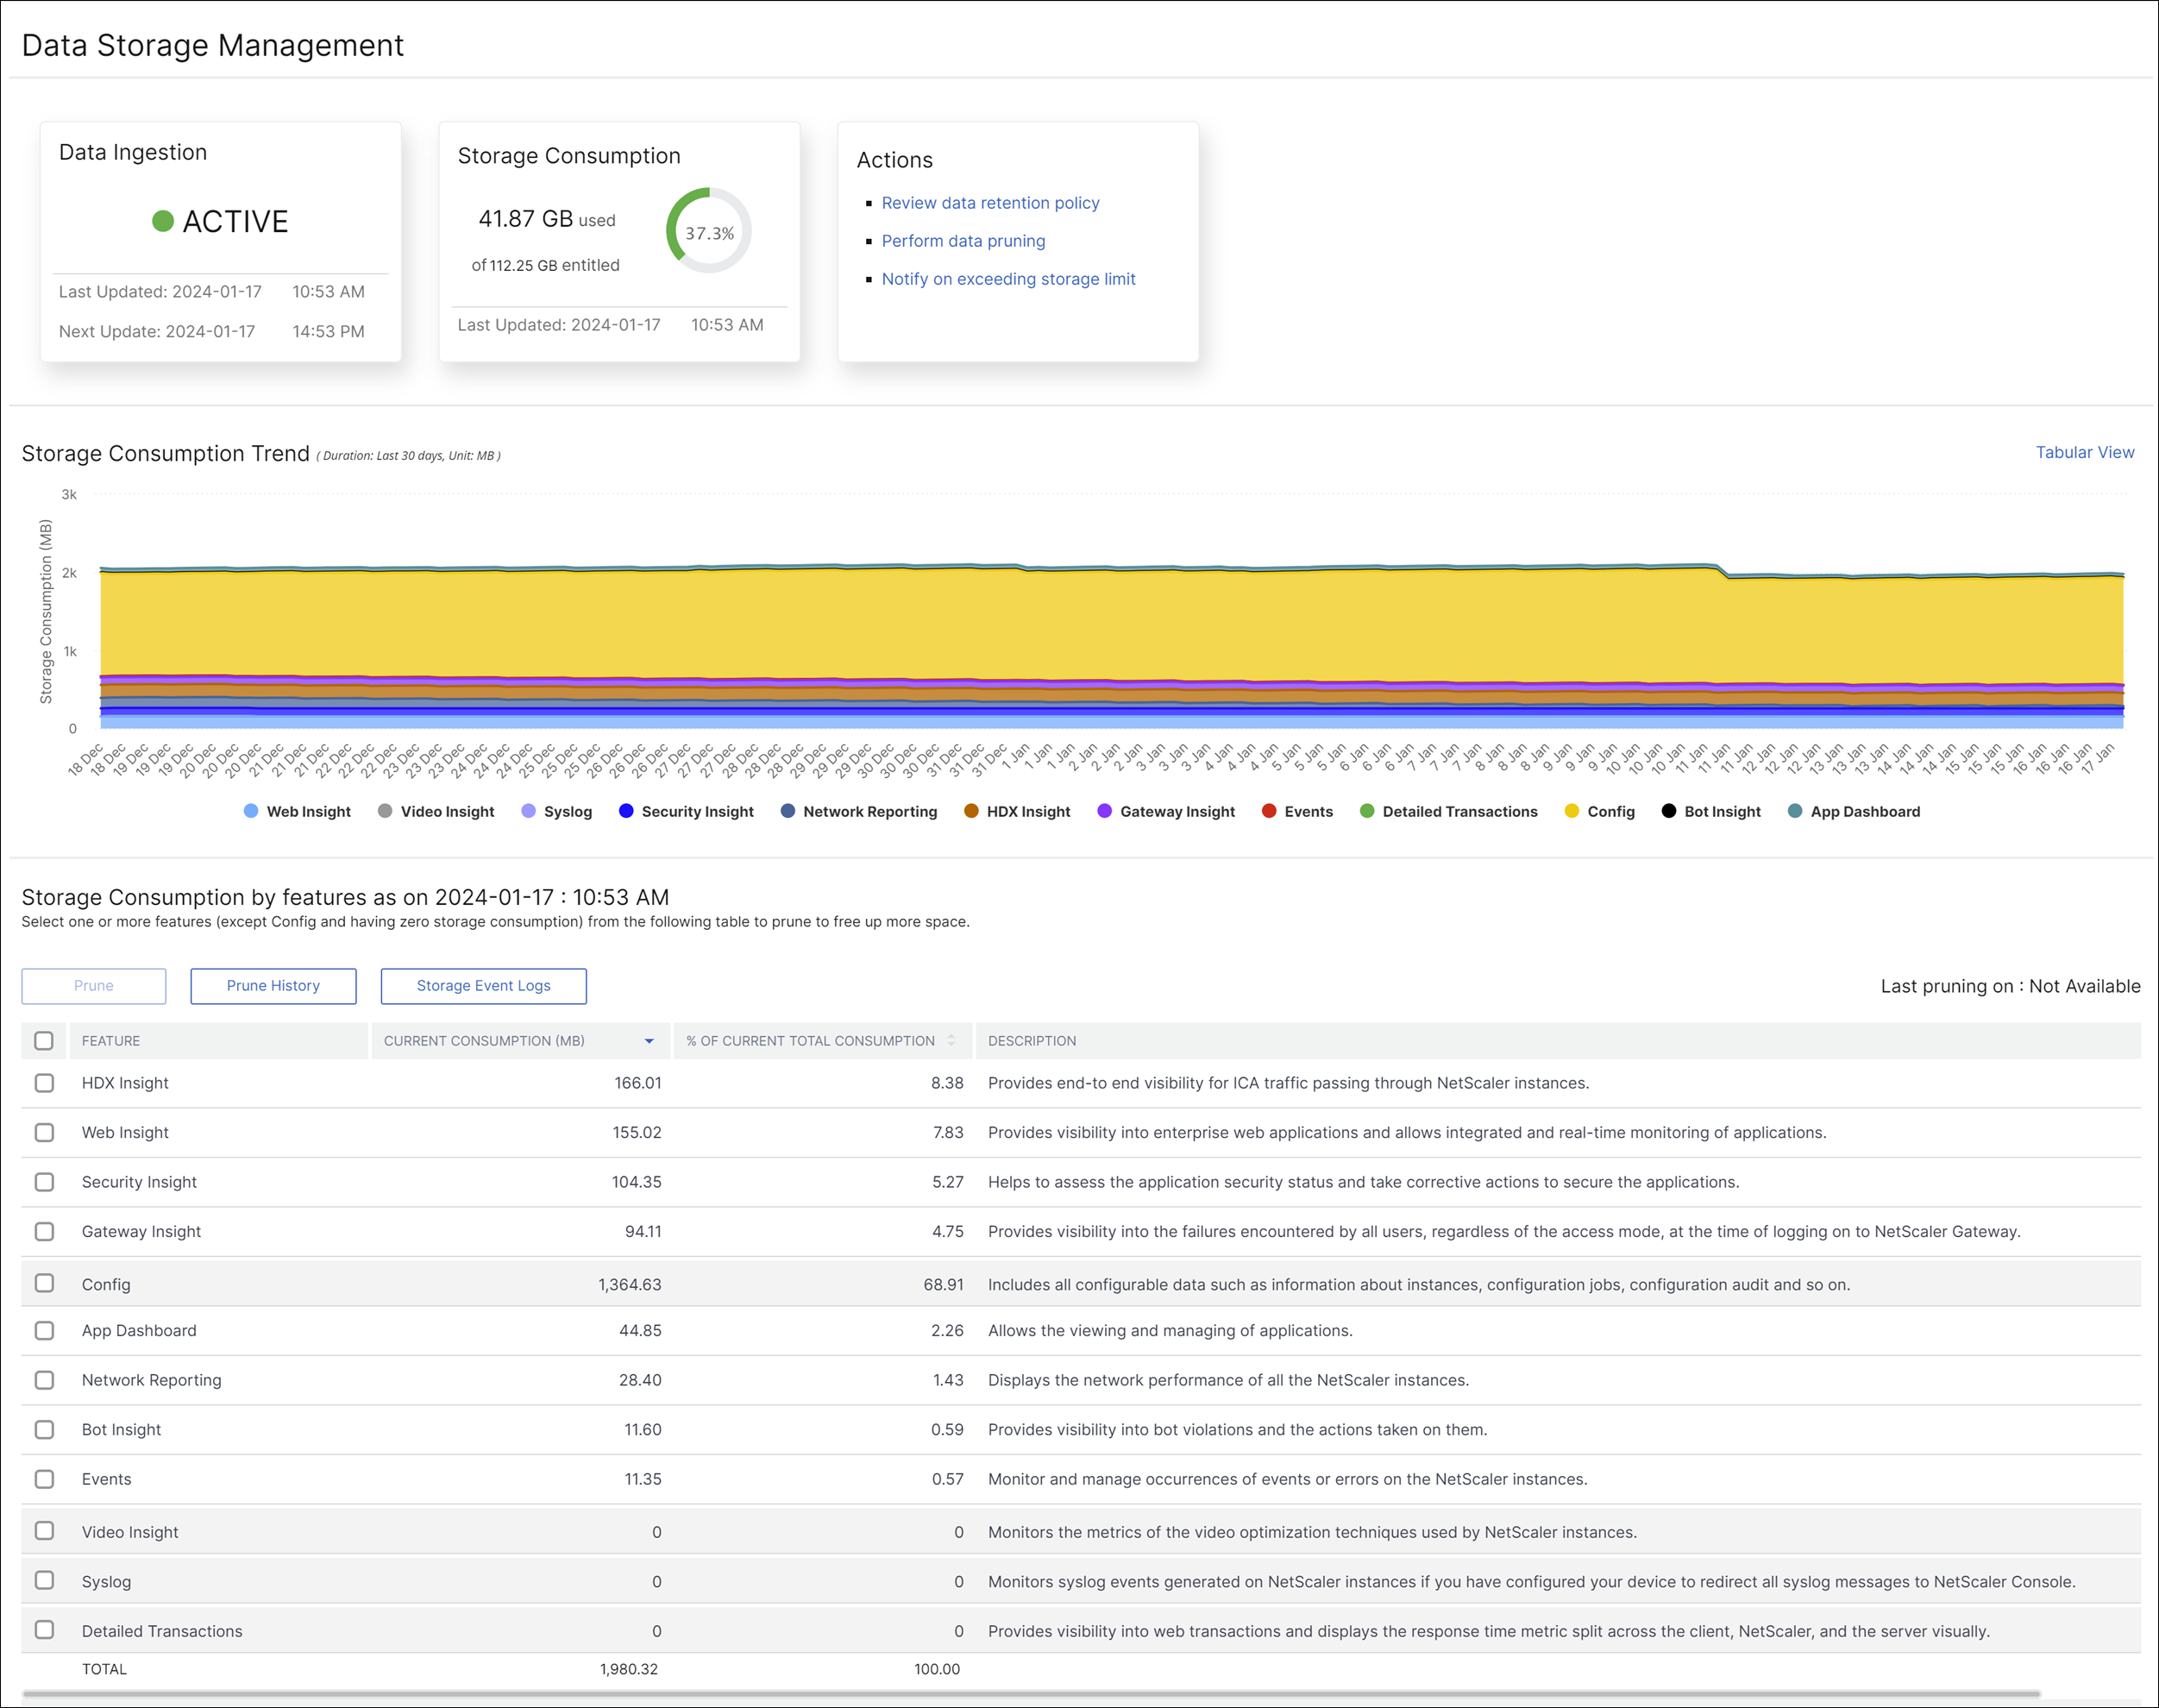
The Data Storage Management dashboard indicates the following information:
- State of your data ingestion activity
- Total storage consumption
- Storage consumption trends
- Storage consumption by features
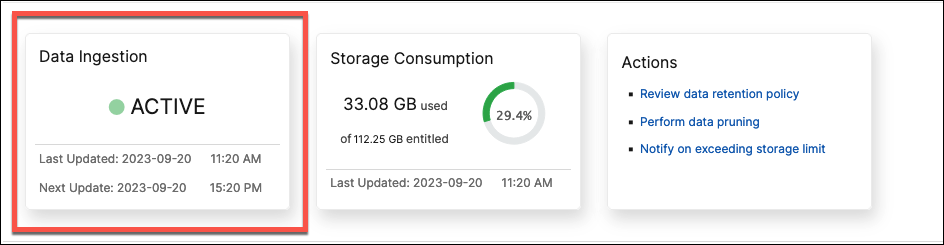
State of your data ingestion activity
Data ingestion refers to the process of importing large and assorted data from all the managed NetScaler instances across various features like Events, Syslogs, Network Reporting, and so on into the NetScaler Console storage.
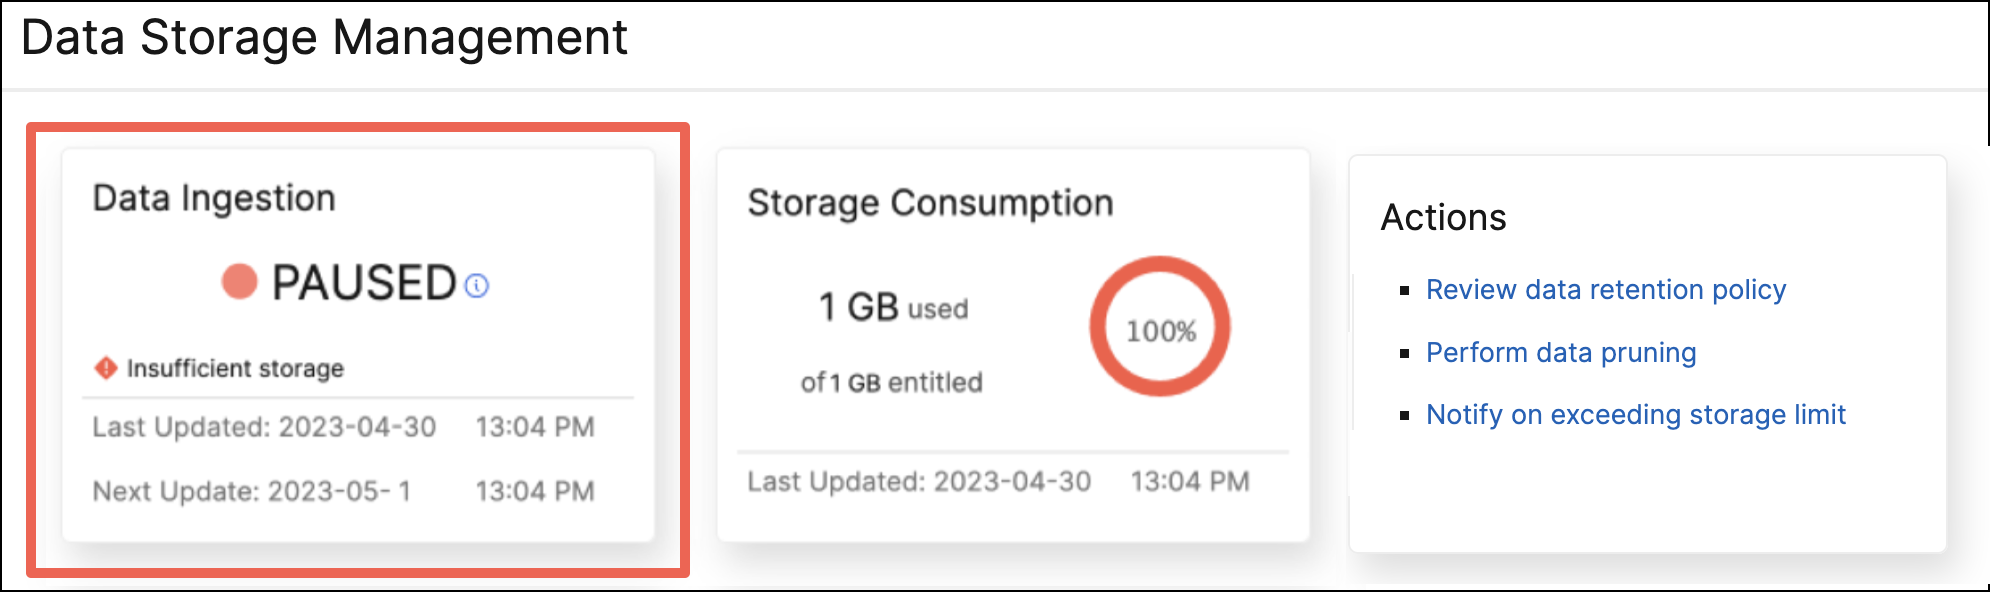
The data ingestion status indicates whether NetScaler Console is collecting statistics from NetScaler instances. The data ingestion activity continues as long as the consumed storage is within the entitled storage. When the consumption is more the entitled storage, the data ingestion is paused.
View the Data Ingestion tile to understand the current state of data ingestion. This tile displays either of the following two states:
- Active - The data ingestion activity is in progress.
- Paused - The data ingestion activity is paused since the consumed storage exceeds the entitled storage.
How to resume your paused data ingestion
To resume your data ingestion activity, you can perform data pruning. For more information, see Perform data pruning.
Total storage consumption
For a quick overview of your data storage, view the Storage Consumption tile.
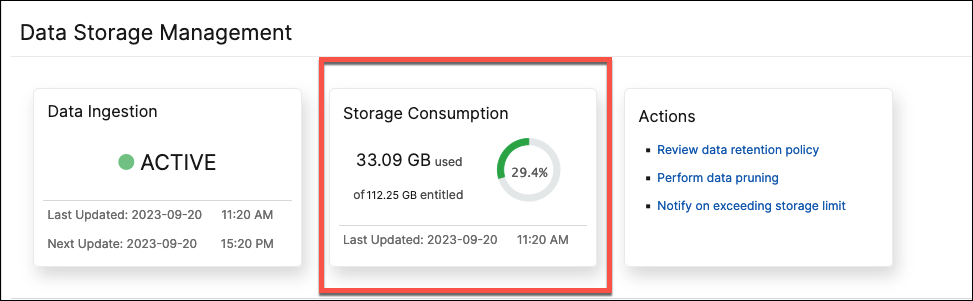
The Storage Consumption tile displays the total storage used by all the features in the deployment.
Hover over the donut chart to view the following:
Entitled Storage
The entitled storage is the total storage available for you to use as per your license. If you have an Express license, you get 500 MB of entitled storage. If you have an Advanced license, you get the sum of 500 MB of storage per purchased VIP and any additional storage that was bought directly without buying VIPs.
Consider the following scenarios:
- You bought 20 VIPs. You get 500 MB of free storage for each VIP. Your entitled storage is 20*500 = 10 GB.
- You bought 20 VIPs and an add-on storage of 5 GB. You get 500 MB of free storage for each VIP. Your entitled storage is 20*500 + 5 = 15 GB.
Consumed Storage
The consumed storage is the total storage used by all the features in the deployment. The following color coding criteria specify the amount of storage used by the features:
-
Green - The consumed storage is less than 75% of entitled storage.
-
Amber - The consumed storage is between 75% to 99% of entitled storage.
-
Red - The consumed storage limit has reached or is above the current entitled storage.
Storage consumption trends
To know how data is being consumed over the last 30 days, view the Storage Consumption Trend section.
Storage Consumption Trend provides insights into which features use the most or least storage over a time period and help you effectively manage your data storage consumption.
You can view the storage data trends in either of the following forms:
-
Graphical View – Displays how the data storage is distributed across the different NetScaler Console features. Hover your mouse over the timeline to view the data storage information for any day of the month.
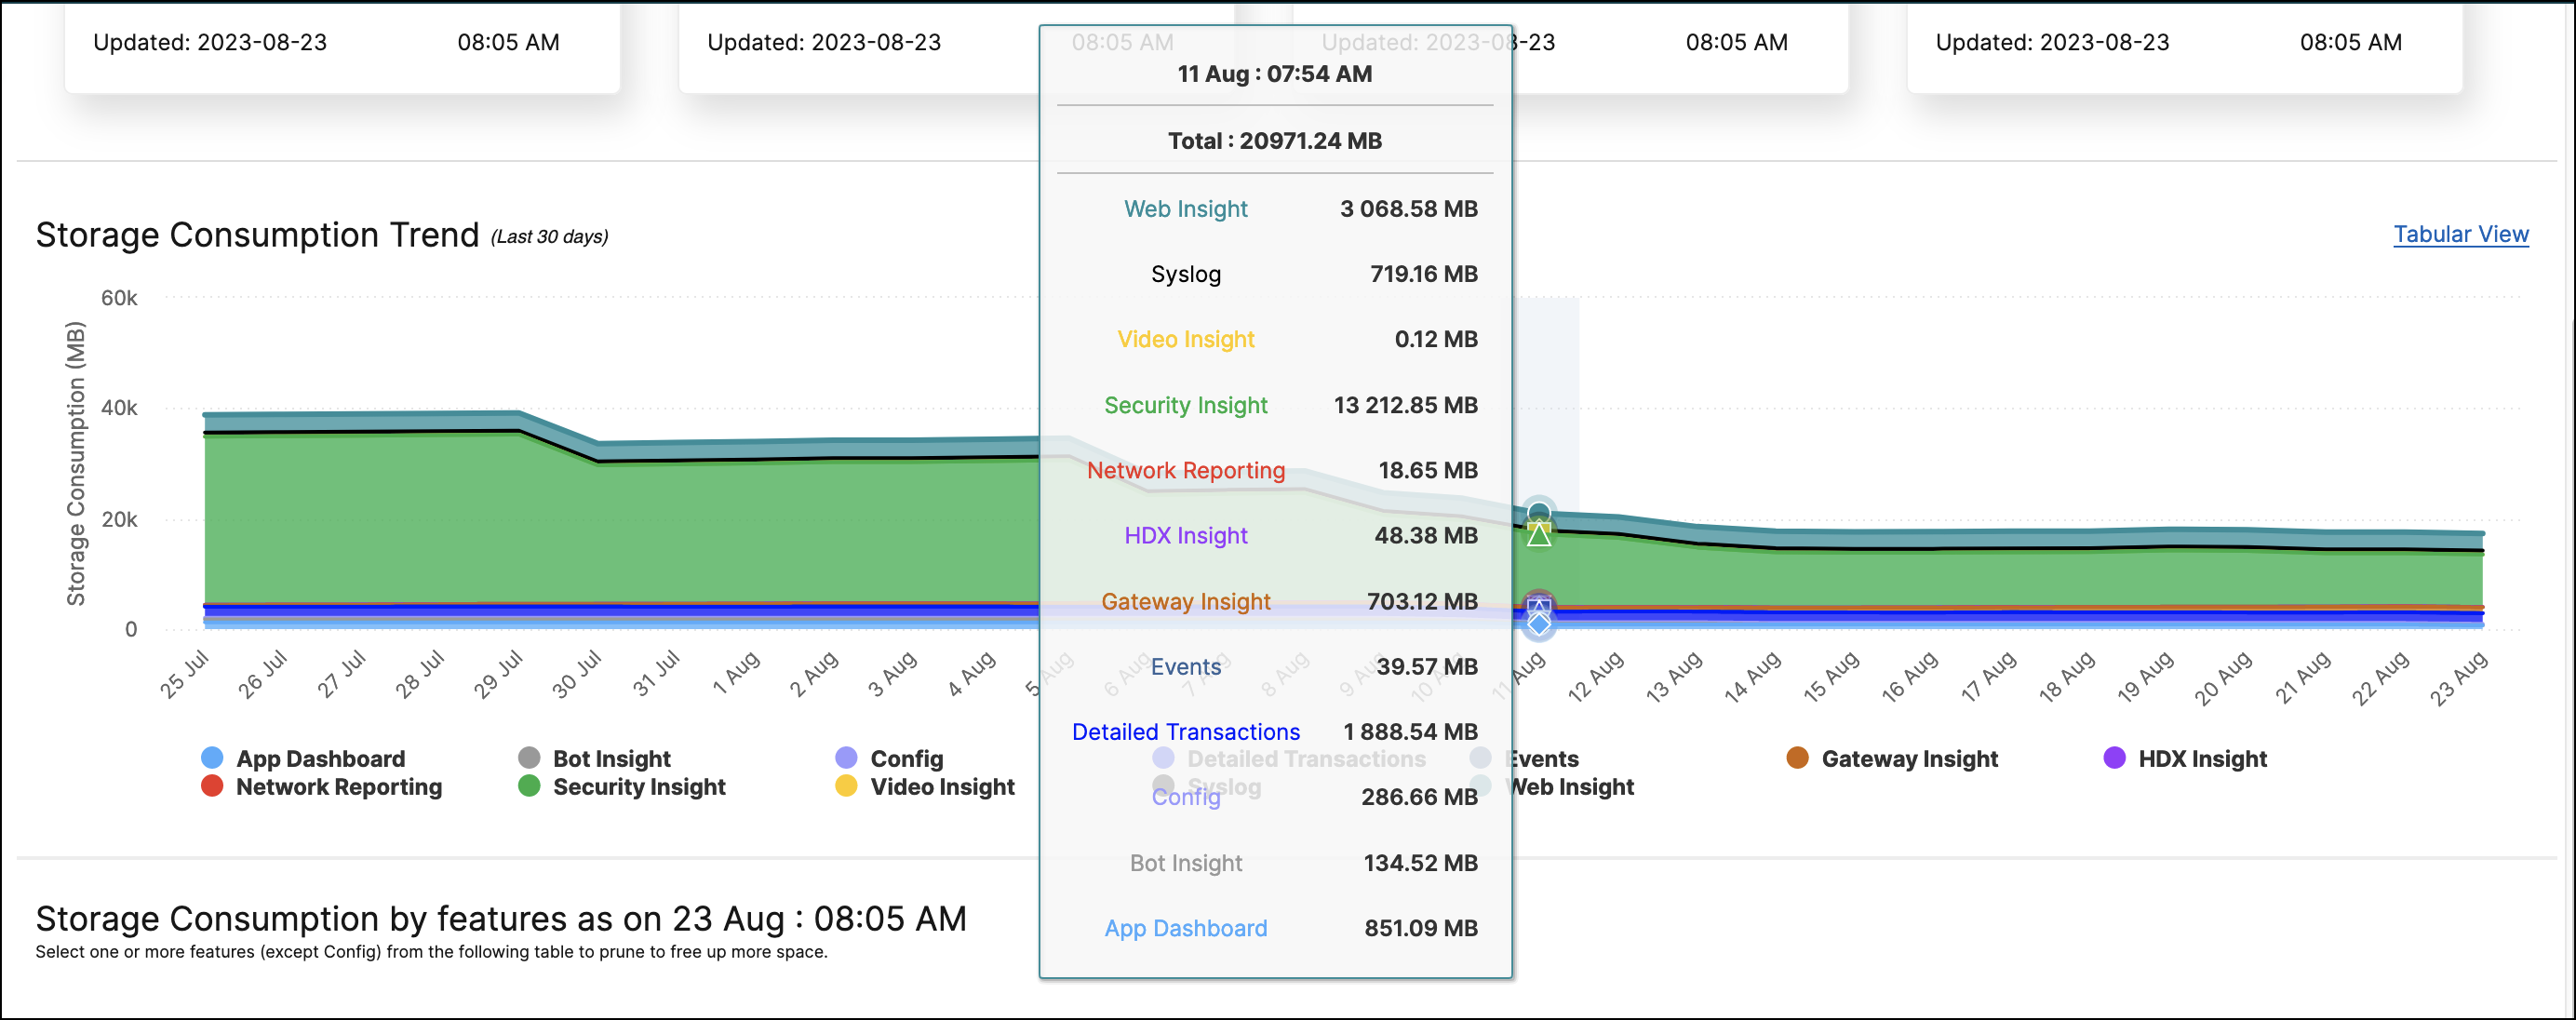
Note:
The Graphical View is the default view.
-
Tabular View – Click Tabular View to display the data storage information in a table form.
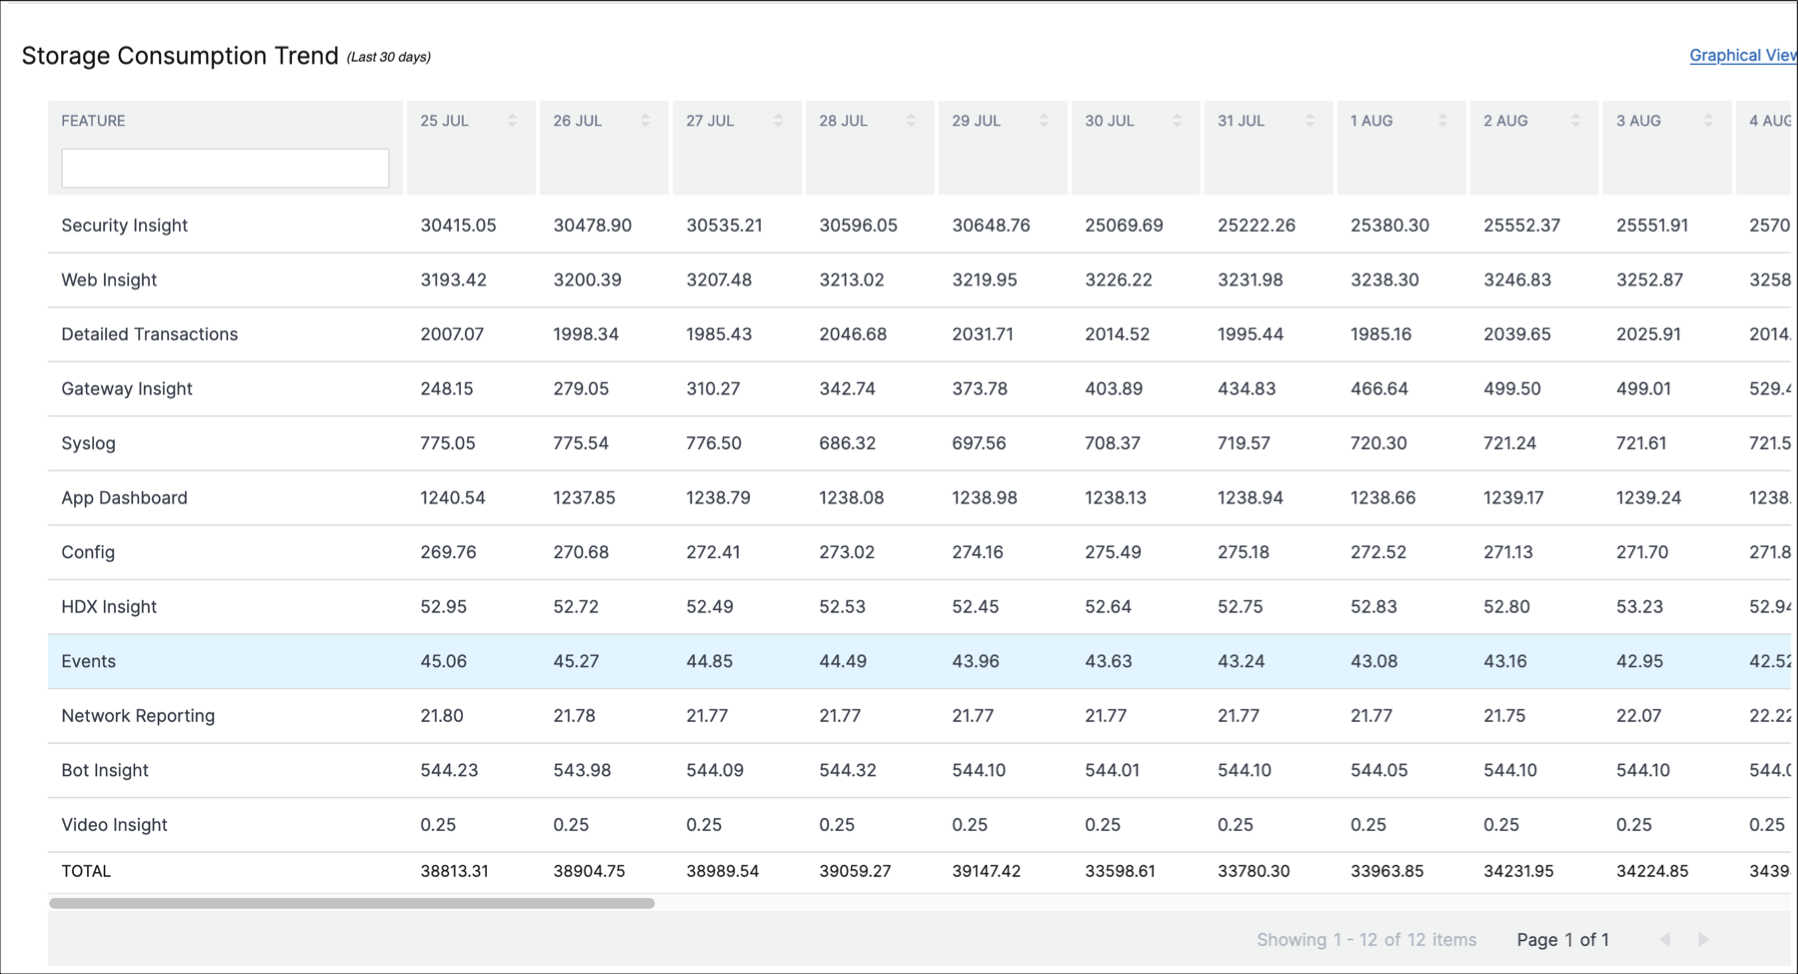
Note:
The tabular view allows you to filter the data by using the search field.
The following table describes the fields displayed in the Storage Consumption Trend section:
| FEATURE | DESCRIPTION |
|---|---|
| Config | Includes all configurable data such as information about instances, configuration jobs, configuration audit and so on. |
| HDX Insight | Provides end-to-end visibility for ICA traffic passing through NetScaler. |
| Network Reporting | Displays the network performance of all the NetScaler instances. |
| Web Insight | Provides visibility into enterprise web applications and allows integrated and real-time monitoring of applications. |
| Security Insight | Helps to assess the application security status and take corrective actions to secure the applications. |
| Gateway Insight | Provides visibility into the failures encountered by all users, regardless of the access mode, at the time of logging on to NetScaler Gateway. |
| Events | Monitor and manage occurrences of events or errors on the NetScaler instances. |
| App Dashboard | Allows the viewing and managing of applications. |
| Bot Insight | Provides visibility into bot violations and the actions taken on them. |
| Syslog | Monitors syslog events generated on NetScaler instances if you have configured your device to redirect all syslog messages to NetScaler Console. |
| Video Insight | Monitors the metrics of the video optimization techniques used by NetScaler instances. |
| Detailed Transactions | Provides visibility into web transactions and displays the response time metric split across the client, NetScaler, and the server visually. |
Storage consumption by features
To know more about how the data storage is distributed across the different features, view the Storage Consumption by features as on dd mmm section.
Storage Consumption by features as on dd mmm helps you understand:
- The storage space used by all the different features in NetScaler Console
- The percentage of space the features consume on a particular day
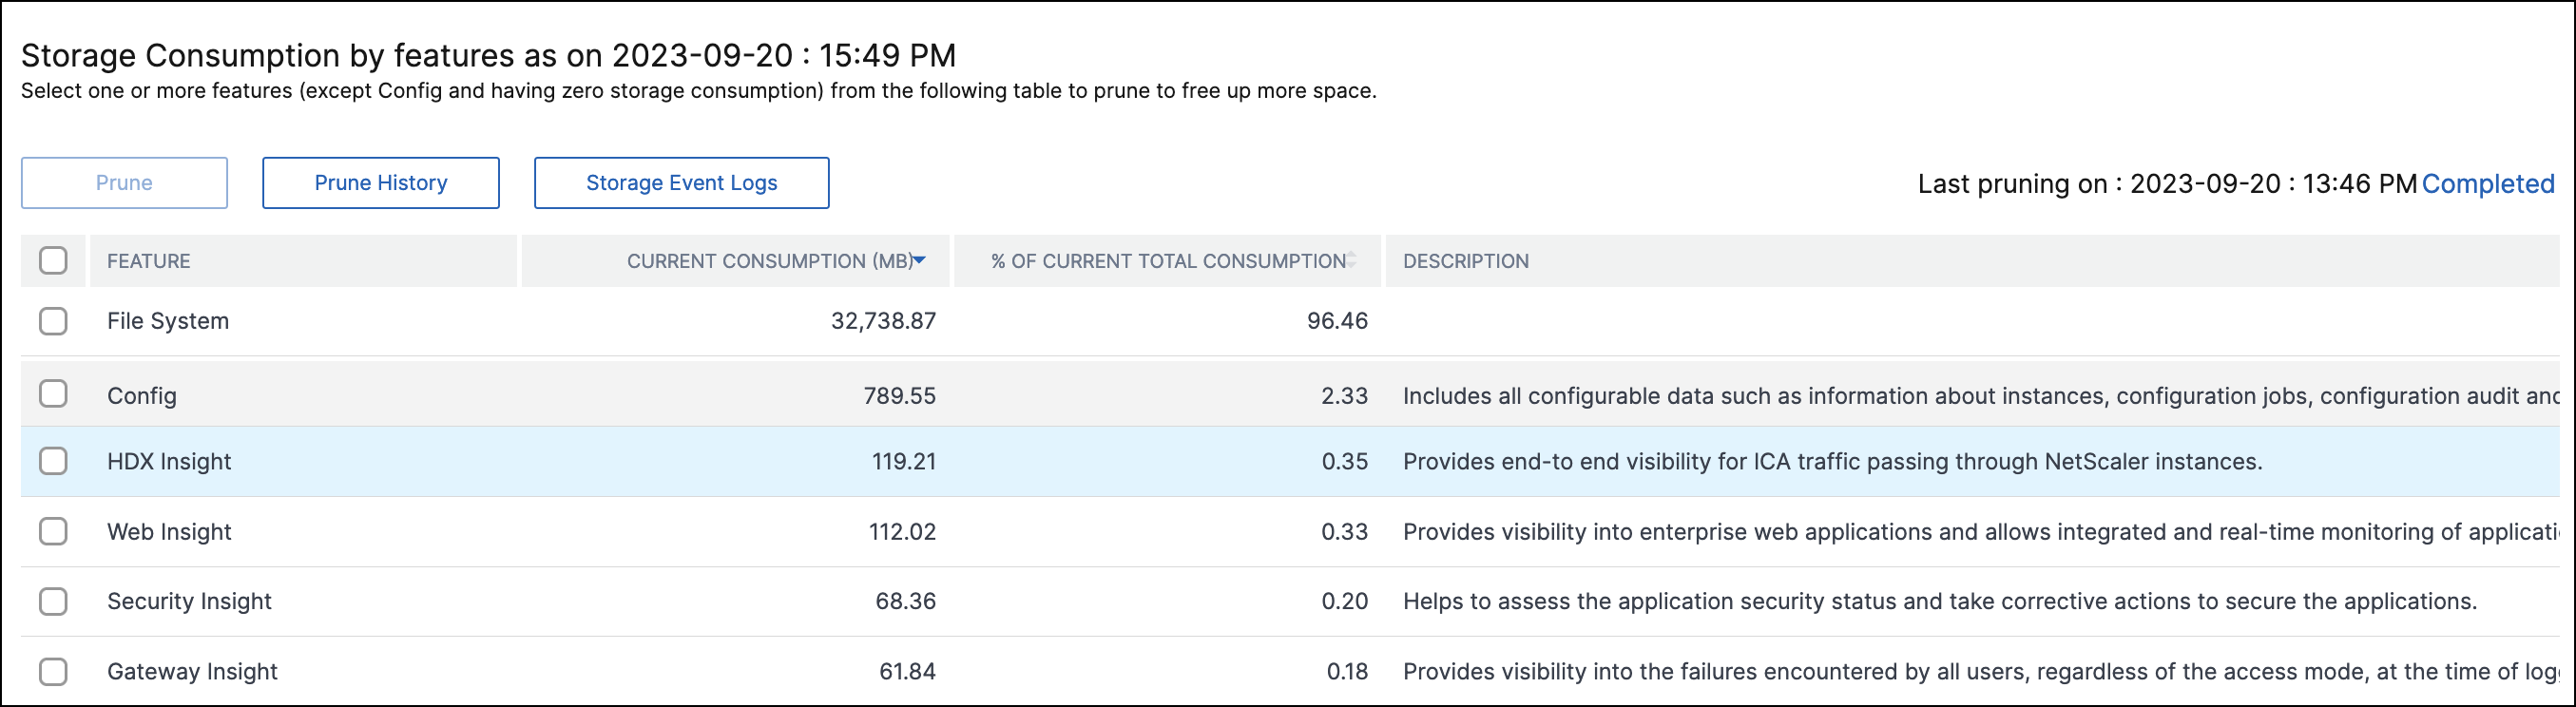
If you want to sort the table entries, the headers of the table. NetScaler Console alpha-numerically sorts the table from top to bottom based on the data in the chosen column. To sort the table in reverse order, click the column heading again.
For information on pruning your data, prune history, and Storage Event logs, see Manage your data storage
Share
Share
This Preview product documentation is Cloud Software Group Confidential.
You agree to hold this documentation confidential pursuant to the terms of your Cloud Software Group Beta/Tech Preview Agreement.
The development, release and timing of any features or functionality described in the Preview documentation remains at our sole discretion and are subject to change without notice or consultation.
The documentation is for informational purposes only and is not a commitment, promise or legal obligation to deliver any material, code or functionality and should not be relied upon in making Cloud Software Group product purchase decisions.
If you do not agree, select I DO NOT AGREE to exit.